Unlock document.
This document is partially blurred.
Unlock all pages and 1 million more documents.
Get Access
True or False: The Z score of a value measures how many standard deviations the value
is from the mean.
TABLE 8-17
A random sample of 100 stores from a large chain of 500 garden supply stores was
selected to determine the mean number of lawnmowers sold at an end-of-season
clearance sale. The sample results indicated a mean of 6 and a standard deviation of 2
lawnmowers sold. A 95% confidence interval (5.623 to 6.377) was established based on
these results.
True or False: Referring to Table 8-17, of all possible samples of 100 stores taken from
the population of 1,000 stores, 95% of the confidence intervals developed will contain
the true population mean within the interval.
True or False: A population with 200 elements has an arithmetic mean of 10. From this
information, it can be shown that the population standard deviation is 15.
True or False: It is not possible for the chart to be out-of-control when the R chart is

in control.
TABLE 8-5
A sample of salary offers (in thousands of dollars) given to management majors is: 48,
51, 46, 52, 47, 48, 47, 50, 51, and 59. Using this data to obtain a 95% confidence
interval resulted in an interval from 47.19 to 52.61.
True or False: Referring to Table 8-5, 95% of the sample means will fall between 47.19
and 52.61.
TABLE 9-7
A major home improvement store conducted its biggest brand recognition campaign in
the company's history. A series of new television advertisements featuring well-known
entertainers and sports figures were launched. A key metric for the success of television
advertisements is the proportion of viewers who "like the ads a lot". A study of 1,189
adults who viewed the ads reported that 230 indicated that they "like the ads a lot." The
percentage of a typical television advertisement receiving the "like the ads a lot" score
is believed to be 22%. Company officials wanted to know if there is evidence that the
series of television advertisements are less successful than the typical ad (i.e. if there is
evidence that the population proportion of "like the ads a lot" for the company's ads is
less than 0.22) at a 0.01 level of significance.
True or False: Referring to Table 9-7, the value of is 0.90.
True or False: Suppose = 80 and = 20 for a population. In a sample where n = 100 is
randomly taken, 95% of all possible sample means will fall above 76.71.
TABLE 9-6
The quality control engineer for a furniture manufacturer is interested in the mean
amount of force necessary to produce cracks in stressed oak furniture. She performs a
two-tail test of the null hypothesis that the mean for the stressed oak furniture is 650.
The calculated value of the Z test statistic is a positive number that leads to a p-value of
0.080 for the test.
True or False: Referring to Table 9-6, if the test is performed with a level of
significance of 0.05, the engineer can conclude that the mean amount of force necessary
to produce cracks in stressed oak furniture is 650.
True or False: A least squares linear trend line is just a simple regression line with the
years recorded.
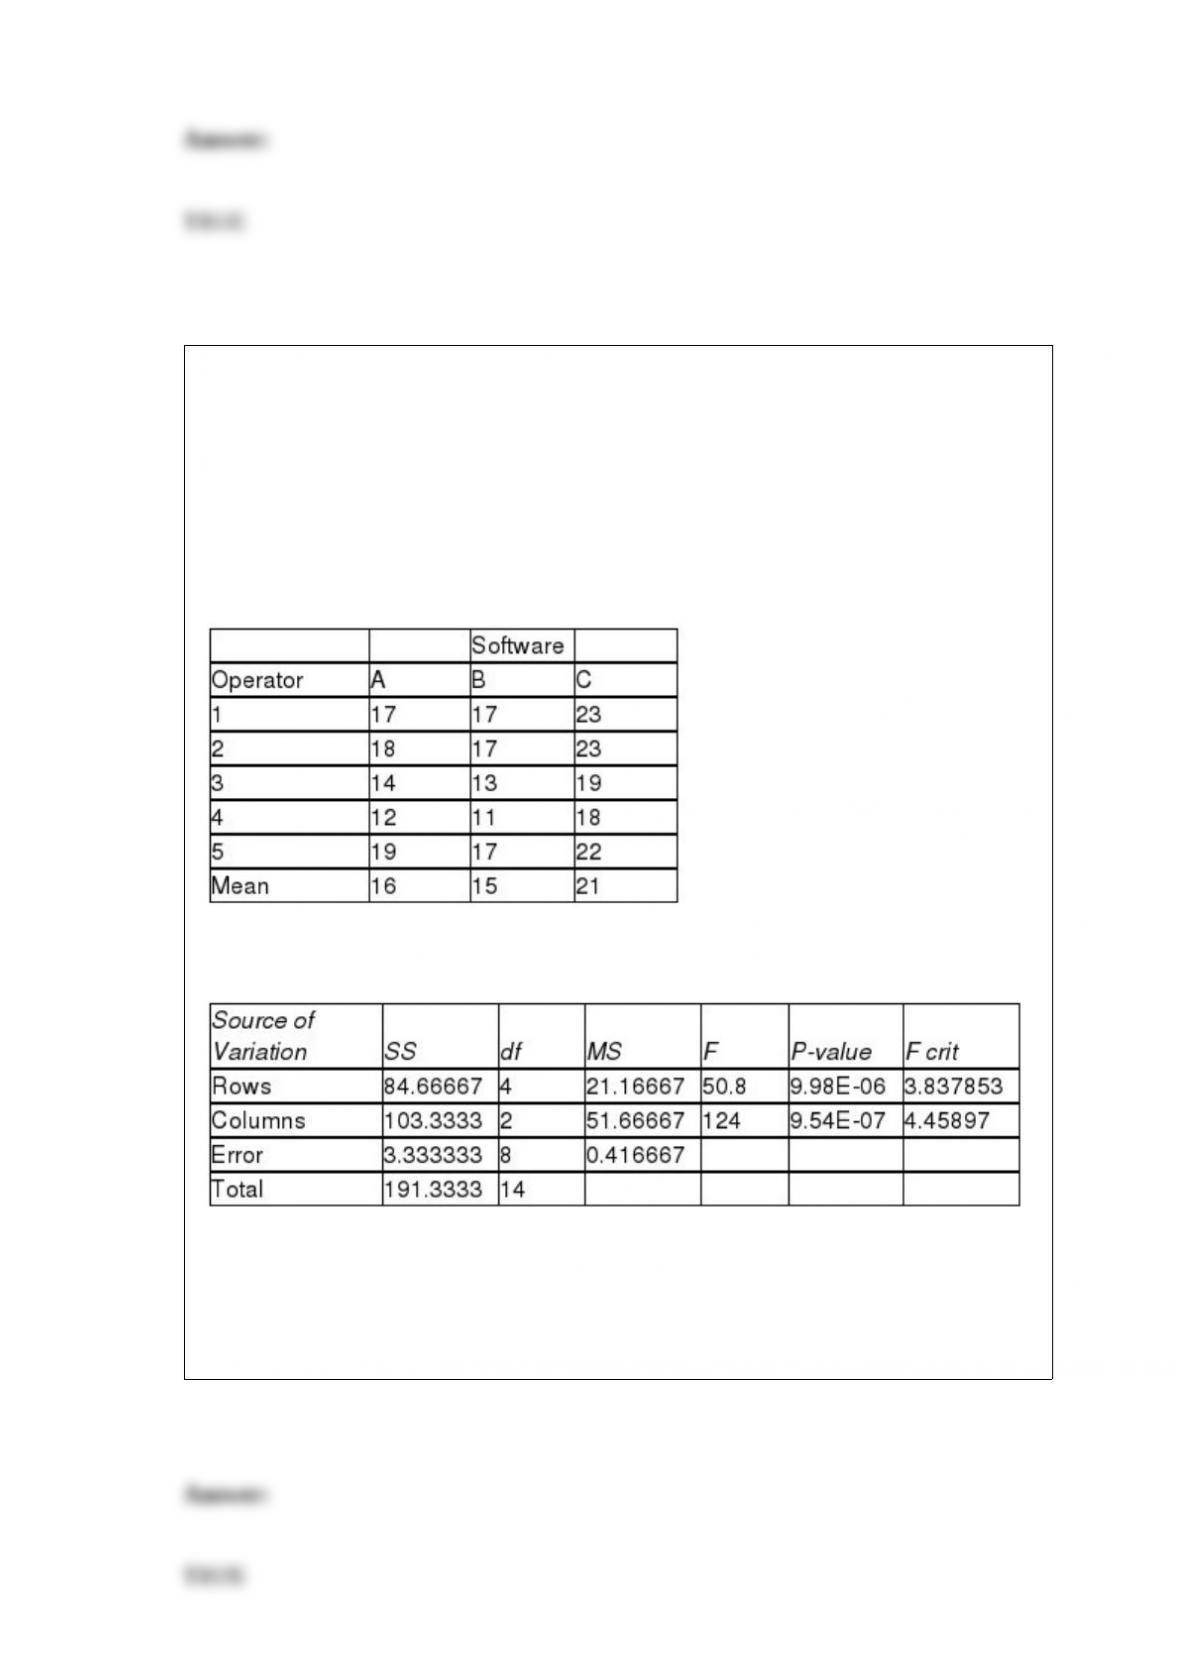
TABLE 11-8
An important factor in selecting database software is the time required for a user to
learn how to use the system. To evaluate three potential brands (A, B and C) of database
software, a company designed a test involving five different employees. To reduce
variability due to differences among employees, each of the five employees is trained
on each of the three different brands. The amount of time (in hours) needed to learn
each of the three different brands is given below:
Below is the Excel output for the randomized block design:
True or False: Referring to Table 11-8, the relative efficiency means that 15.23 times as
many observations in each brand would be needed in a one-way ANOVA design as
compared to the randomized block design in order to obtain the same precision for
comparison of the different means.

TABLE 14-8
A financial analyst wanted to examine the relationship between salary
(in $1,000) and 2 variables: age
(X1 = Age) and experience in the field (X2 = Exper). He took a sample
of 20 employees and obtained the following Microsoft Excel output:
Also, the sum of squares due to the regression for the model that
includes only Age is 5022.0654 while the sum of squares due to the
regression for the model that includes only Exper is 125.9848.True or
False: Referring to Table 14-8, the analyst wants to use a t test to test
for the significance of the coefficient of X2. At a level of significance of
0.01, the department head would decide that β2 ≠0.
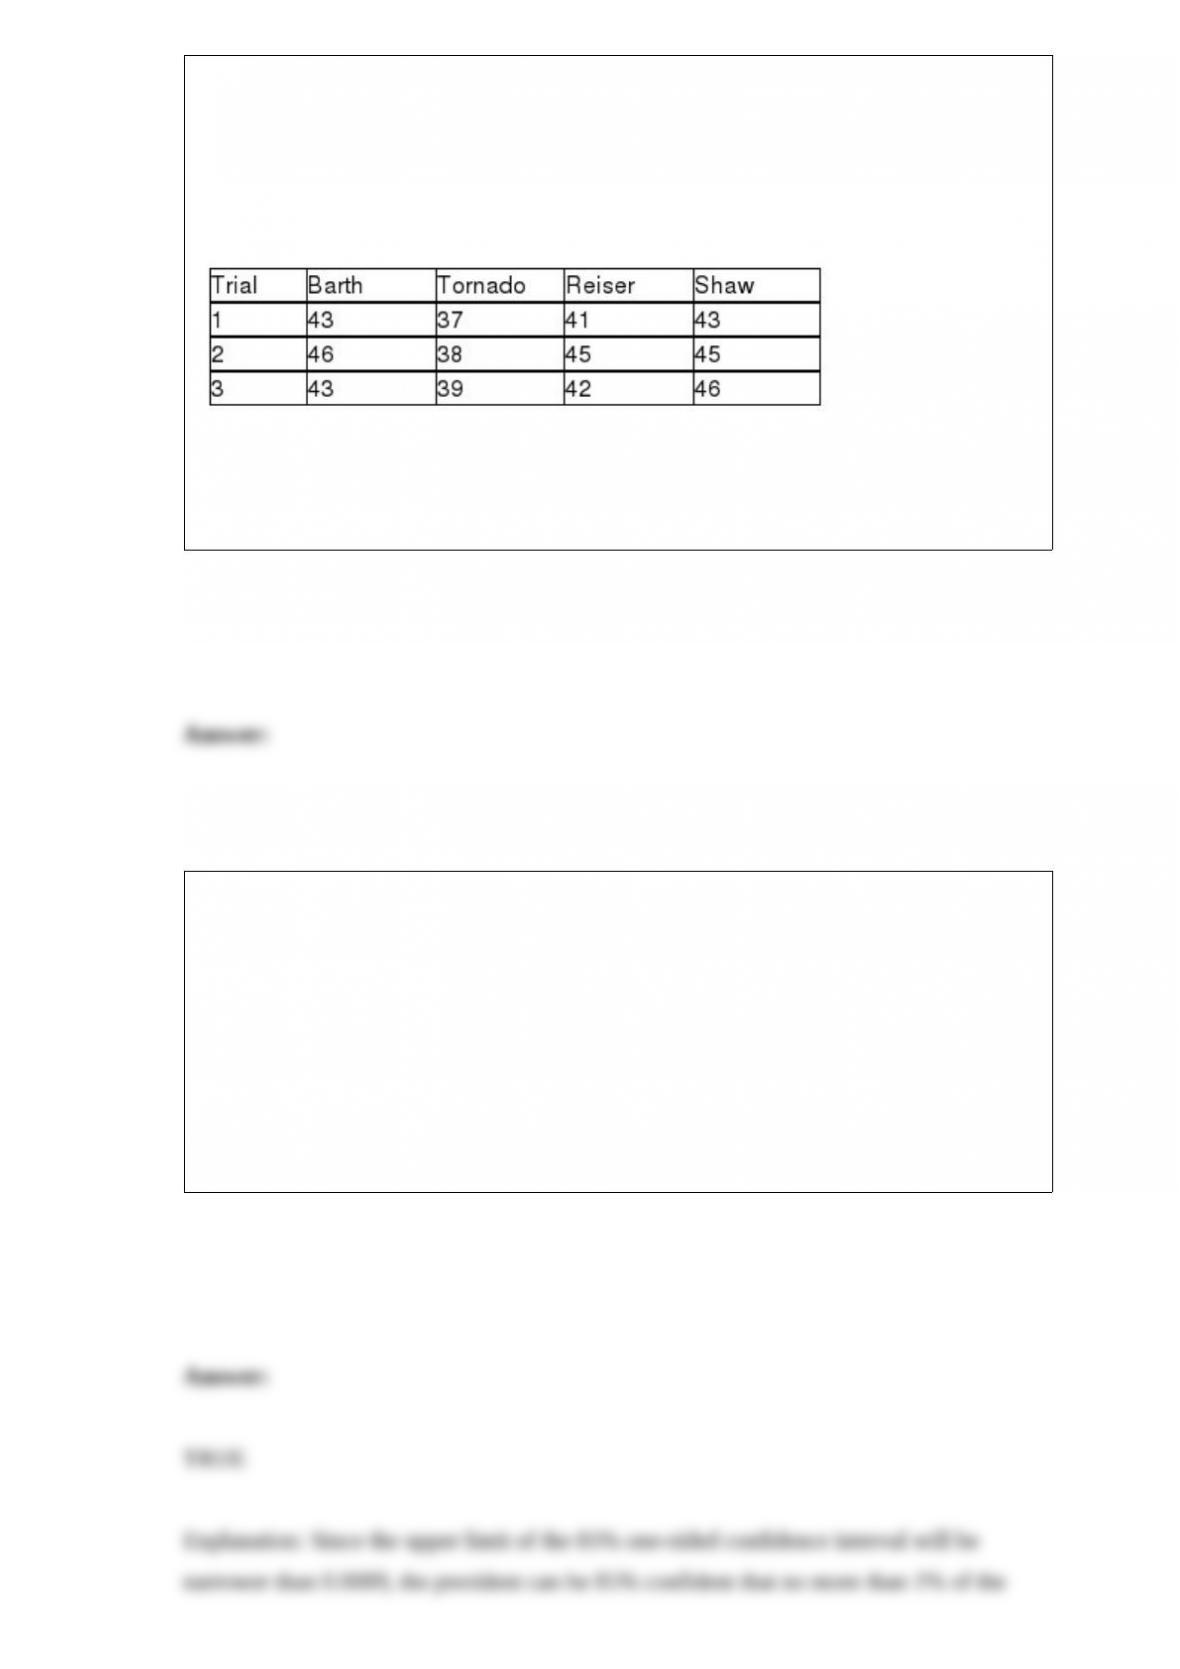
TABLE 11-3
As part of an evaluation program, a sporting goods retailer wanted to compare the
downhill coasting speeds of 4 brands of bicycles. She took 3 of each brand and
determined their maximum downhill speeds. The results are presented in miles per hour
in the table below.
True or False: Referring to Table 11-3, based on the Tukey-Kramer procedure with an
overall level of significance of 0.05, the retailer would decide that there is a significant
difference between all pairs of mean speeds.
TABLE 8-16
The president of a university is concerned that the percentage of students who have
cheated on an exam is higher than the 1% acceptable level. A confidential random
sample of 1,000 students from a population of 7,000 revealed that 6 of them said that
they had cheated on an exam during the last semester.
True or False: Referring to Table 8-16, using the 90% one-sided confidence interval, the
superintendent can be 85% confident that no more than 1% of the students at the
university had cheated on an exam during the last semester.
The use of preservatives by food processors has become a controversial issue. Suppose
2 preservatives are extensively tested and determined safe for use in meats. A processor
wants to compare the preservatives for their effects on retarding spoilage. They will
choose to use the preservative that can keep the meat fresh for the longest amount of
time. Suppose 15 cuts of fresh meat are treated with preservative I and 15 are treated
with preservative II, and the number of hours until spoilage begins is recorded for each
of the 30 cuts of meat. Suppose the variability of the number of hours until spoilage is
the same for meat treated by both preservatives but the normal probability plots reveal
that the number of hours until spoilage is right-skewed for the 15 cuts treated by
preservative I and left-skewed for the 15 cuts treated with preservative II. Which of the
following tests will be the most appropriate?
A) Pooled-variance t test
B) Paired t test
C) Wilcoxon rank sum test
D) Levene's test
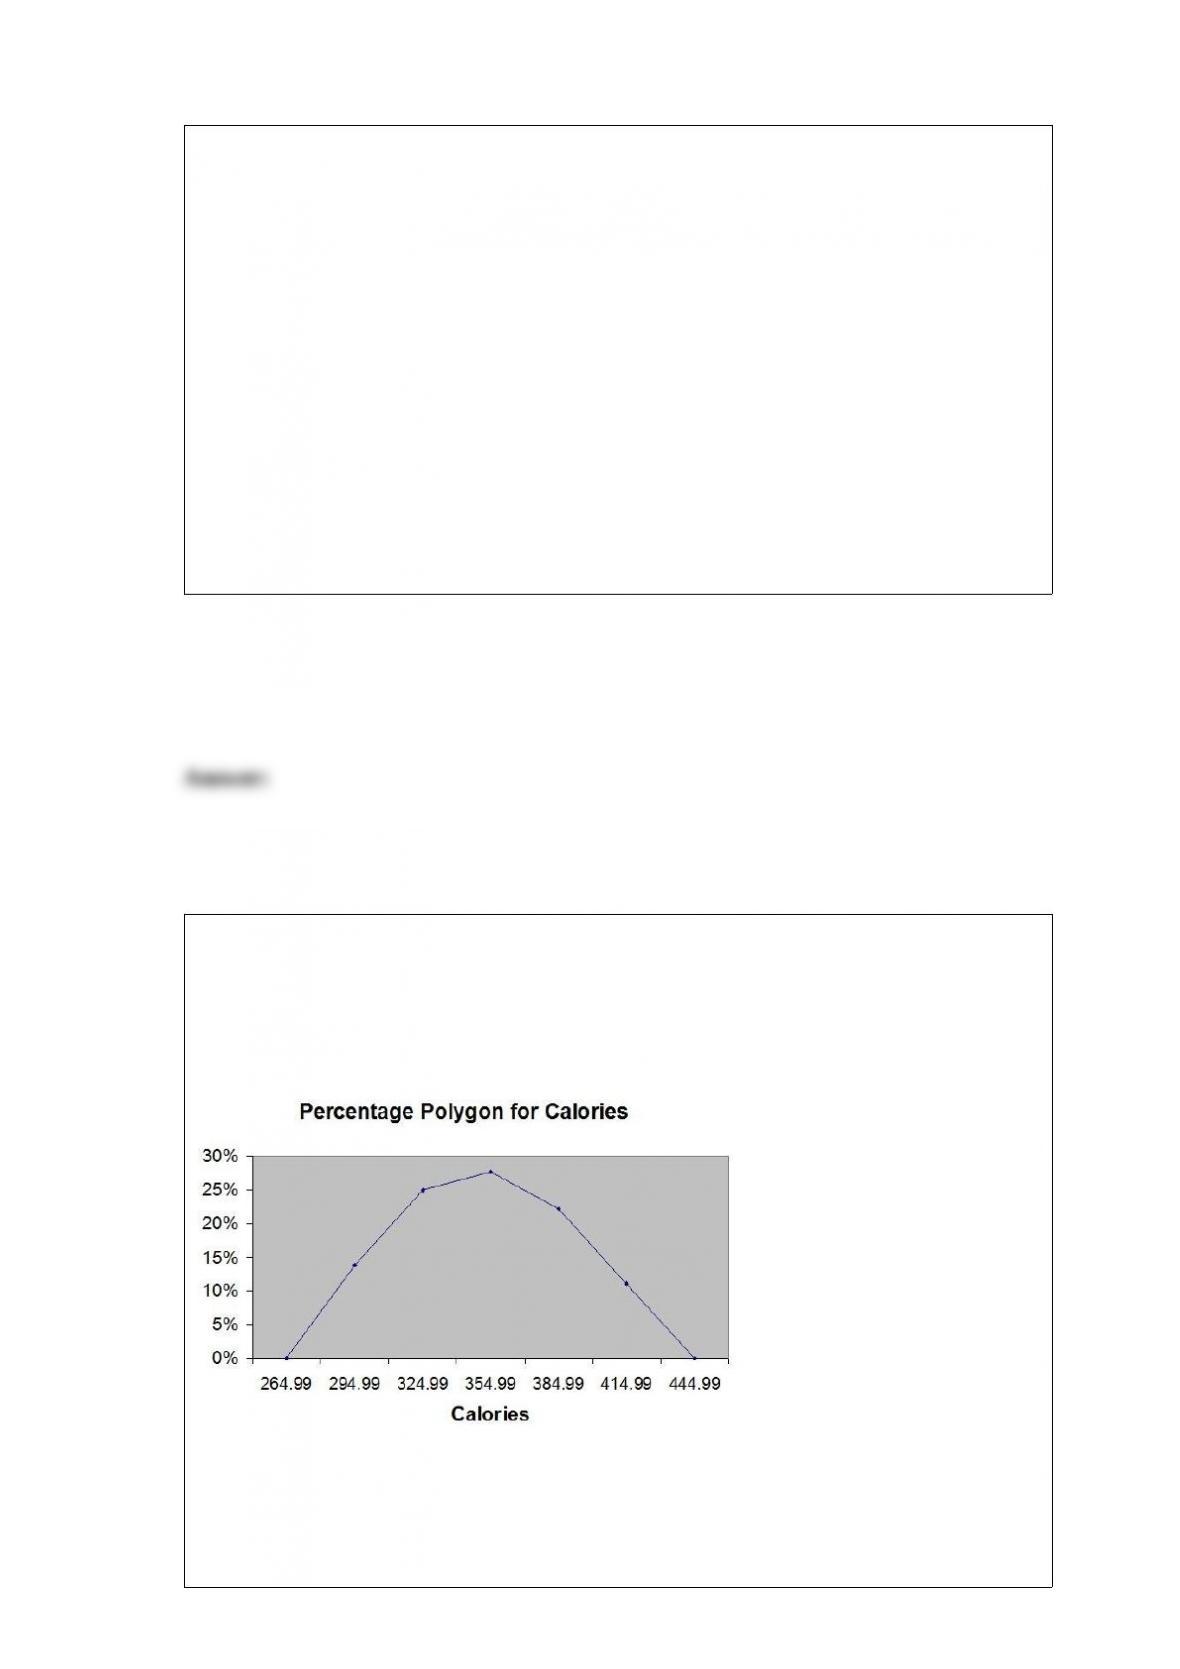
TABLE 2-16
The figure below is the percentage polygon for the amount of calories for a sample of
36 pizza products where the upper limits of the intervals are: 310, 340, 370, 400 and
430.
Referring to Table 2-16, roughly what percentage of pizza products contains between
340 and 400 calories?
A) 22%
B) 25%
C) 28%
D) 50%
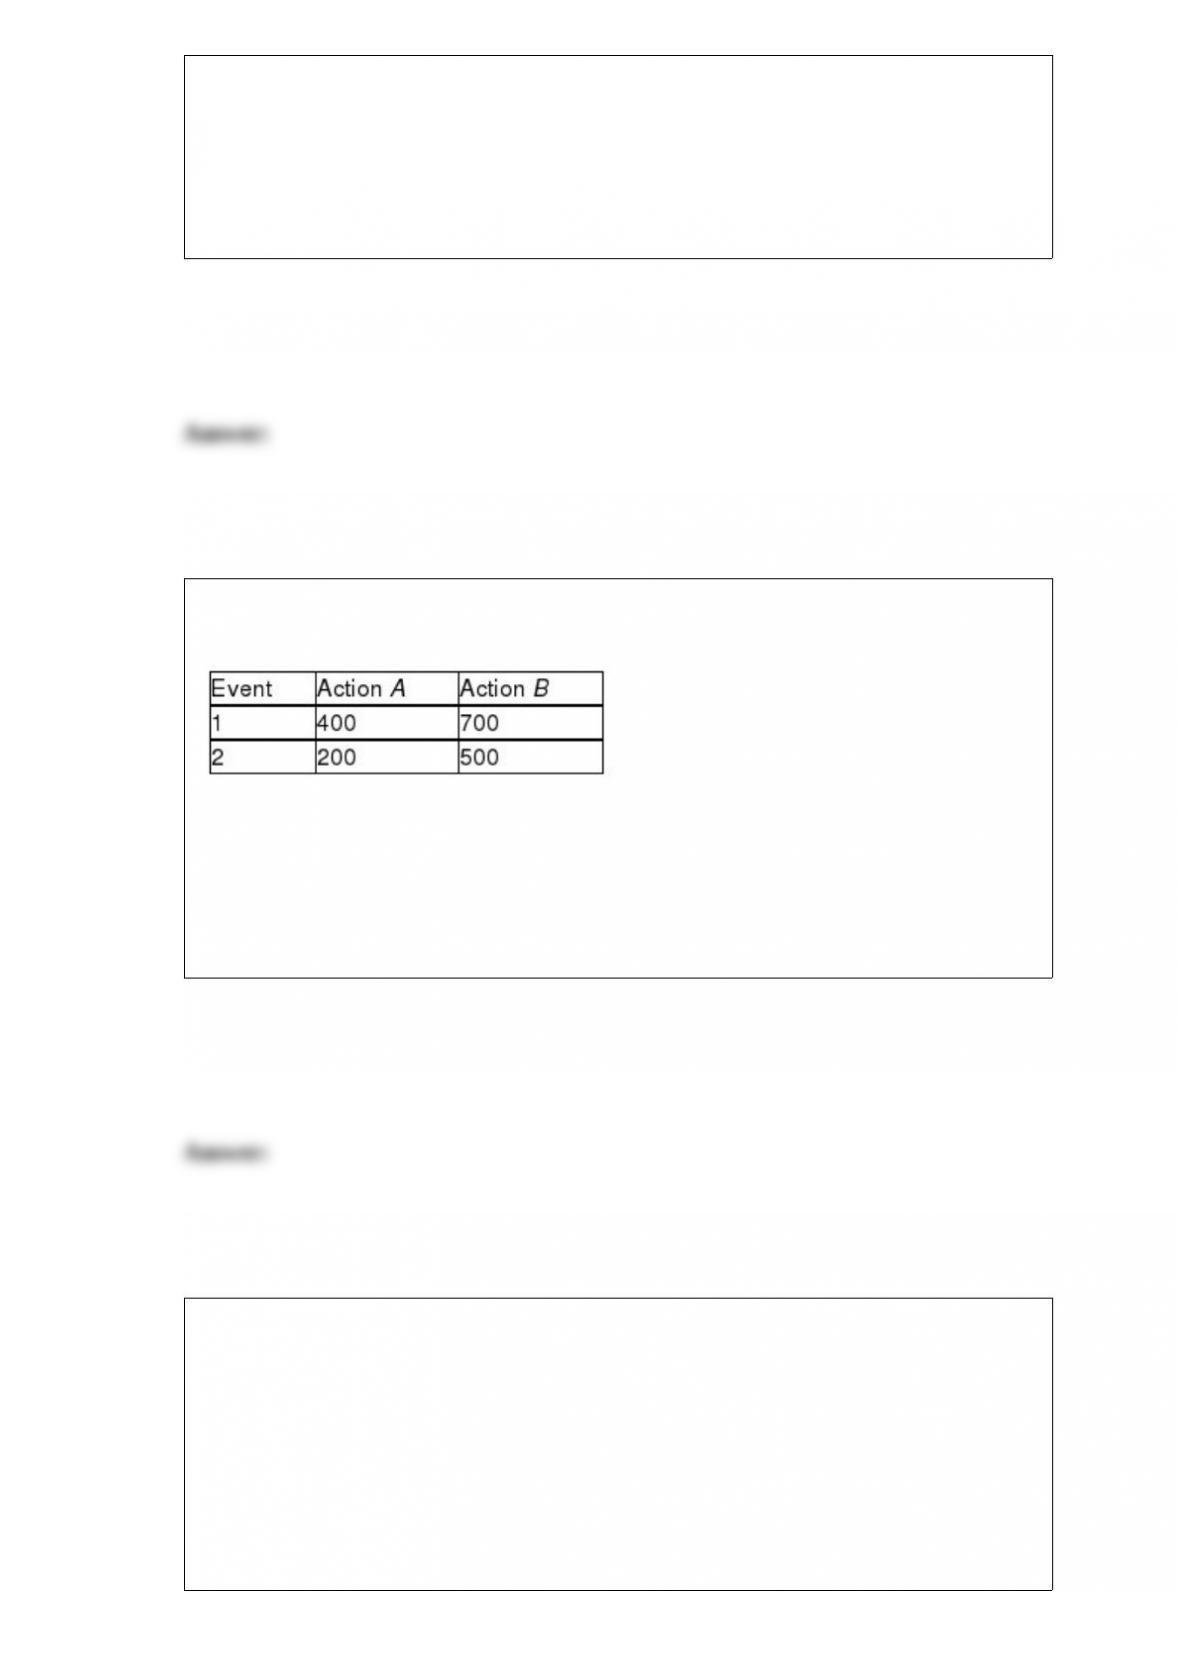
TABLE 19-2
The following payoff matrix is given in dollars.
Suppose the probability of Event 1 is 0.5 and Event 2 is 0.5.
Referring to Table 19-2, what is the best action using the maximax criterion?
A) Action A
B) Action B
C) Either Action A or Action B
D) It cannot be determined.
TABLE 1-1
The manager of the customer service division of a major consumer electronics company
is interested in determining whether the customers who have purchased a Blu-ray
player made by the company over the past 12 months are satisfied with their products.
Referring to Table 1-1, the possible responses to the question "What is your annual
income rounded to the nearest thousands?" result in

A) a nominal scale variable.
B) an ordinal scale variable.
C) an interval scale variable.
D) a ratio scale variable.
In right-skewed distributions, which of the following is the correct statement?
A) The distance from Q1 to Q2 is greater than the distance from Q2 to Q3.
B) The distance from Q1 to Q2 is less than the distance from Q2 to Q3.
C) The arithmetic mean is less than the median.
D) The mode is greater than the arithmetic mean.
TABLE 17-1
A real estate builder wishes to determine how house size (House) is influenced by
family income (Income), family size (Size), and education of the head of household
(School). House size is measured in hundreds of square feet, income is measured in
thousands of dollars, and education is in years. The builder randomly selected 50
families and ran the multiple regression. Microsoft Excel output is provided below:
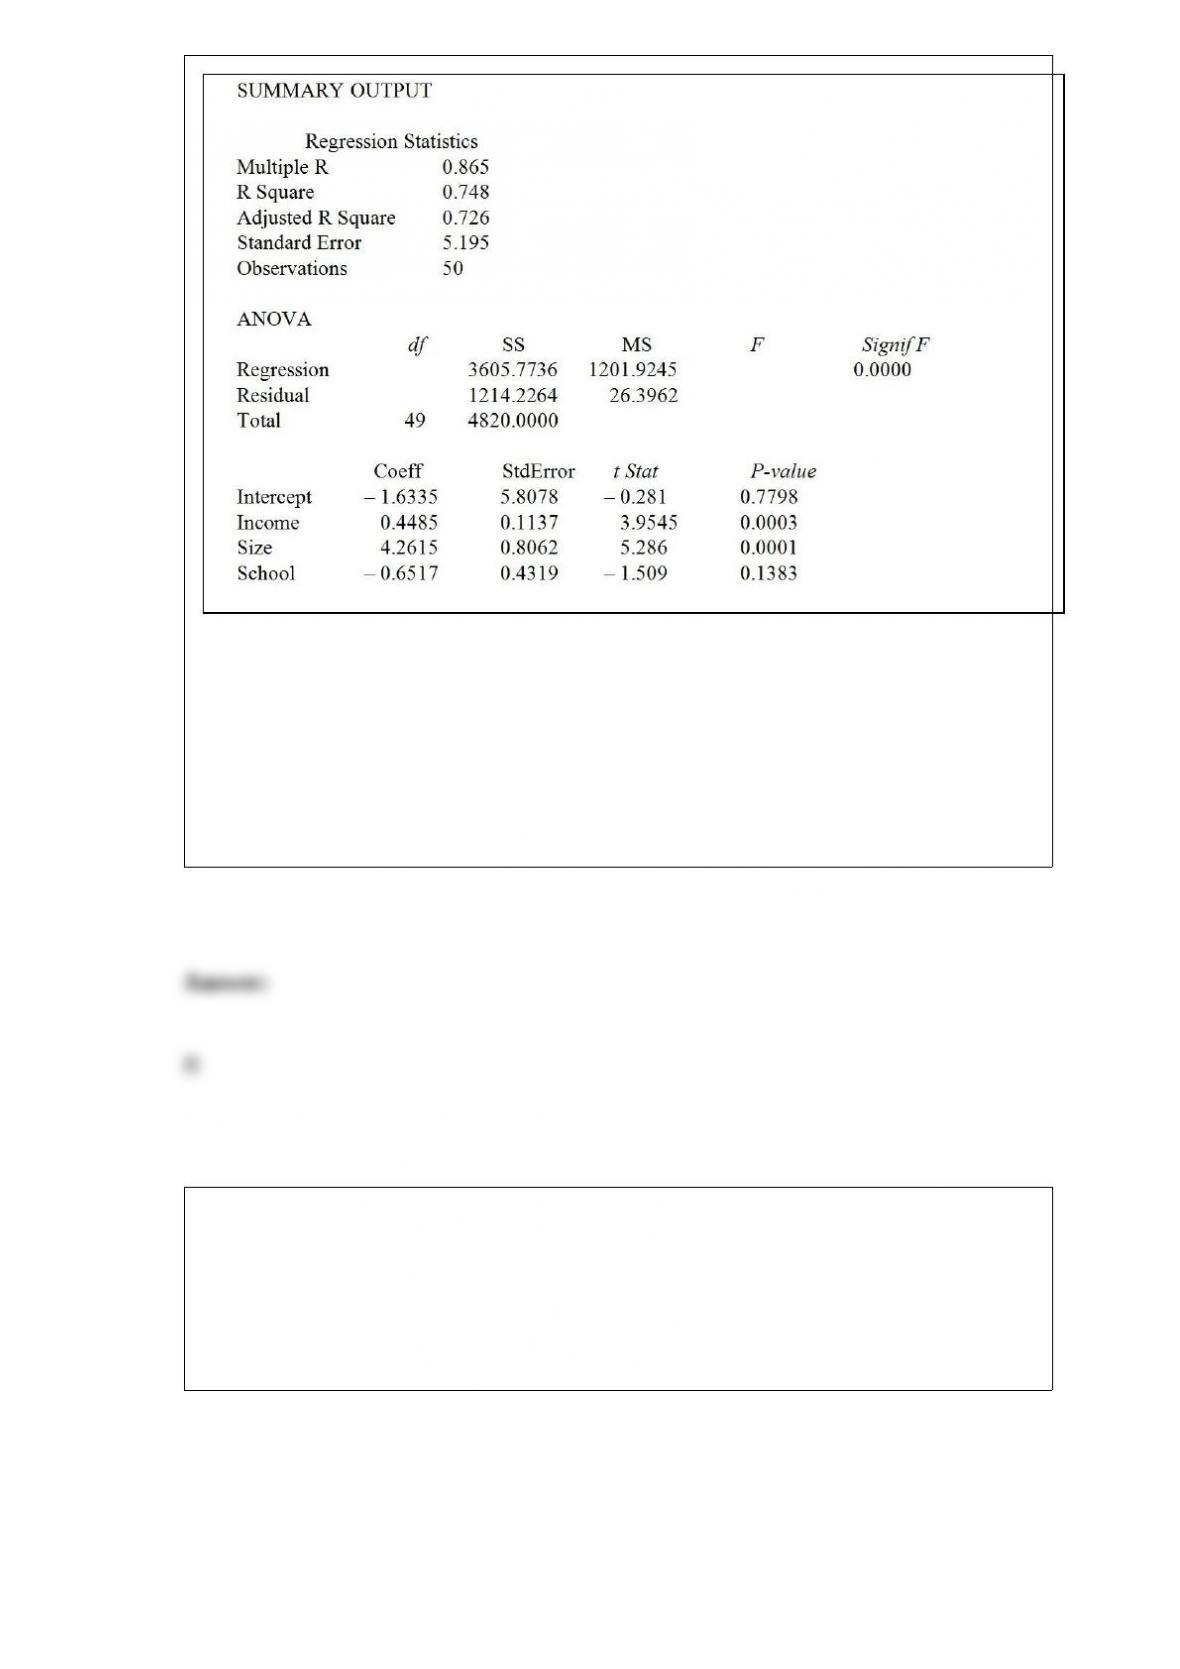
Referring to Table 17-1, one individual in the sample had an annual income of $40,000,
a family size of 1, and an education of 8 years. This individual owned a home with an
area of 1,000 square feet (House = 10.00). What is the residual (in hundreds of square
feet) for this data point?
A) -6.99
B) -5.35
C) 5.40
D) 16.99
TABLE 10-2
A researcher randomly sampled 30 graduates of an MBA program and recorded data
concerning their starting salaries. Of primary interest to the researcher was the effect of
gender on starting salaries. The result of the pooled-variance t-test of the mean salaries
of the females (Population 1) and males (Population 2) in the sample is given below.
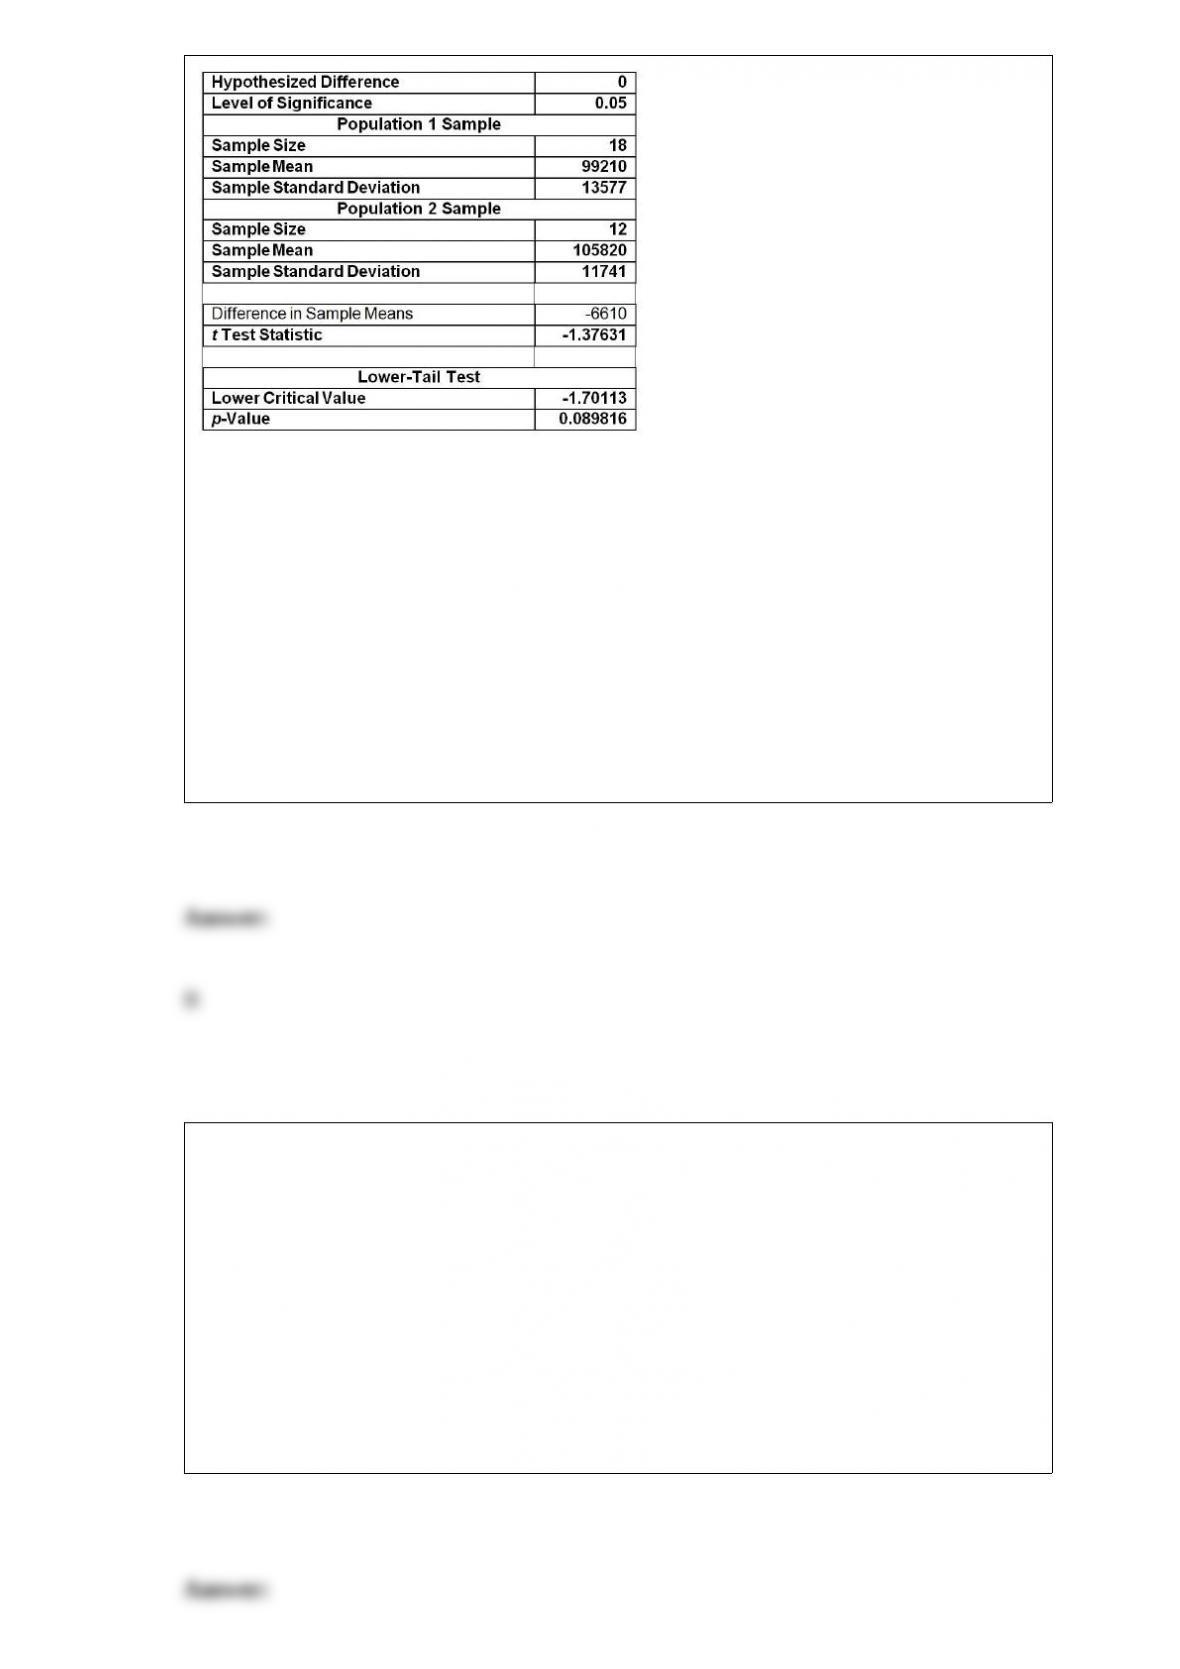
Referring to Table 10-2, the researcher was attempting to show statistically that the
female MBA graduates have a significantly lower mean starting salary than the male
MBA graduates. From the analysis in Table 10-2, the correct test statistic is
A) -6610.
B) -1.3763.
C) -1.7011.
D) 0.0898.
According to the empirical rule, if the data form a "bell-shaped" normal distribution,
________ percent of the observations will be contained within 1 standard deviation
around the arithmetic mean.
A) 68.26
B) 75.00
C) 88.89
D) 93.75

The owner of a fish market has an assistant who has determined that the weights of
catfish are normally distributed, with a mean of 3.2 pounds and a standard deviation of
0.8 pound. What percentage of samples of 4 fish will have sample means between 3.0
and 4.0 pounds?
A) 84%
B) 67%
C) 29%
D) 16%
TABLE 18-3
A quality control analyst for a light bulb manufacturer is concerned that the time it takes
to produce a batch of light bulbs is too erratic. Accordingly, the analyst randomly
surveys 10 production periods each day for 14 days and records the sample mean and
range for each day.
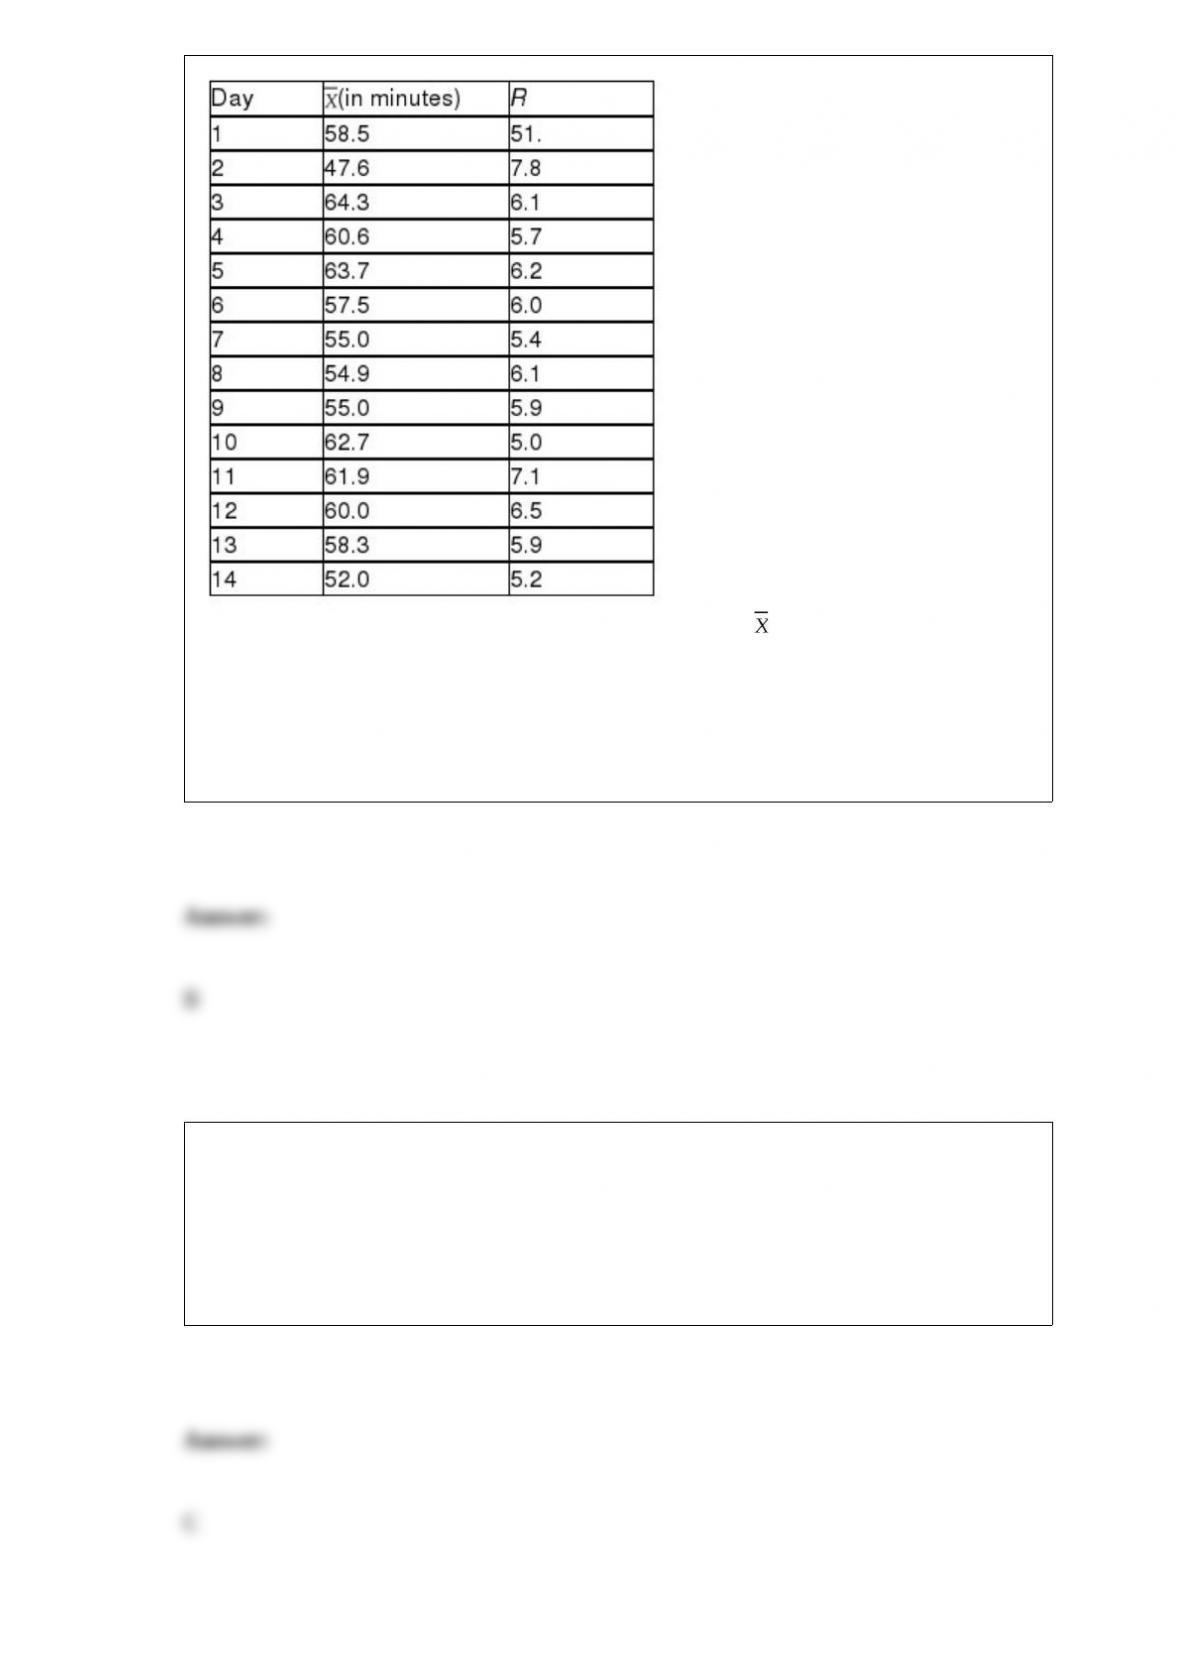
Referring to Table 18-3, suppose the analyst constructs an chart to see if the
production process is in-control. What is the lower control limit (LCL) for this chart?
A) 47.60
B) 56.15
C) 57.15
D) 58.05
The Shewhart-Deming cycle plays an important role in which of the following
Deming's 14 points for management?
A) Adopt the new philosophy.
B) Break down barriers between staff areas.
C) Create constancy of purpose for improvement of product and services.
D) Eliminate slogans, exhortation, and targets for the workforce.

An agronomist wants to compare the crop yield of 3 varieties of chickpea seeds. She
plants all 3 varieties of the seeds on each of 5 different patches of fields. She then
measures the crop yield in bushels per acre. Which of the following tests will be the
most appropriate to find out if there is any difference in crop yield among the 3
varieties?
A) Paired t test
B) One-way ANOVA F test for differences among more than two means
C) Randomized block F test for differences among more than two means
D) Two-way ANOVA F test for the variety effect
TABLE 17-9
What are the factors that determine the acceleration time (in sec.) from 0 to 60 miles per
hour of a car? Data on the following variables for 171 different vehicle models were
collected:
Accel Time: Acceleration time in sec.
Cargo Vol: Cargo volume in cu. ft.
HP: Horsepower
MPG: Miles per gallon
SUV: 1 if the vehicle model is an SUV with Coupe as the base when SUV and Sedan
are both 0
Sedan: 1 if the vehicle model is a sedan with Coupe as the base when SUV and Sedan
are both 0
The regression results using acceleration time as the dependent variable and the
remaining variables as the independent variables are presented below.
The various residual plots are as shown below.
The coefficient of partial determination ( ) of each of the 5
predictors are, respectively, 0.0380, 0.4376, 0.0248, 0.0188, and 0.0312.
The coefficient of multiple determination for the regression model using each of the 5
variables Xj as the dependent variable and all other X variables as independent variables
( ) are, respectively, 0.7461, 0.5676, 0.6764, 0.8582, 0.6632.
Referring to Table 17-9, which of the following assumptions is most likely violated
based on the normal probability plot?
A) Linearity
B) Normality of errors
C) Equal variance
D) None of the above
Which of the following statements about the method of exponential smoothing is not
true?
A) It gives greater weight to more recent data.
B) It can be used for forecasting.
C) It uses all earlier observations in each smoothing calculation.
D) It gives greater weight to the earlier observations in the series.
Referring to Table 14-8, the analyst wants to use a t test to test for
the significance of the coefficient of X2. The value of the test statistic
is ________.TABLE 14-8
A financial analyst wanted to examine the relationship between salary
(in $1,000) and 2 variables: age
(X1 = Age) and experience in the field (X2 = Exper). He took a sample
of 20 employees and obtained the following Microsoft Excel output:

Also, the sum of squares due to the regression for the model that
includes only Age is 5022.0654 while the sum of squares due to the
regression for the model that includes only Exper is 125.9848.
TABLE 11-8
An important factor in selecting database software is the time required for a user to
learn how to use the system. To evaluate three potential brands (A, B and C) of database
software, a company designed a test involving five different employees. To reduce
variability due to differences among employees, each of the five employees is trained
on each of the three different brands. The amount of time (in hours) needed to learn
each of the three different brands is given below:
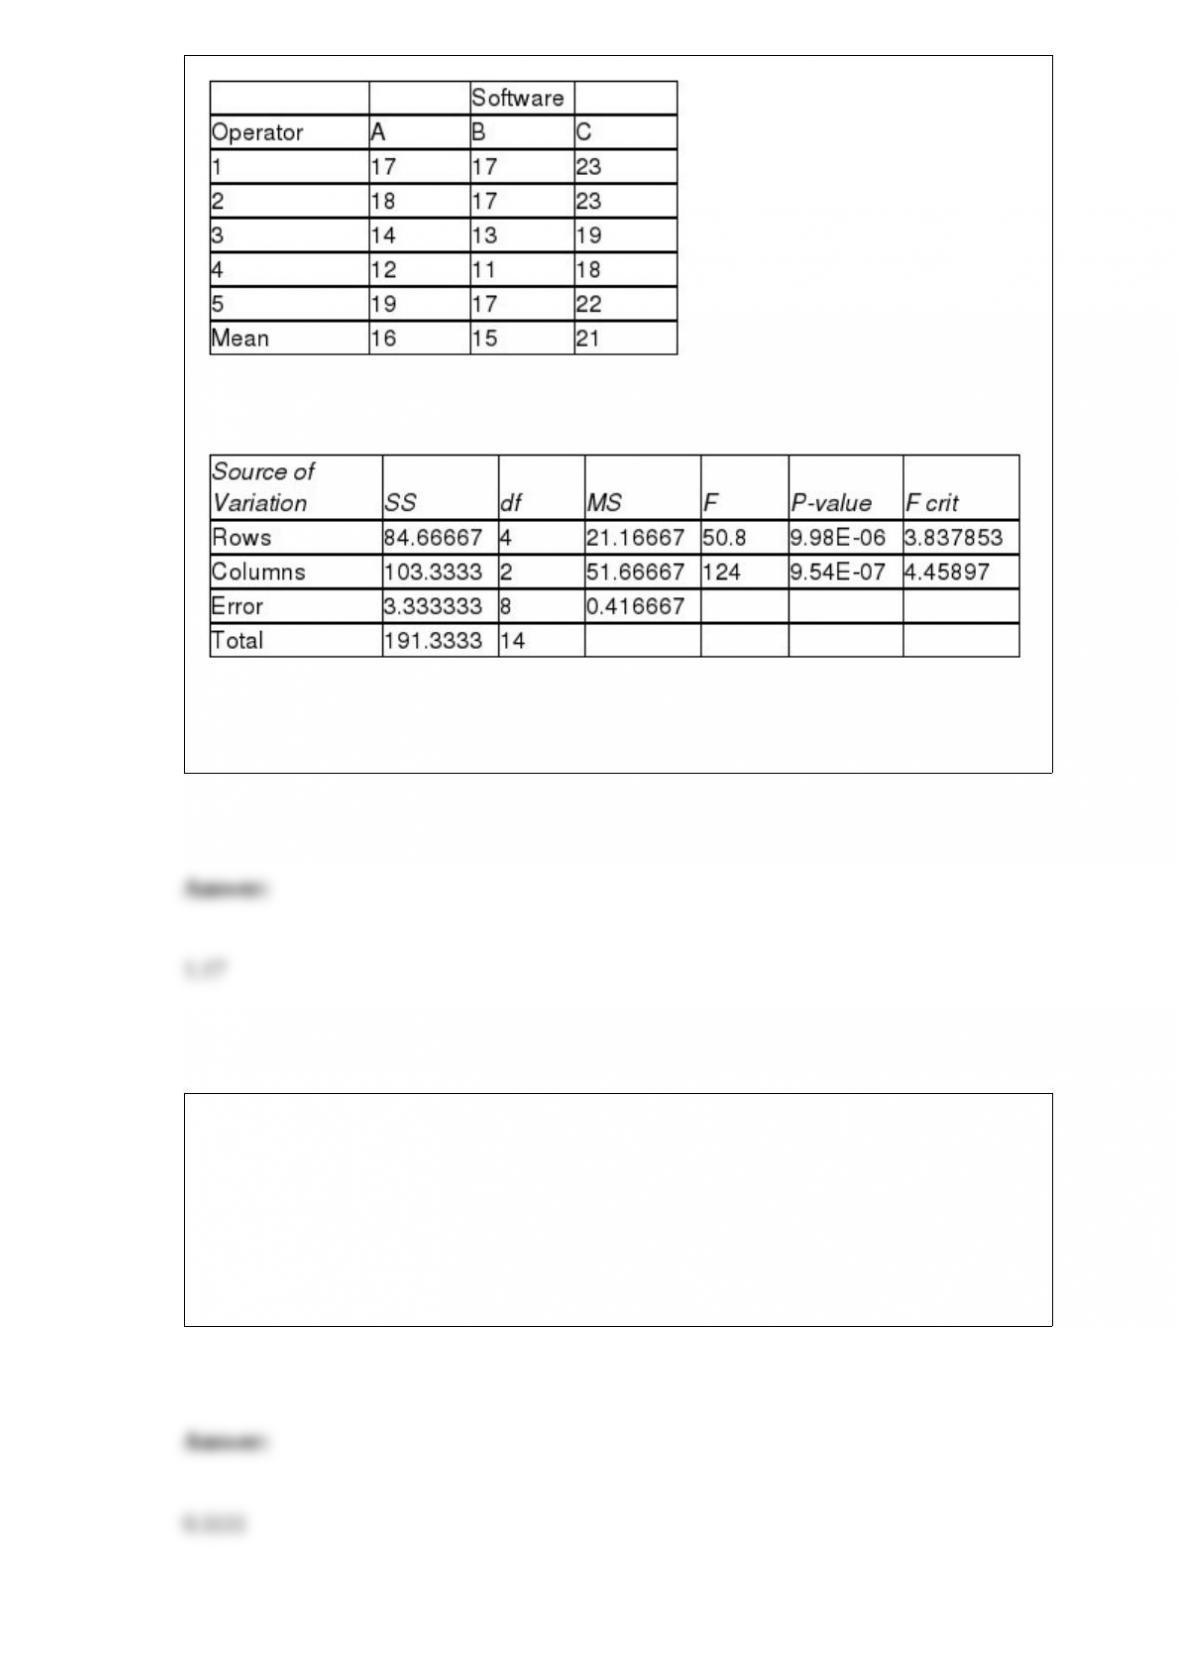
Below is the Excel output for the randomized block design:
Referring to Table 11-8, what is the critical range of the Studentized range distribution
for the Tukey multiple comparison procedure at the 5% level of significance?
TABLE 6-3
Suppose the time interval between two consecutive defective light bulbs from a
production line has a uniform distribution over an interval from 0 to 90 minutes.
Referring to Table 6-3, what is the probability that the time interval between two
consecutive defective light bulbs will be at least 80 minutes?
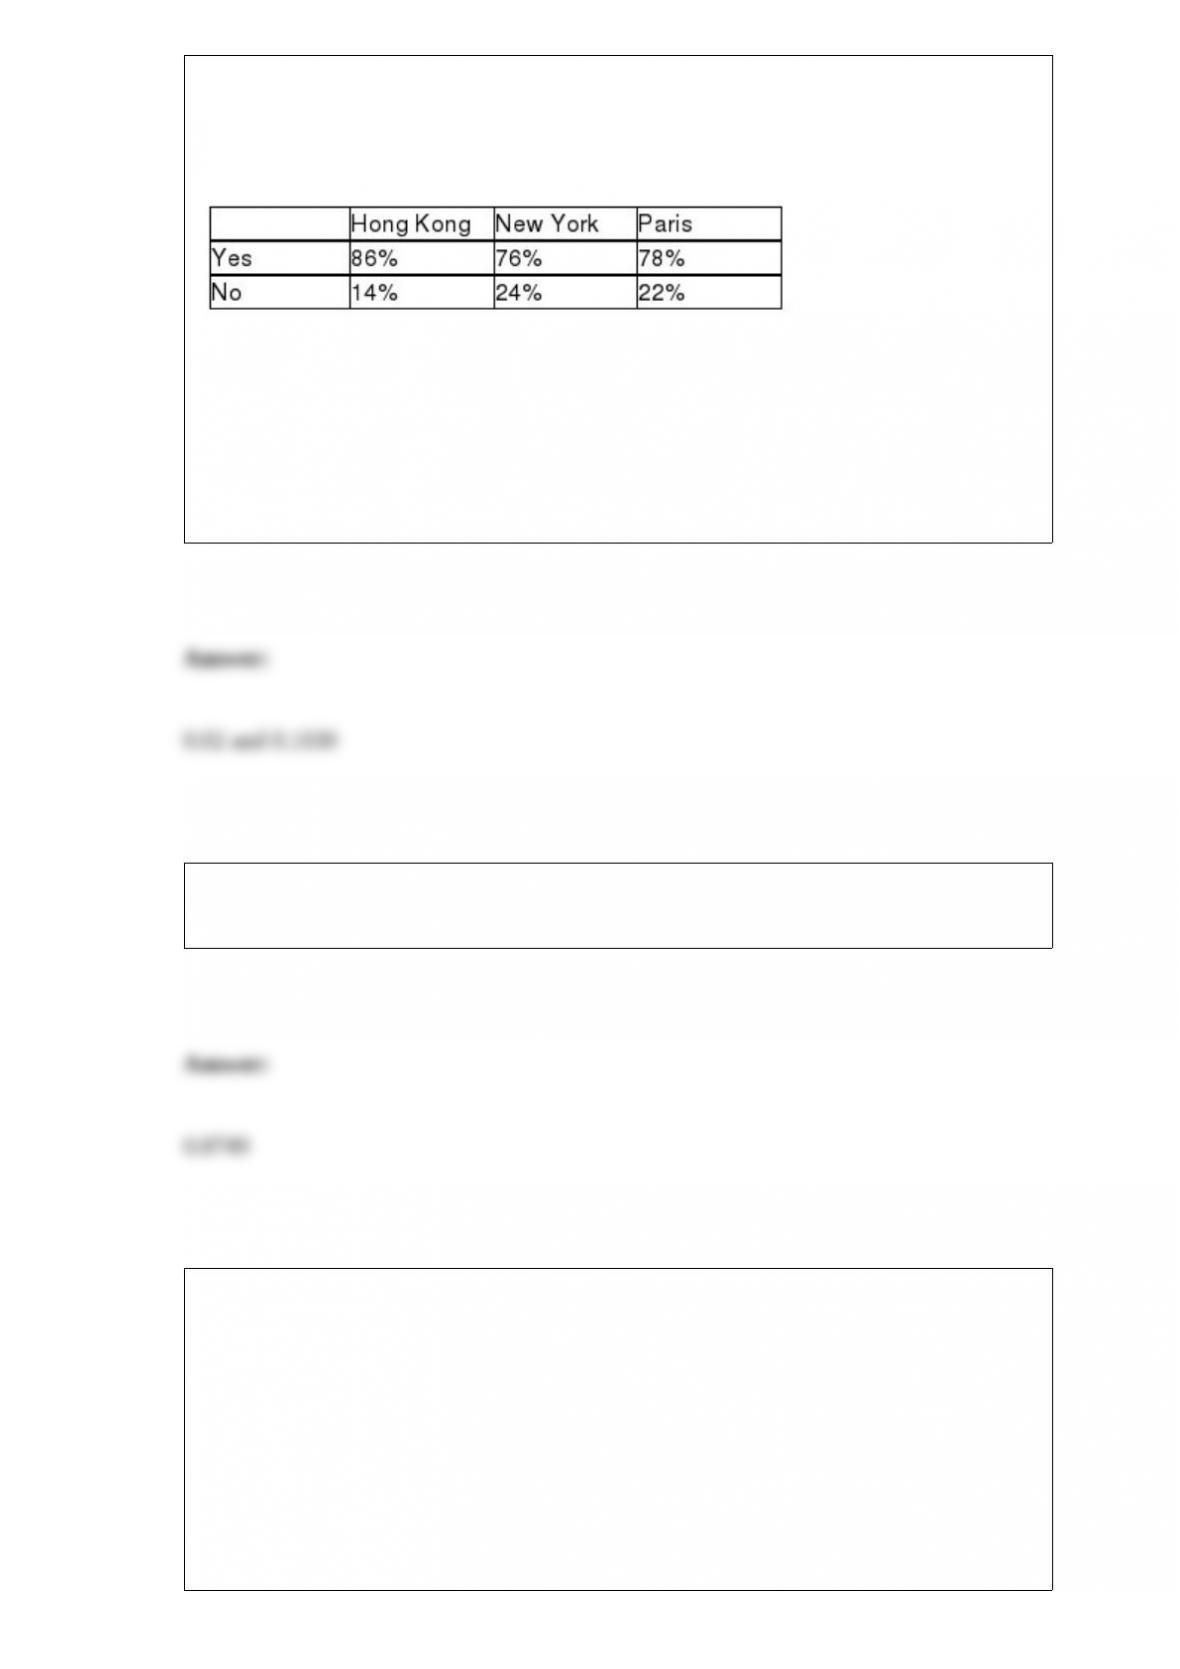
TABLE 12-7
Data on the percentage of 200 hotels in each of the three large cities across the world on
whether minibar charges are correctly posted at checkout are given below.
At the 0.05 level of significance, you want to know if there is evidence of a difference
in the proportion of hotels that correctly post minibar charges among the three cities.
Referring to Table 12-7, what are the values of the absolute difference and the critical
range for the Marascuilo procedure to test for the difference in proportions between
New York and Paris using a 0.05 level of significance?
Suppose Z has a standard normal distribution with a mean of 0 and standard deviation
of 1. The probability that Z is less than 1.15 is ________.
TABLE 9-11
An appliance manufacturer claims to have developed a compact microwave oven that
consumes a population mean of no more than 250 W. From previous studies, it is
believed that power consumption for microwave ovens is normally distributed with a
population standard deviation of 15 W. If there is evidence that the population mean
consumption is greater than 250 W, the manufacturer will be unable to make the claim.
Referring to Table 9-11, if you select a sample of 20 compact microwave ovens and are
willing to have a level of significance of 0.10, the power of the test is ________ if the

mean power consumption of all such microwave ovens is in fact 257.3 W.


