True or False: If we use the chi-square method of analysis to test for the difference
between proportions, we must assume that there are at least 5 observed frequencies in
each cell of the contingency table.
True or False: In inferential statistics, the standard error of the sample mean assesses
the uncertainty or error of estimation.
True or False: In calculating the standard error of the estimate, SYX = , there are n
– k – 1 degrees of freedom, where n is the sample size and k represents the number of
independent variables in the model.
TABLE 12-20
A filling machine at a local soft drinks company is calibrated to fill the cans at a mean
amount of 12 fluid ounces and a standard deviation of 0.5 ounces. The company wants
to test whether the standard deviation of the amount filled by the machine is 0.5 ounces.
A random sample of 15 cans filled by the machine reveals a standard deviation of 0.67
ounces.
True or False: Referring to Table 12-20, there is sufficient evidence to conclude that the
standard deviation of the amount filled by the machine is not exactly 0.5 ounces when
using a 5% level of significance.
True or False: The smaller the p-value, the stronger the evidence is against the null
hypothesis.
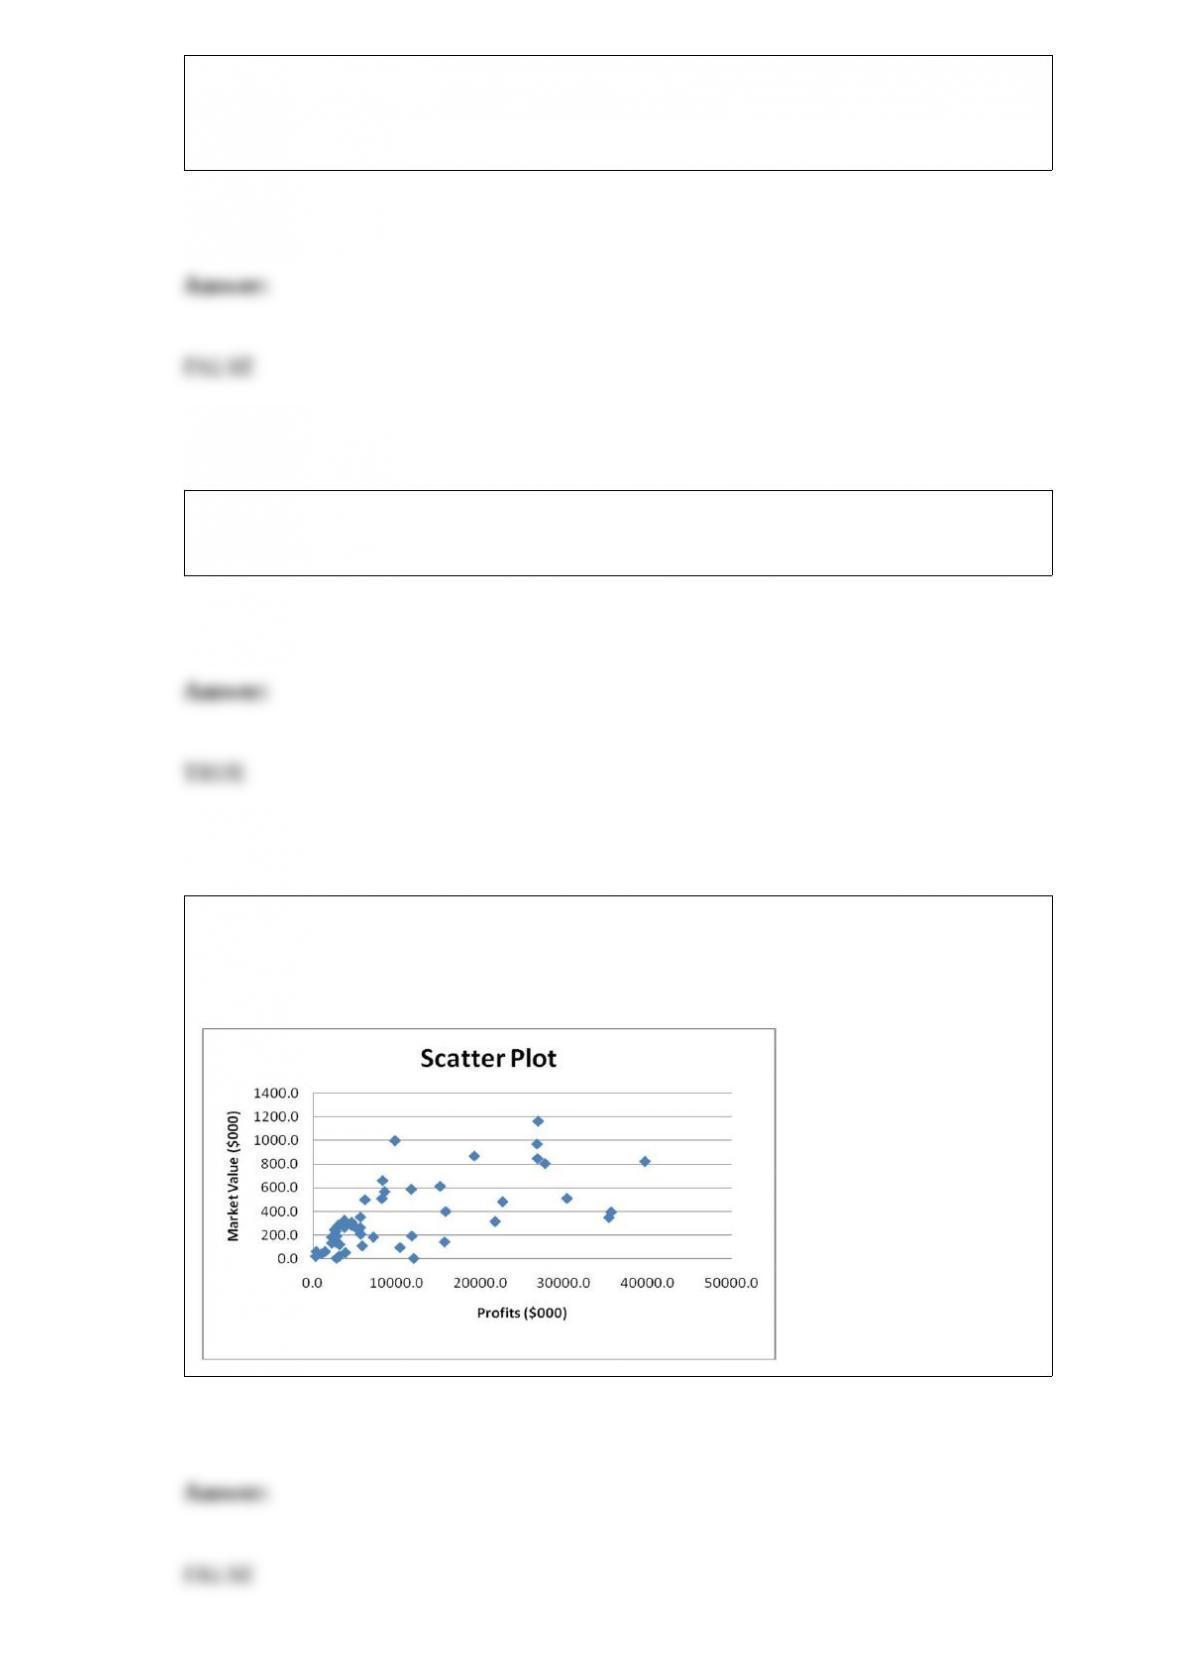
True or False: Given below is the scatter plot of the market value (thousands$) and
profit (thousands$) of 50 U.S. companies. There appears to be a negative relationship
between market value and profit.
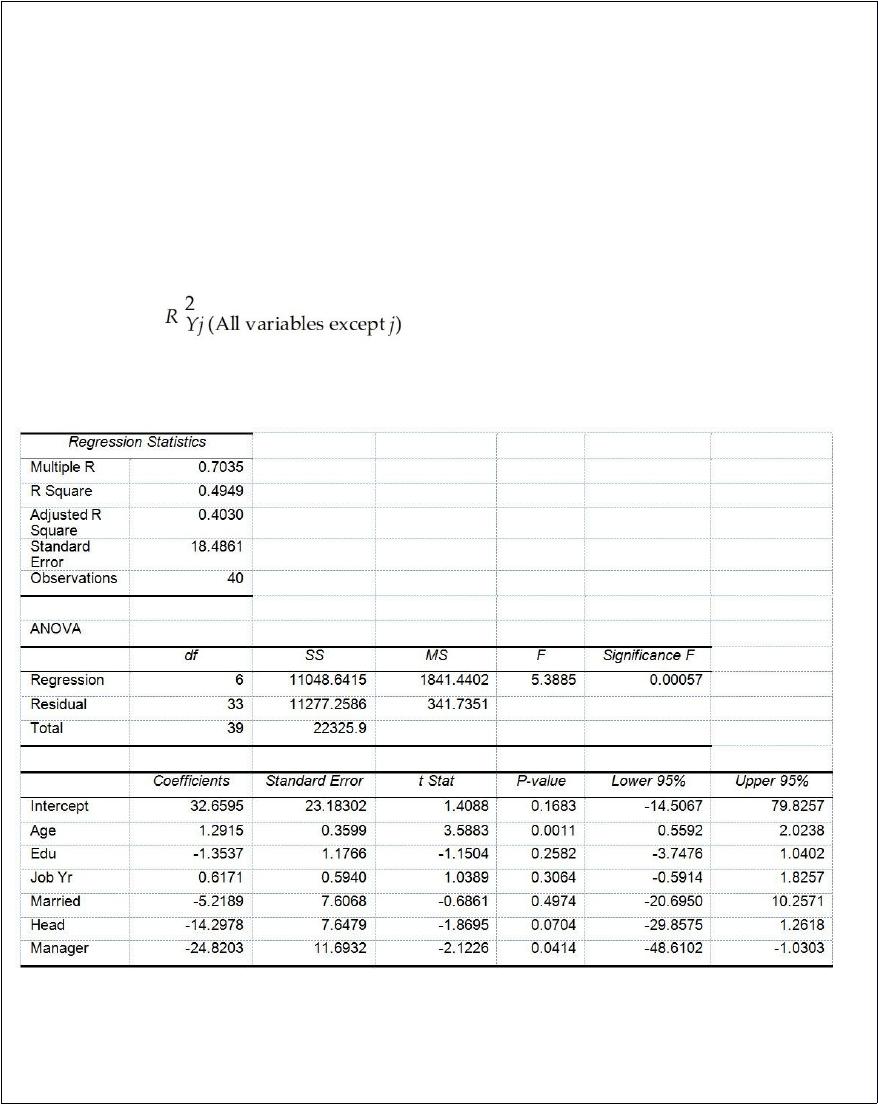
True or False: TABLE 17-10
Given below are results from the regression analysis where the dependent variable is
the number of weeks a worker is unemployed due to a layoff (Unemploy) and the
independent variables are the age of the worker (Age), the number of years of education
received (Edu), the number of years at the previous job (Job Yr), a dummy variable for
marital status (Married: 1 = married, 0 = otherwise), a dummy variable for head of
household (Head: 1 = yes, 0 = no) and a dummy variable for management position
(Manager: 1 = yes, 0 = no). We shall call this Model 1. The coefficient of partial
determination ( ) of each of the 6 predictors are, respectively,
0.2807, 0.0386, 0.0317, 0.0141, 0.0958, and 0.1201.
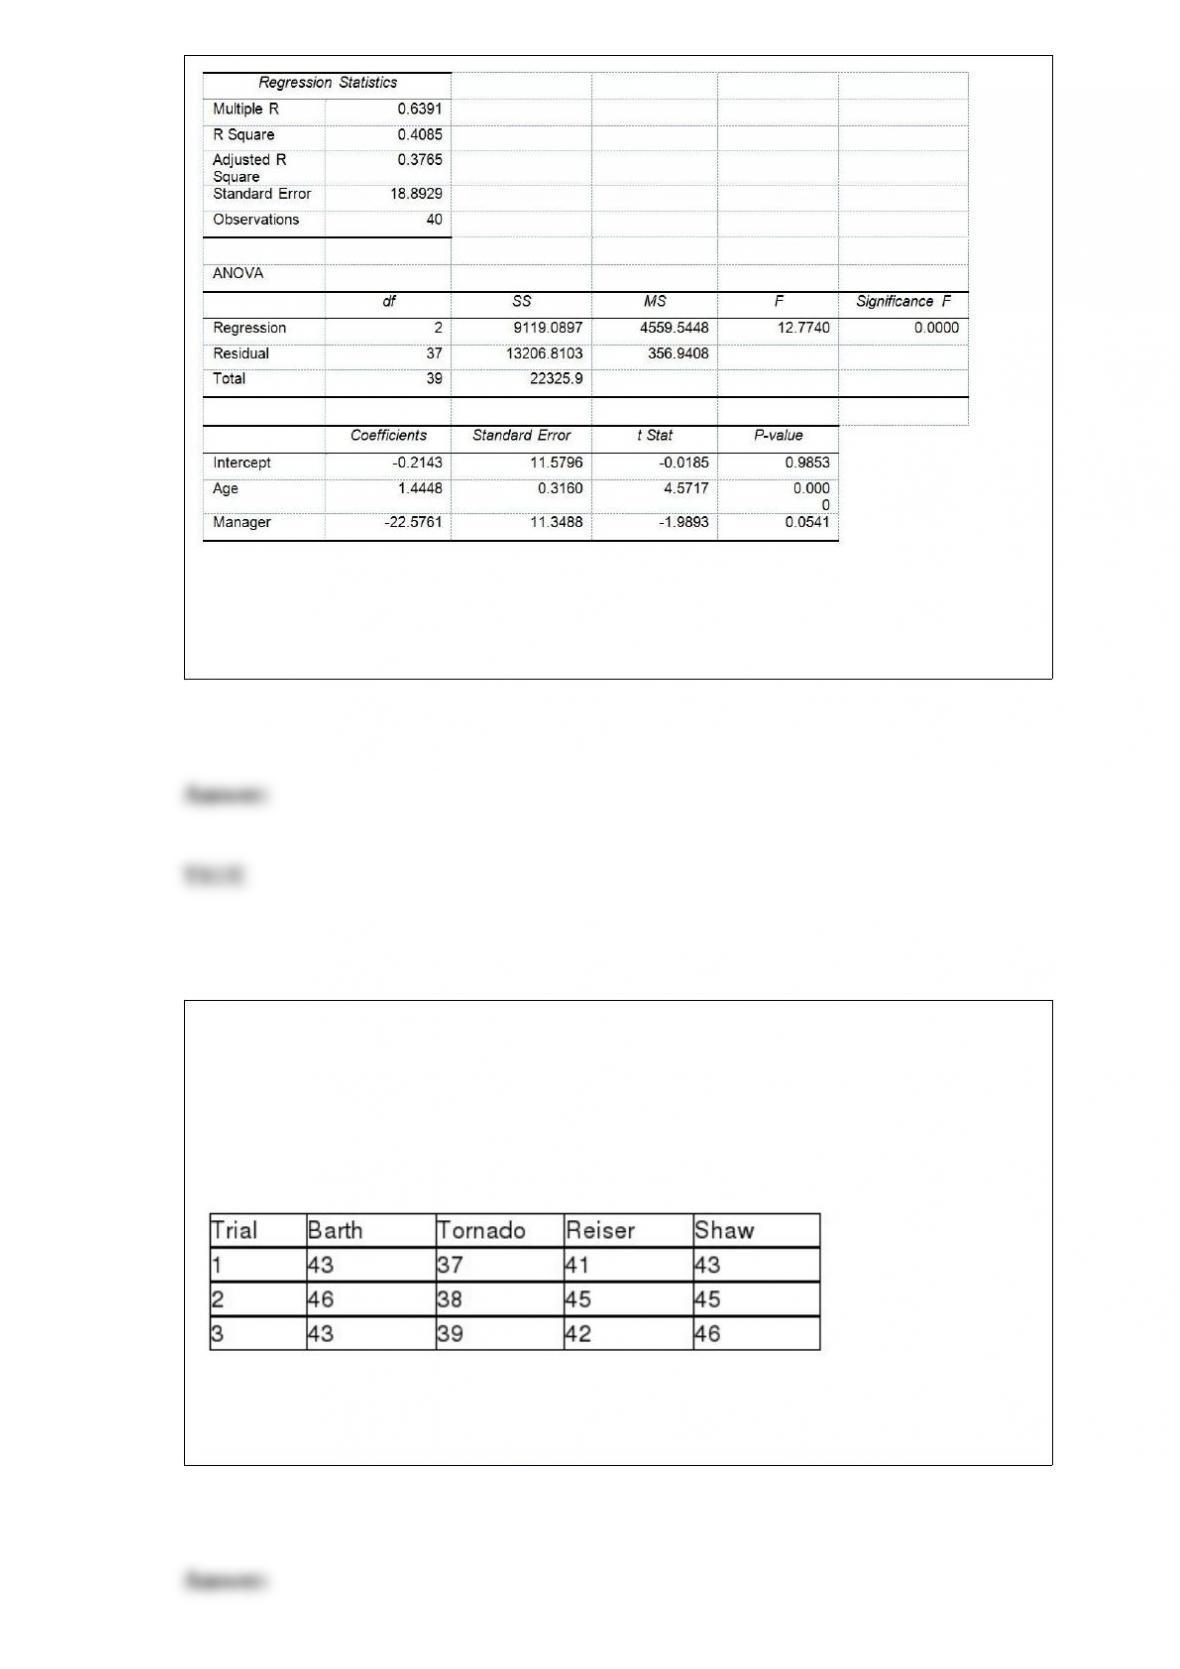
Model 2 is the regression analysis where the dependent variable is Unemploy and the
independent variables are Age and Manager. The results of the regression analysis are
given below:
Referring to Table 17-10, Model 1, there is sufficient evidence that the number of
weeks a worker is unemployed due to a layoff depends on at least one of the
explanatory variables at a 10% level of significance.
TABLE 11-3
As part of an evaluation program, a sporting goods retailer wanted to compare the
downhill coasting speeds of 4 brands of bicycles. She took 3 of each brand and
determined their maximum downhill speeds. The results are presented in miles per hour
in the table below.
True or False: Referring to Table 11-3, the null hypothesis should be rejected at a 5%
level of significance.
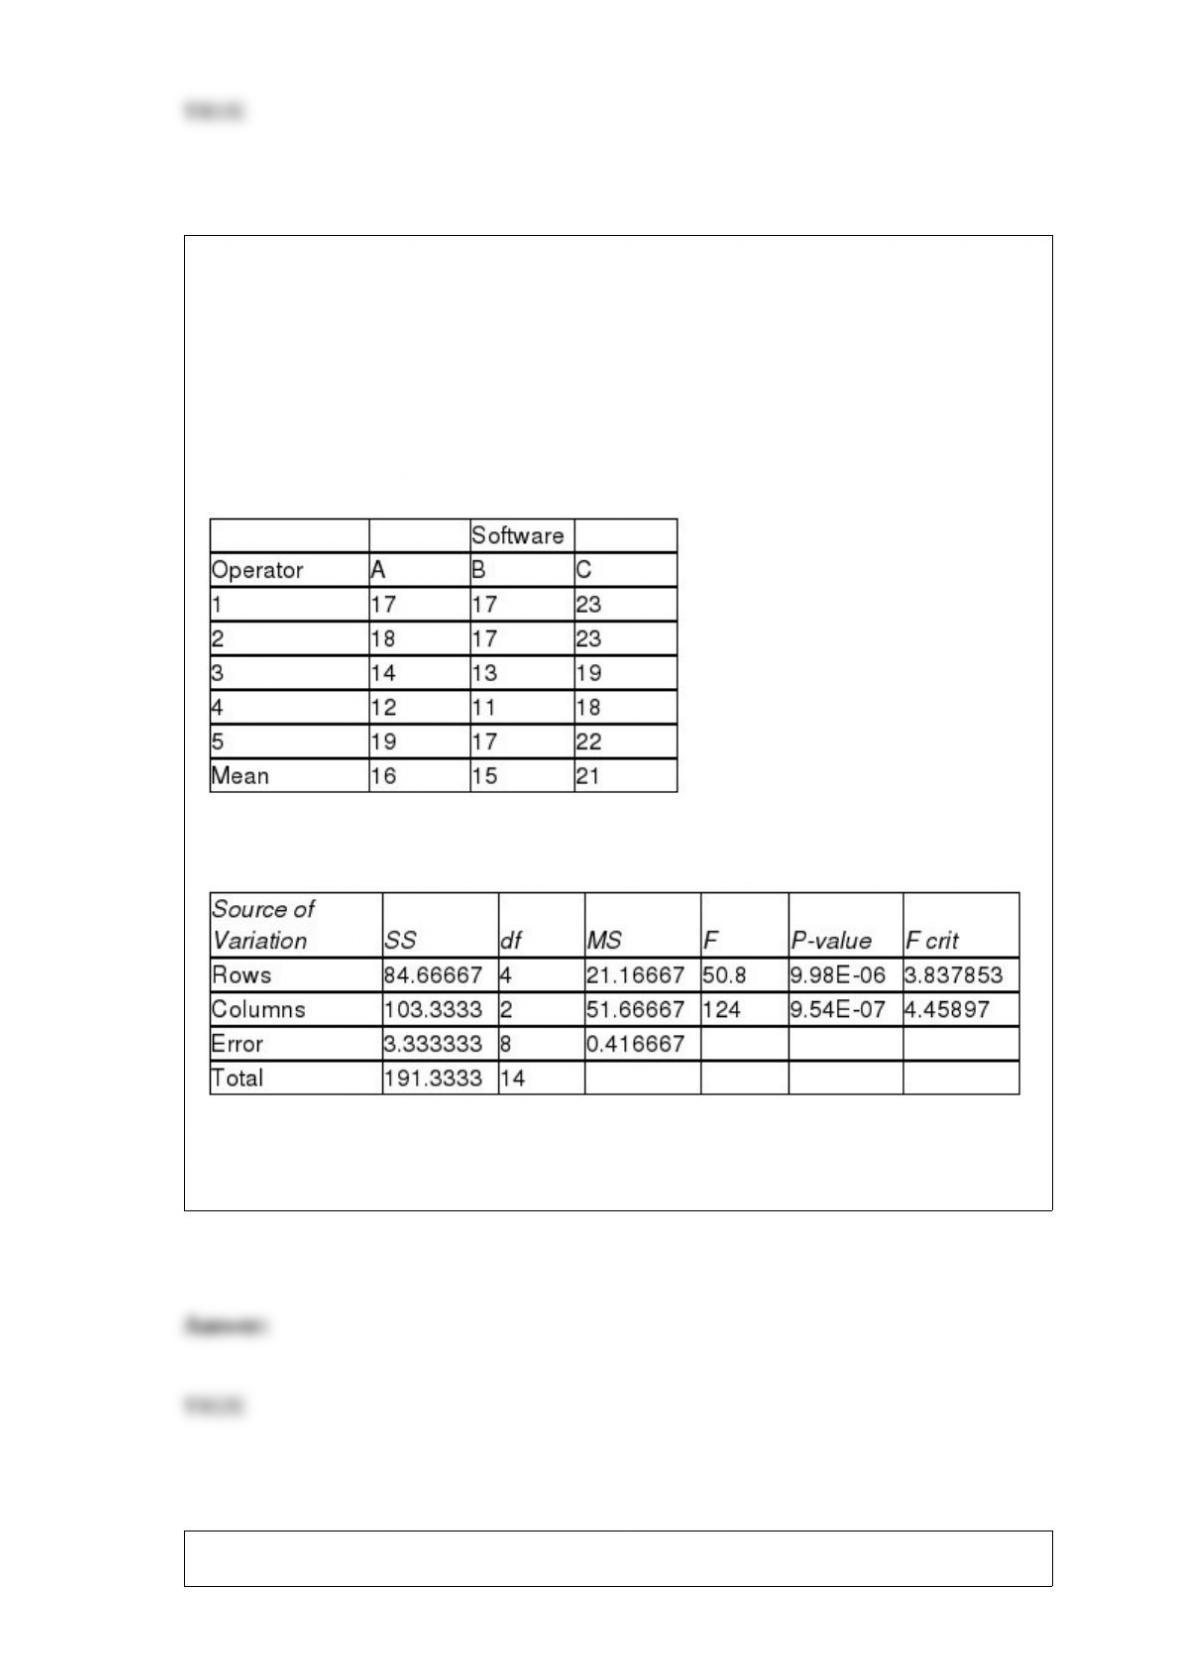
TABLE 11-8
An important factor in selecting database software is the time required for a user to
learn how to use the system. To evaluate three potential brands (A, B and C) of database
software, a company designed a test involving five different employees. To reduce
variability due to differences among employees, each of the five employees is trained
on each of the three different brands. The amount of time (in hours) needed to learn
each of the three different brands is given below:
Below is the Excel output for the randomized block design:
True or False: Referring to Table 11-8, the null hypothesis for the F test for the block
effects should be rejected at a 0.05 level of significance.
In a one-way ANOVA,

A) an interaction term is present.
B) an interaction effect can be tested.
C) there is no interaction term.
D) the interaction term has (c – 1) (n – 1) degrees of freedom.
An agronomist wants to compare the crop yield of 3 varieties of chickpea seeds. She
plants all 3 varieties of the seeds on each of 5 different patches of fields. She then
measures the crop yield in bushels per acre. Which of the following tests will be the
most appropriate to find out if the different patches is advantageous in reducing the
random error?
A) One-way ANOVA F test for differences among more than two means
B) Randomized block F test for differences among more than two means
C) Randomized block F test for block effect
D) Two-way ANOVA F test for the variety effect
TABLE 10-3
A real estate company is interested in testing whether the mean time that families in
Gotham have been living in their current homes is less than families in Metropolis.
Assume that the two population variances are equal. A random sample of 100 families
from Gotham and a random sample of 150 families in Metropolis yield the following
data on length of residence in current homes.
Gotham: G = 35 months, = 900 Metropolis: M = 50 months, = 1050
Referring to Table 10-3, what is(are) the critical value(s) of the relevant hypothesis test
if the level of significance is 0.01?
A) t Z = -1.96
B) t Z = 1.96
C) t Z = -2.080
D) t Z = -2.33
A study is under way in Yosemite National Forest to determine the adult height of
American pine trees. Specifically, the study is attempting to determine what factors aid
a tree in reaching heights greater than 60 feet tall. It is estimated that the forest contains
25,000 adult American pines. The study involves collecting heights from 250 randomly
selected adult American pine trees and analyzing the results. Identify the population
from which the study was sampled.
A) the 250 randomly selected adult American pine trees
B) the 25,000 adult American pine trees in the forest
C) all the adult American pine trees taller than 60 feet
D) all American pine trees, of any age, in the forest
TABLE 10-7
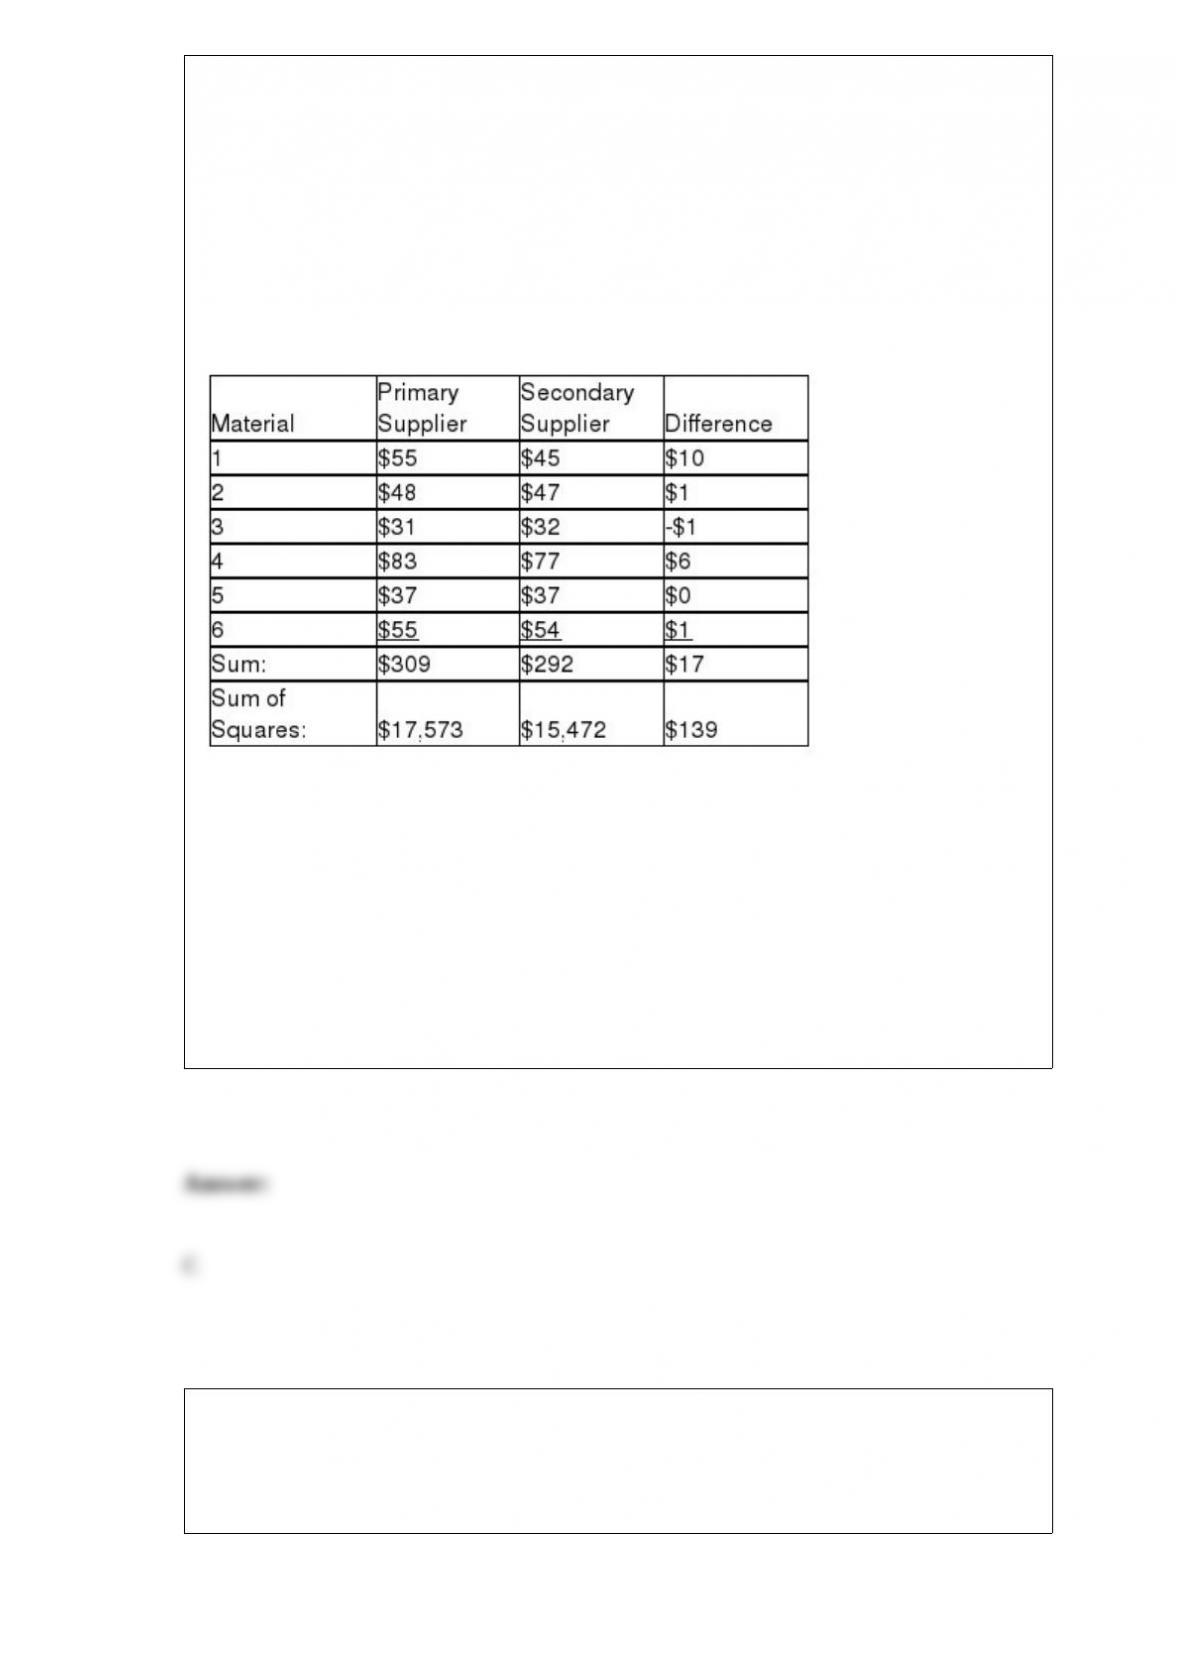
A buyer for a manufacturing plant suspects that his primary supplier of raw materials is
overcharging. In order to determine if his suspicion is correct, he contacts a second
supplier and asks for the prices on various identical materials. He wants to compare
these prices with those of his primary supplier. The data collected is presented in the
table below, with some summary statistics presented (all of these might not be
necessary to answer the questions which follow). The buyer believes that the
differences are normally distributed and will use this sample to perform an appropriate
test at a level of significance of 0.01.
Referring to Table 10-7, the buyer should decide that the primary supplier is
A) overcharging because there is strong evidence that this is the case.
B) overcharging because there is insufficient evidence to prove otherwise.
C) not overcharging because there is insufficient evidence to prove otherwise.
D) not overcharging because there is strong evidence to prove otherwise.
TABLE 10-5
To test the effectiveness of a business school preparation course, 8 students took a
general business test before and after the course. The results are given below.
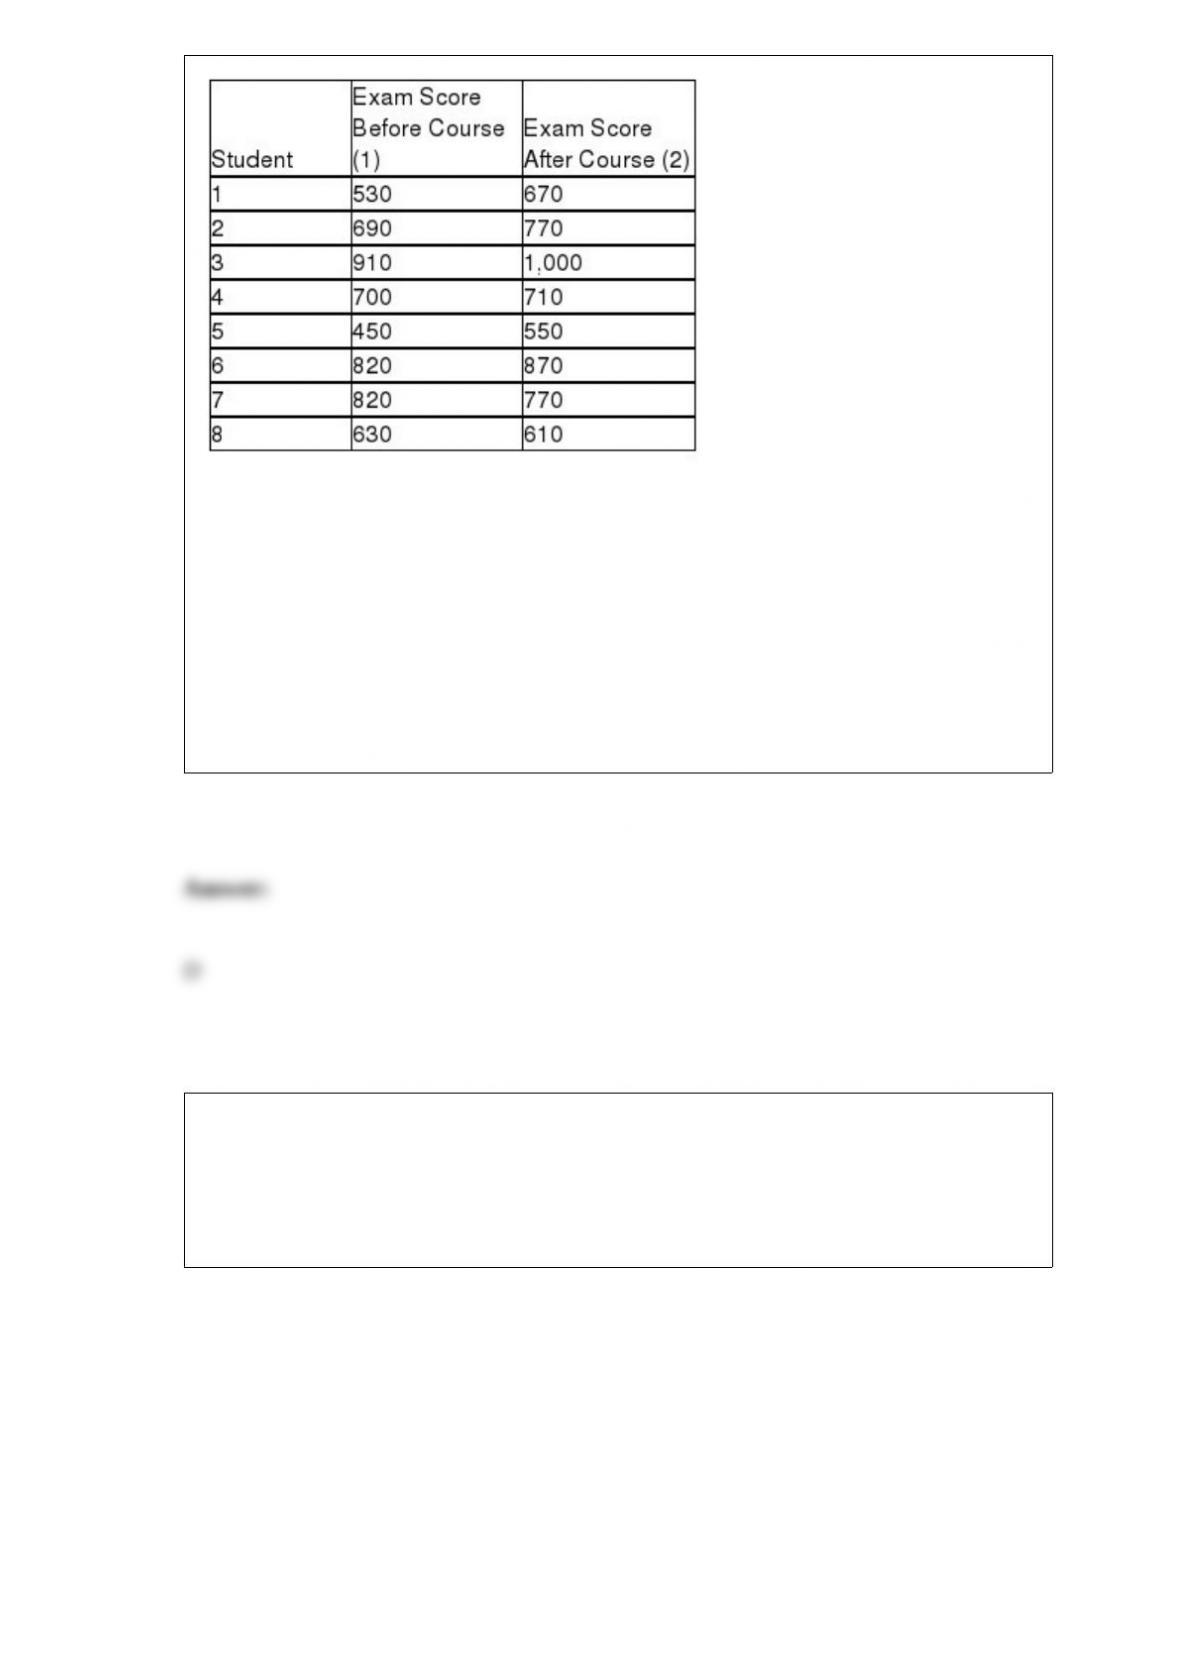
Referring to Table 10-5, the number of degrees of freedom is
A) 14.
B) 13.
C) 8.
D) 7.
TABLE 18-3
A quality control analyst for a light bulb manufacturer is concerned that the time it takes
to produce a batch of light bulbs is too erratic. Accordingly, the analyst randomly
surveys 10 production periods each day for 14 days and records the sample mean and
range for each day.
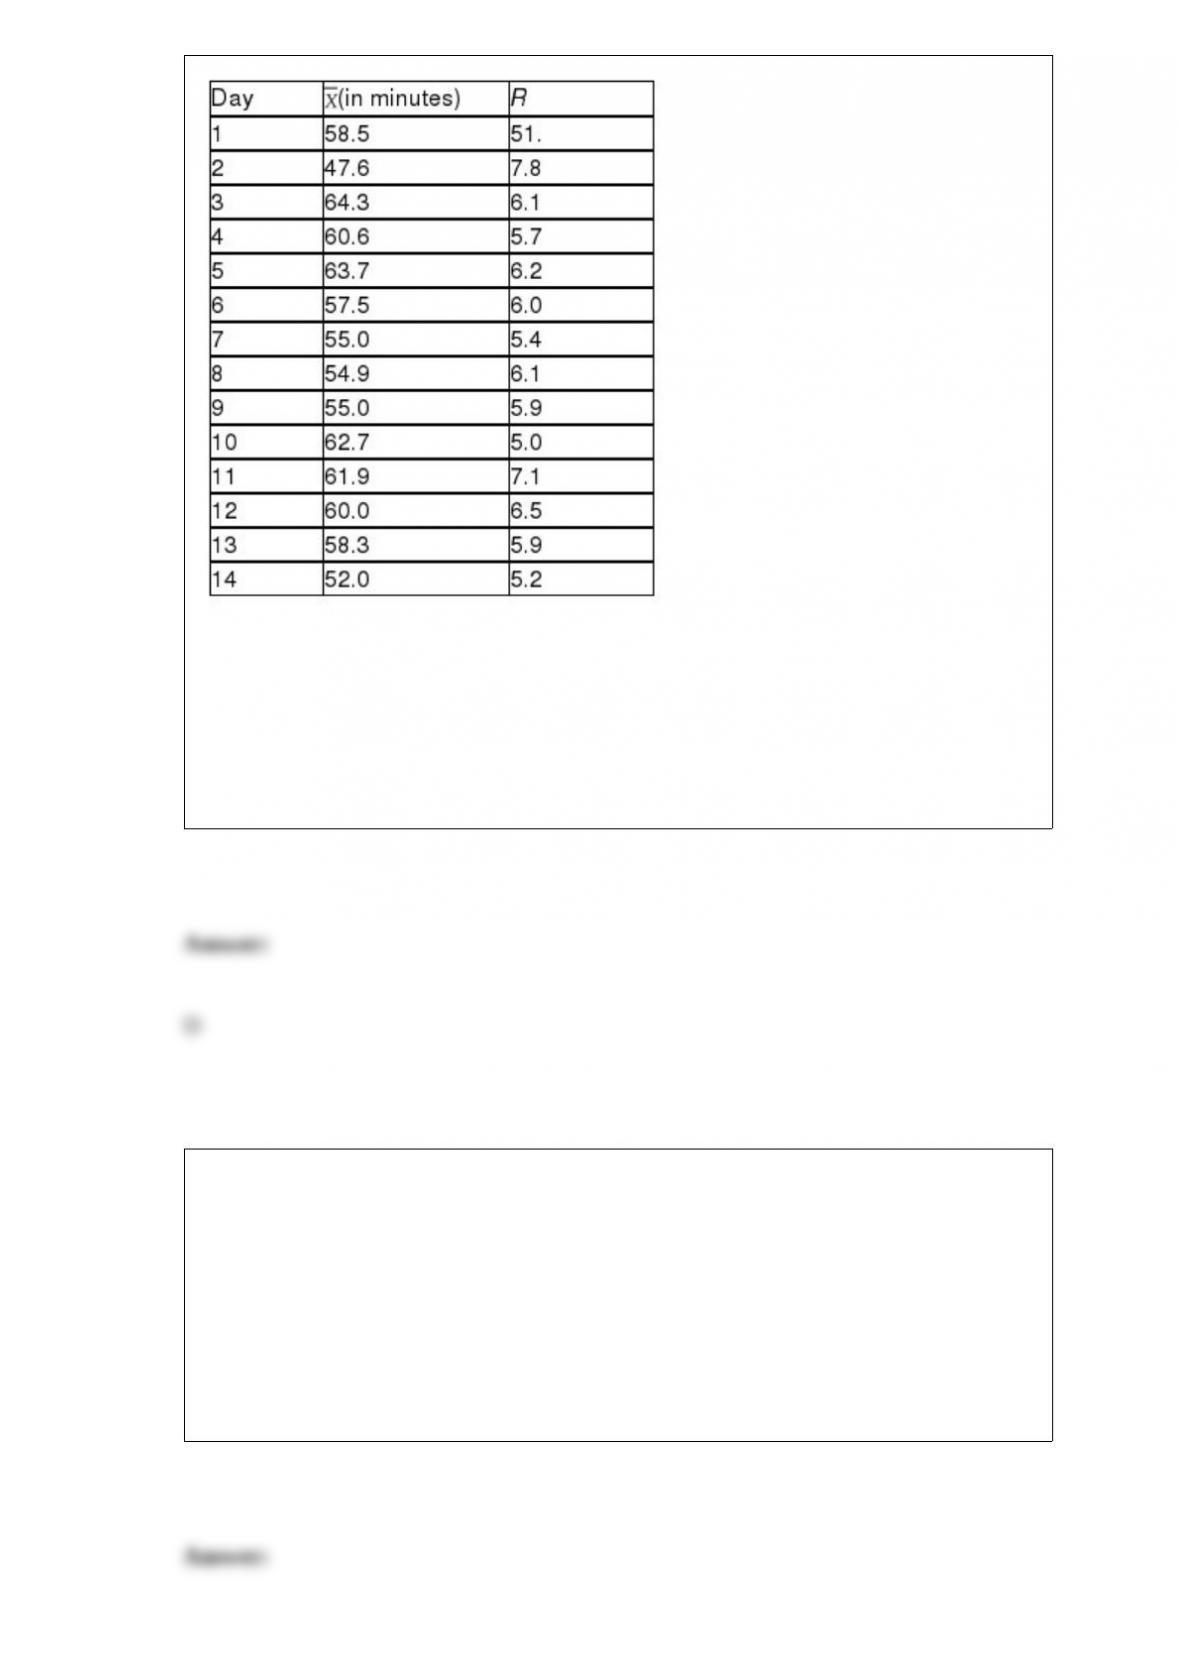
Referring to Table 18-3, suppose the analyst constructs an R chart to see if the
variability in production times is in-control. What is the lower control limit for this R
chart?
A) 4.84
B) 3.37
C) 2.98
D) 1.34
Which of the following is a continuous quantitative (numerical) variable?
A) the color of a student’s eyes
B) the number of employees of an insurance company
C) the amount of milk in a 2-liter carton
D) the number of gallons of milk sold at the local grocery store yesterday
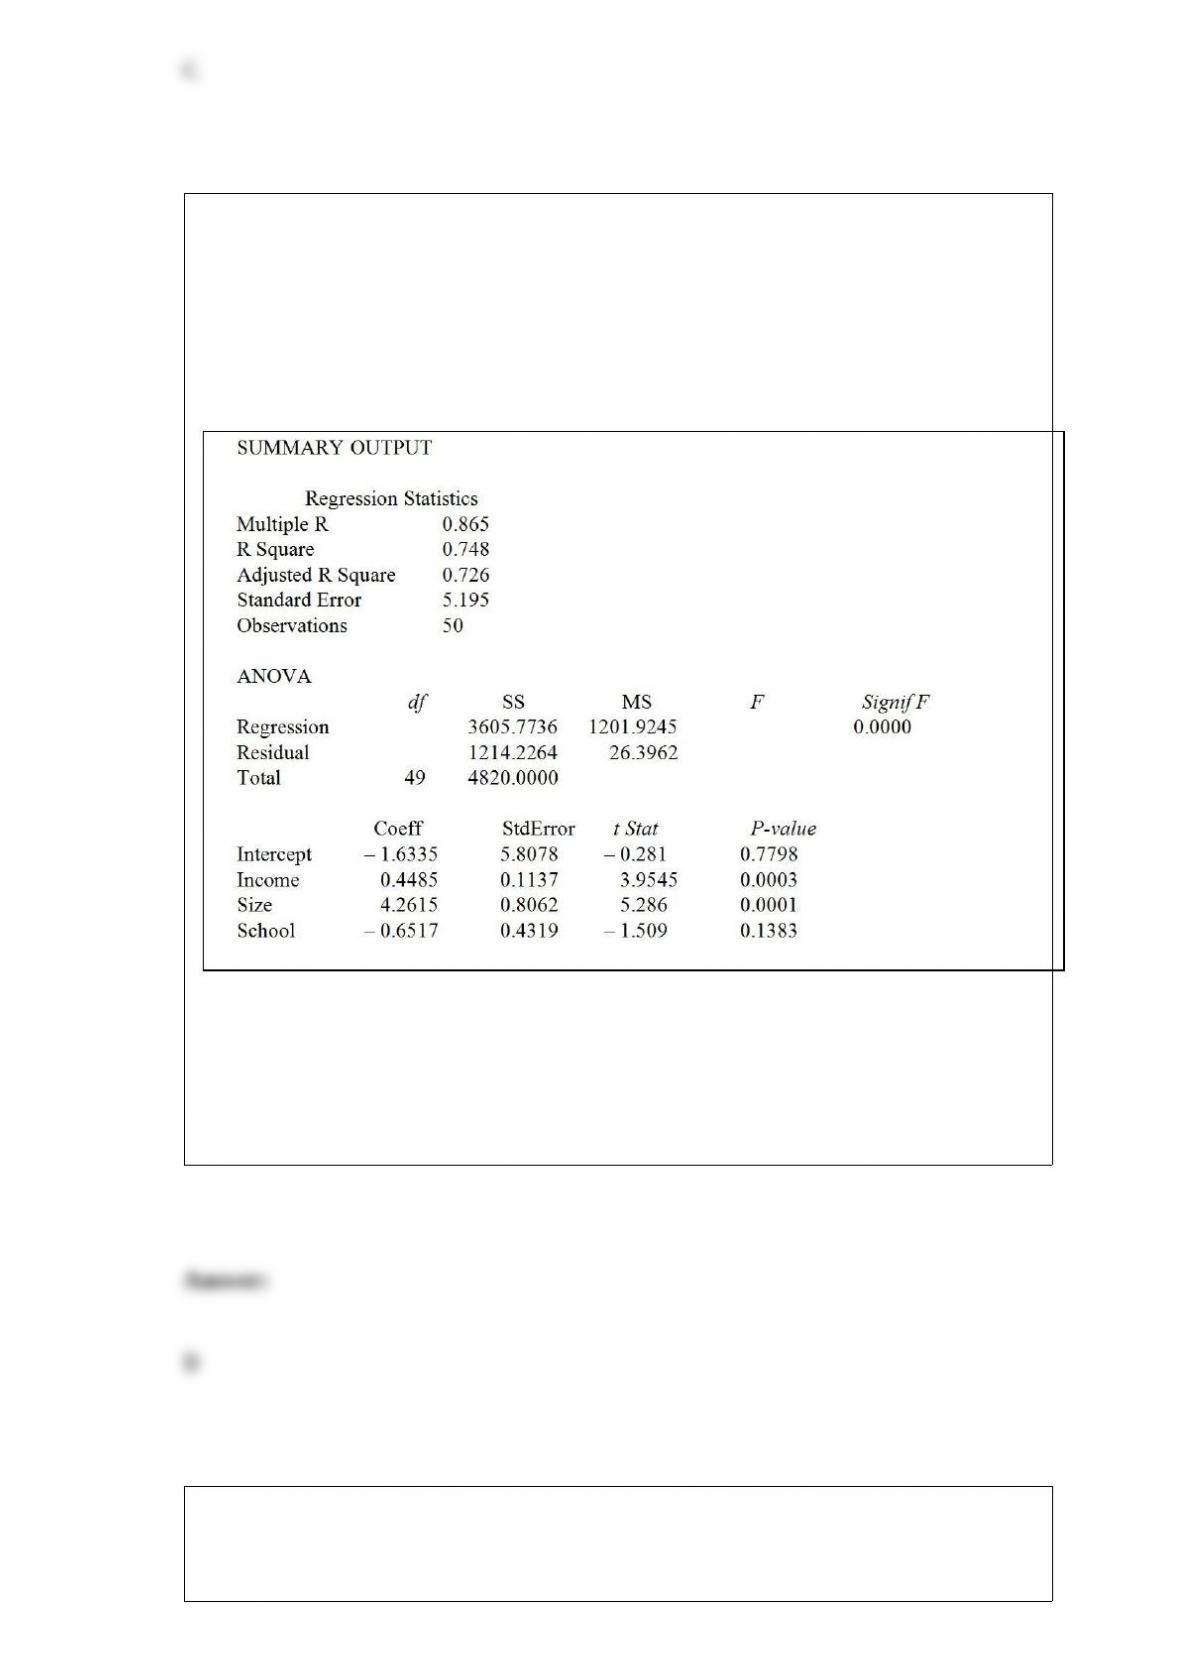
TABLE 17-1
A real estate builder wishes to determine how house size (House) is influenced by
family income (Income), family size (Size), and education of the head of household
(School). House size is measured in hundreds of square feet, income is measured in
thousands of dollars, and education is in years. The builder randomly selected 50
families and ran the multiple regression. Microsoft Excel output is provided below:
Referring to Table 17-1, what are the residual degrees of freedom that are missing from
the output?
A) 3
B) 46
C) 49
D) 50
Referring to Table 14-5, what is the p-value for testing whether Wages have a negative
impact on corporate sales?
TABLE 14-5
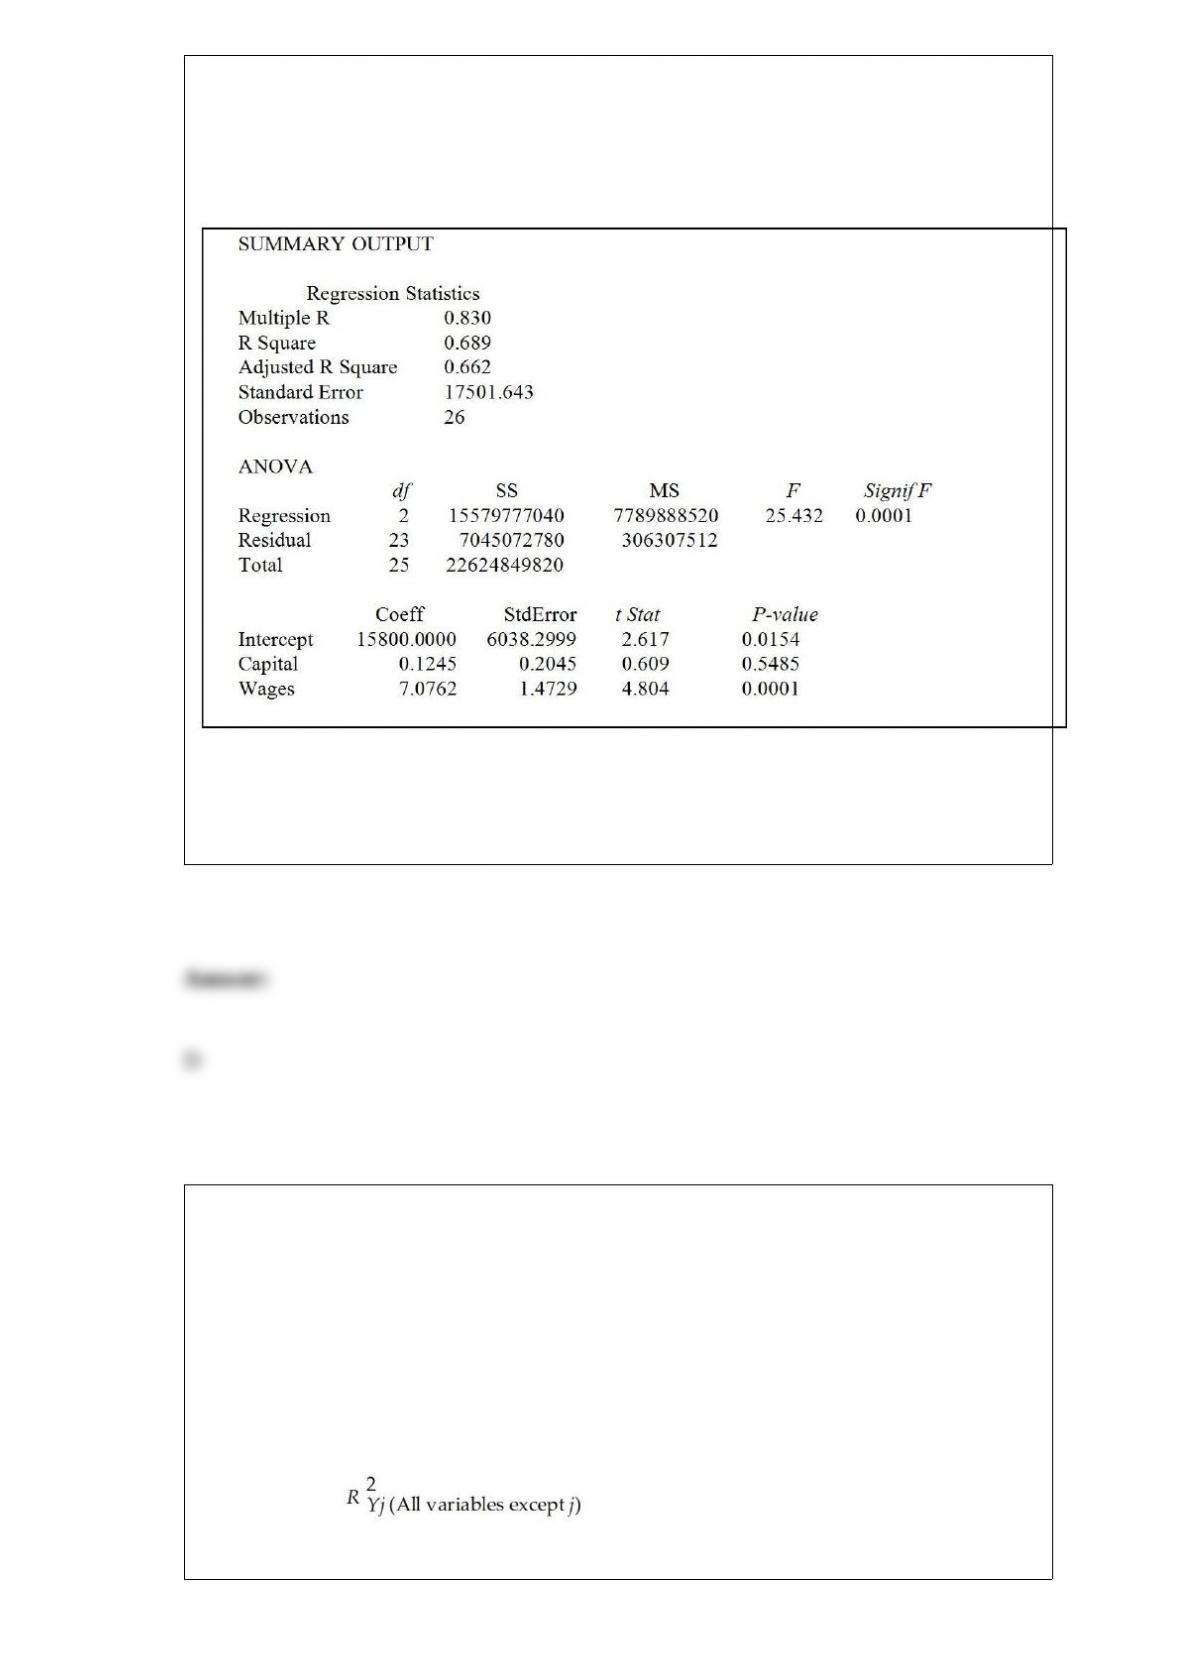
A microeconomist wants to determine how corporate sales are influenced by capital and
wage spending by companies. She proceeds to randomly select 26 large corporations
and record information in millions of dollars. The Microsoft Excel output below shows
results of this multiple regression.
A) 0.05
B) 0.0001
C) 0.00005
D) 0.99995
TABLE 17-10
Given below are results from the regression analysis where the dependent variable is
the number of weeks a worker is unemployed due to a layoff (Unemploy) and the
independent variables are the age of the worker (Age), the number of years of education
received (Edu), the number of years at the previous job (Job Yr), a dummy variable for
marital status (Married: 1 = married, 0 = otherwise), a dummy variable for head of
household (Head: 1 = yes, 0 = no) and a dummy variable for management position
(Manager: 1 = yes, 0 = no). We shall call this Model 1. The coefficient of partial
determination ( ) of each of the 6 predictors are, respectively,
0.2807, 0.0386, 0.0317, 0.0141, 0.0958, and 0.1201.
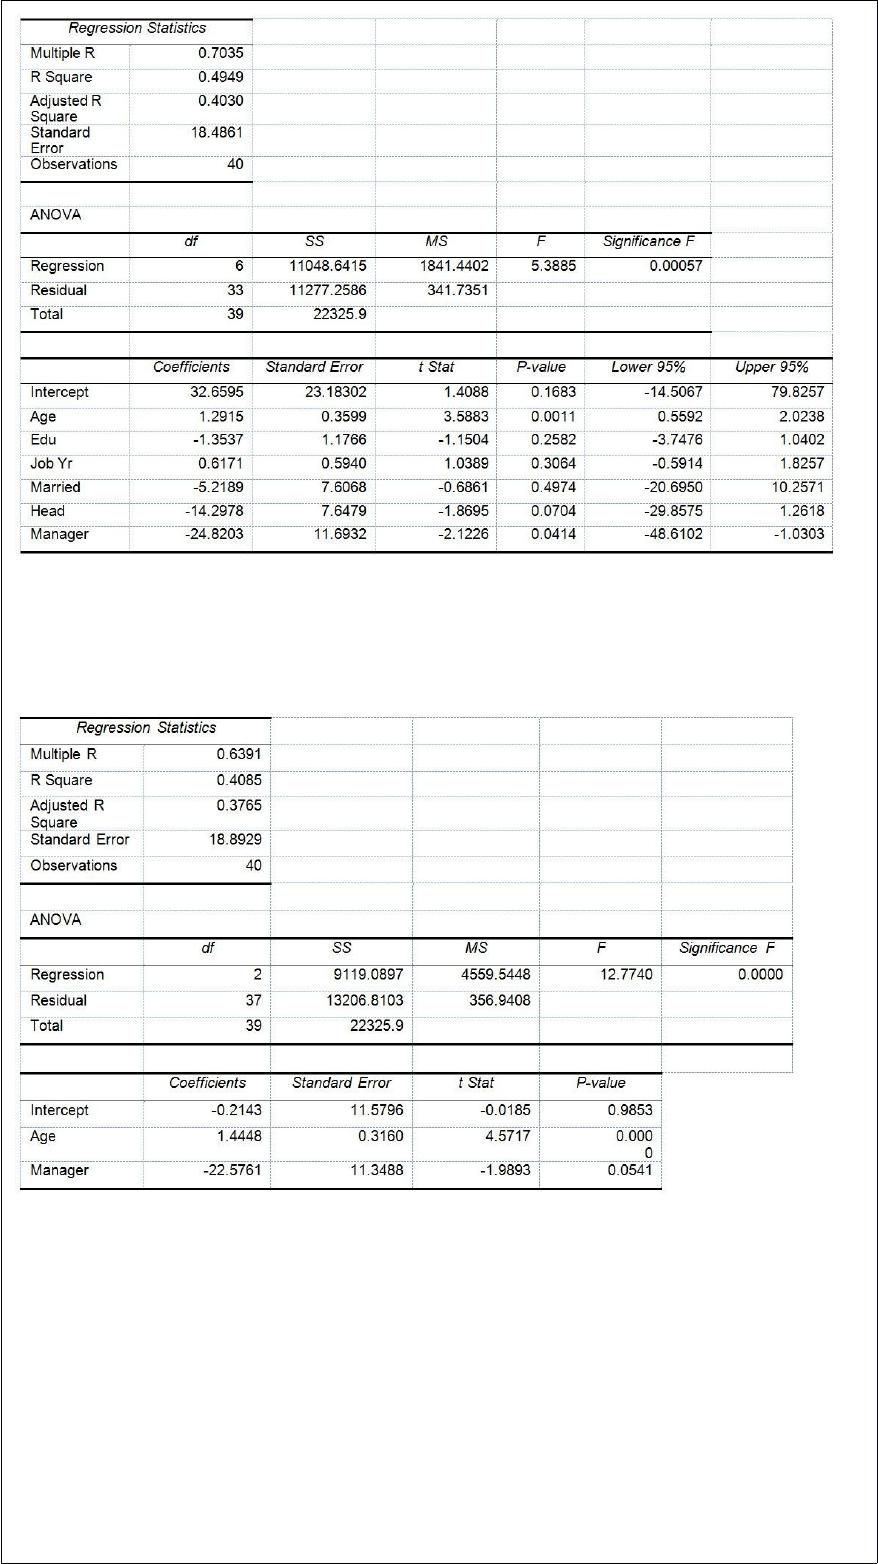
Model 2 is the regression analysis where the dependent variable is Unemploy and the
independent variables are Age and Manager. The results of the regression analysis are
given below:
Referring to Table 17-10, Model 1, which of the following is the correct alternative
hypothesis to test whether being married or not makes a difference in the mean number
of weeks a worker is unemployed due to a layoff while holding constant the effect of all
the other independent variables?
A) H1 : β1 ≠0
B) H1 : β2 ≠0
C) H1 : β3 ≠0
D) H1 : β4 ≠0
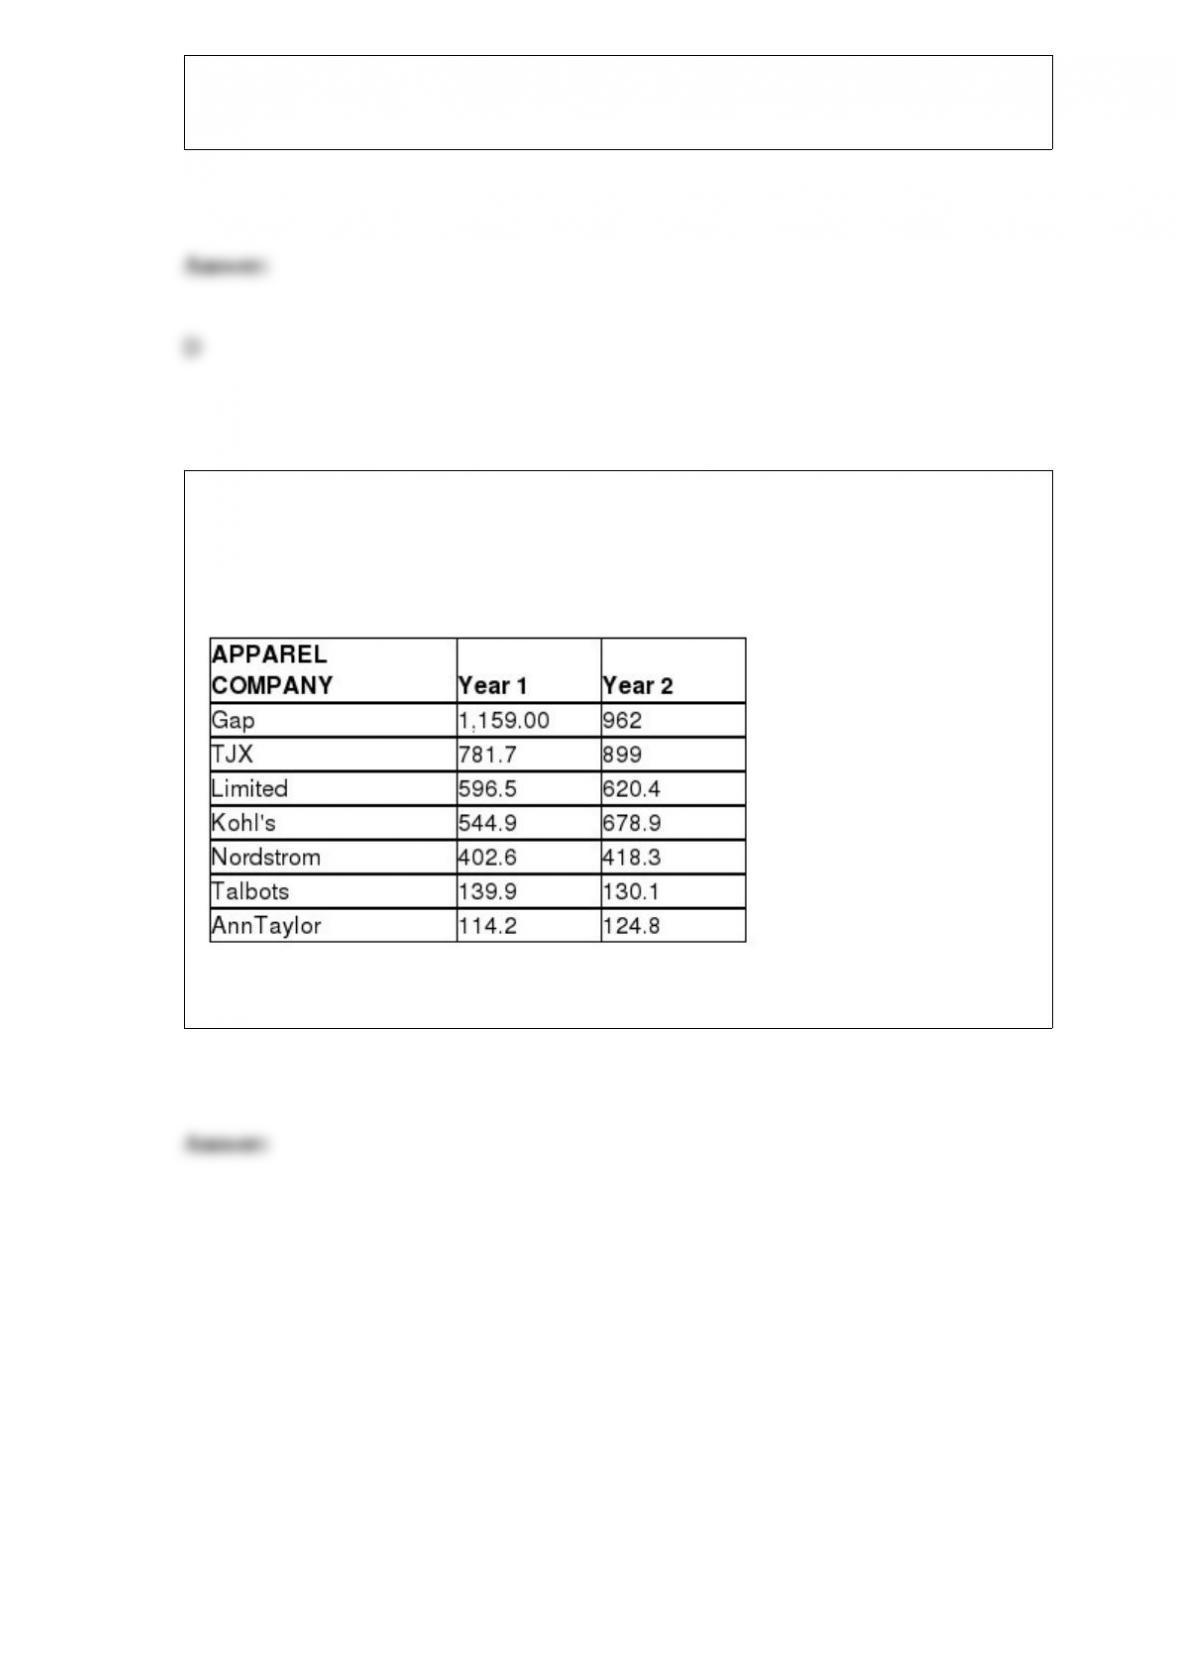
TABLE 2-17
The following table presents total retail sales in millions of dollars for the leading
apparel companies over a two-year period.
Referring to Table 2-17, construct a table of column percentages.
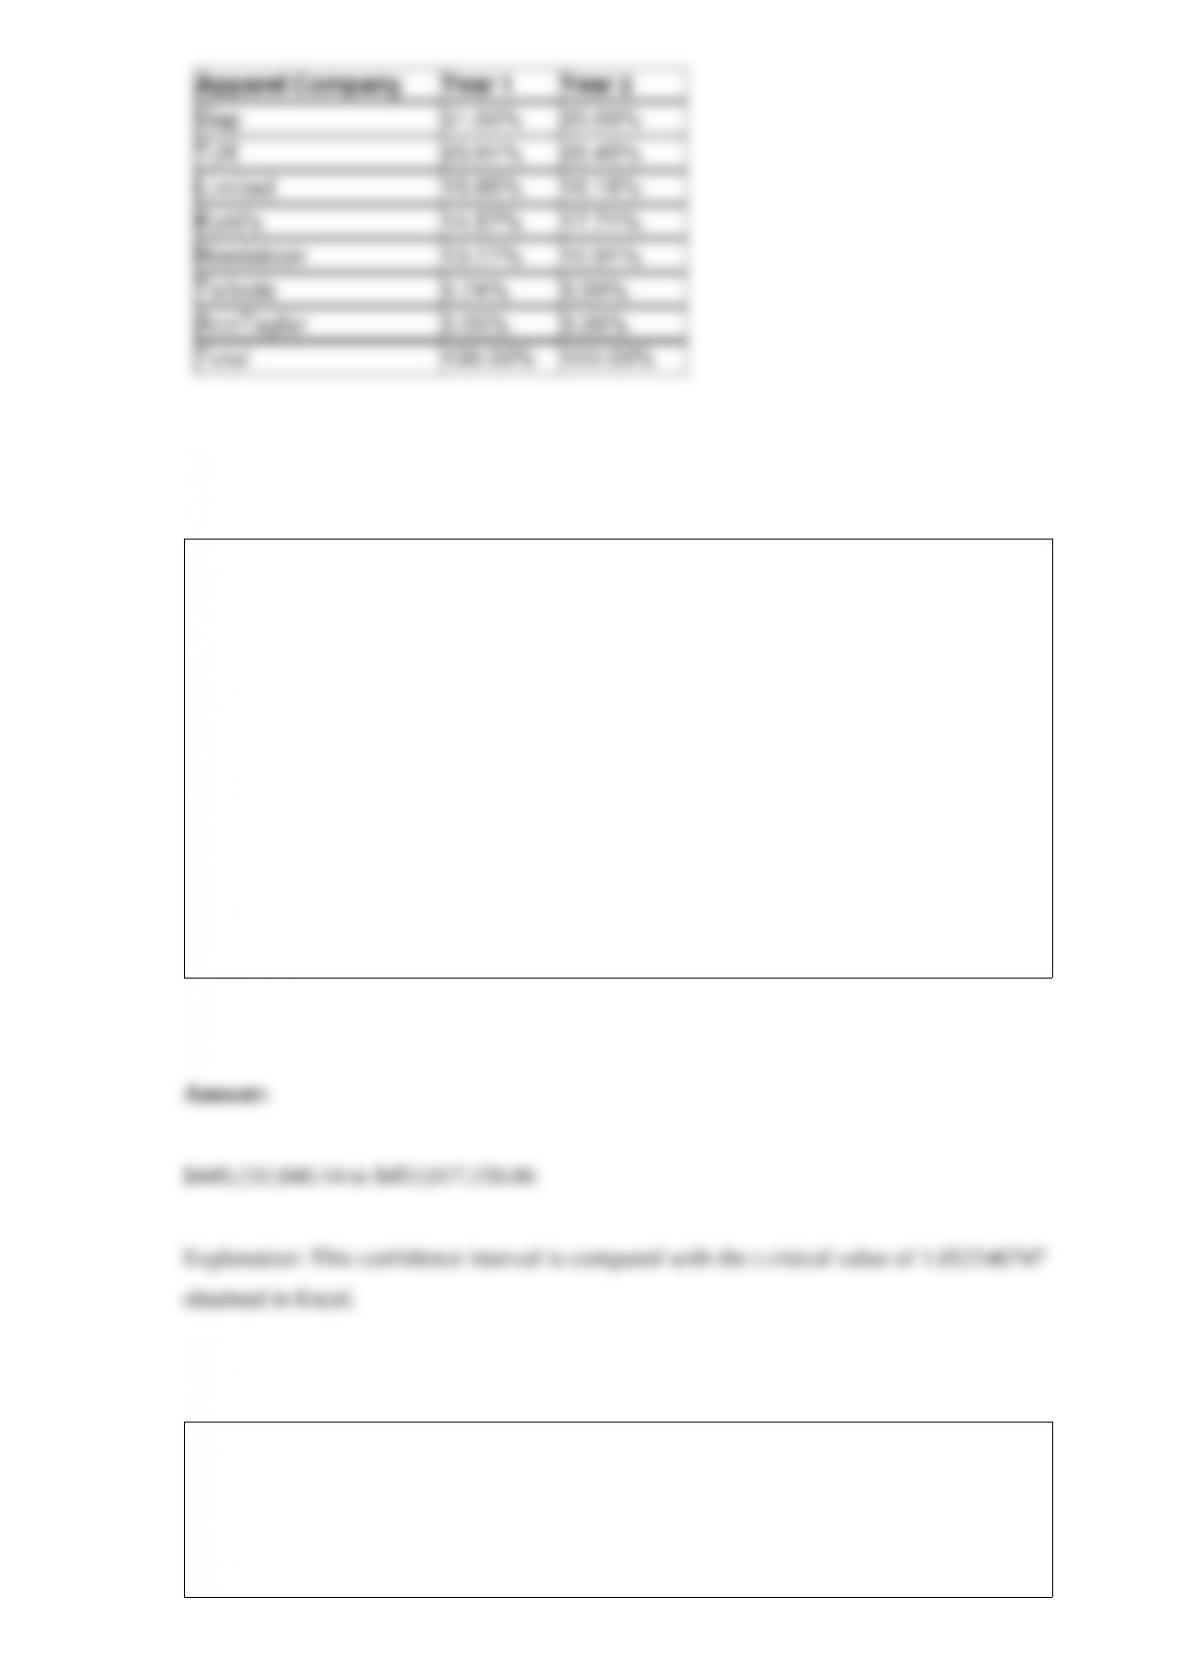
TABLE 8-18
A wealthy real estate investor wants to decide whether it is a good investment to build a
high-end shopping complex in a suburban county in Chicago. His main concern is the
total market value of the 3,605 houses in the suburban county. He commissioned a
statistical consulting group to take a sample of 200 houses and obtained a sample mean
market price of $225,000 and a sample standard deviation of $38,700. The consulting
group also found out that the mean differences between market prices and appraised
prices was $125,000 with a standard deviation of $3,400. Also the proportion of houses
in the sample that are appraised for higher than the market prices is 0.24.
Referring to Table 8-18, what will be the 90% confidence interval for the total
difference between the market prices and appraised prices of the houses in the suburban
county constructed by the consulting group?
Referring to Table 14-8, the p-value of the F test for the significance of
the entire regression is ________.TABLE 14-8
A financial analyst wanted to examine the relationship between salary
(in $1,000) and 2 variables: age

(X1 = Age) and experience in the field (X2 = Exper). He took a sample
of 20 employees and obtained the following Microsoft Excel output:
Also, the sum of squares due to the regression for the model that
includes only Age is 5022.0654 while the sum of squares due to the
regression for the model that includes only Exper is 125.9848.
The manager of a company believed that her company’s profits were following an
exponential trend. She used Microsoft Excel to obtain a prediction equation for the
logarithm (base 10) of profits:
log10(Profits) = 2 + 0.3X
The data she used were from 2007 through 2012 coded 0 to 5. The forecast for 2013
profits is ________.

The interval between patients arriving at an outpatient clinic follows an exponential
distribution with a mean of 15 minutes. What is the probability that a randomly chosen
arrival interval will be less than 15 minutes?