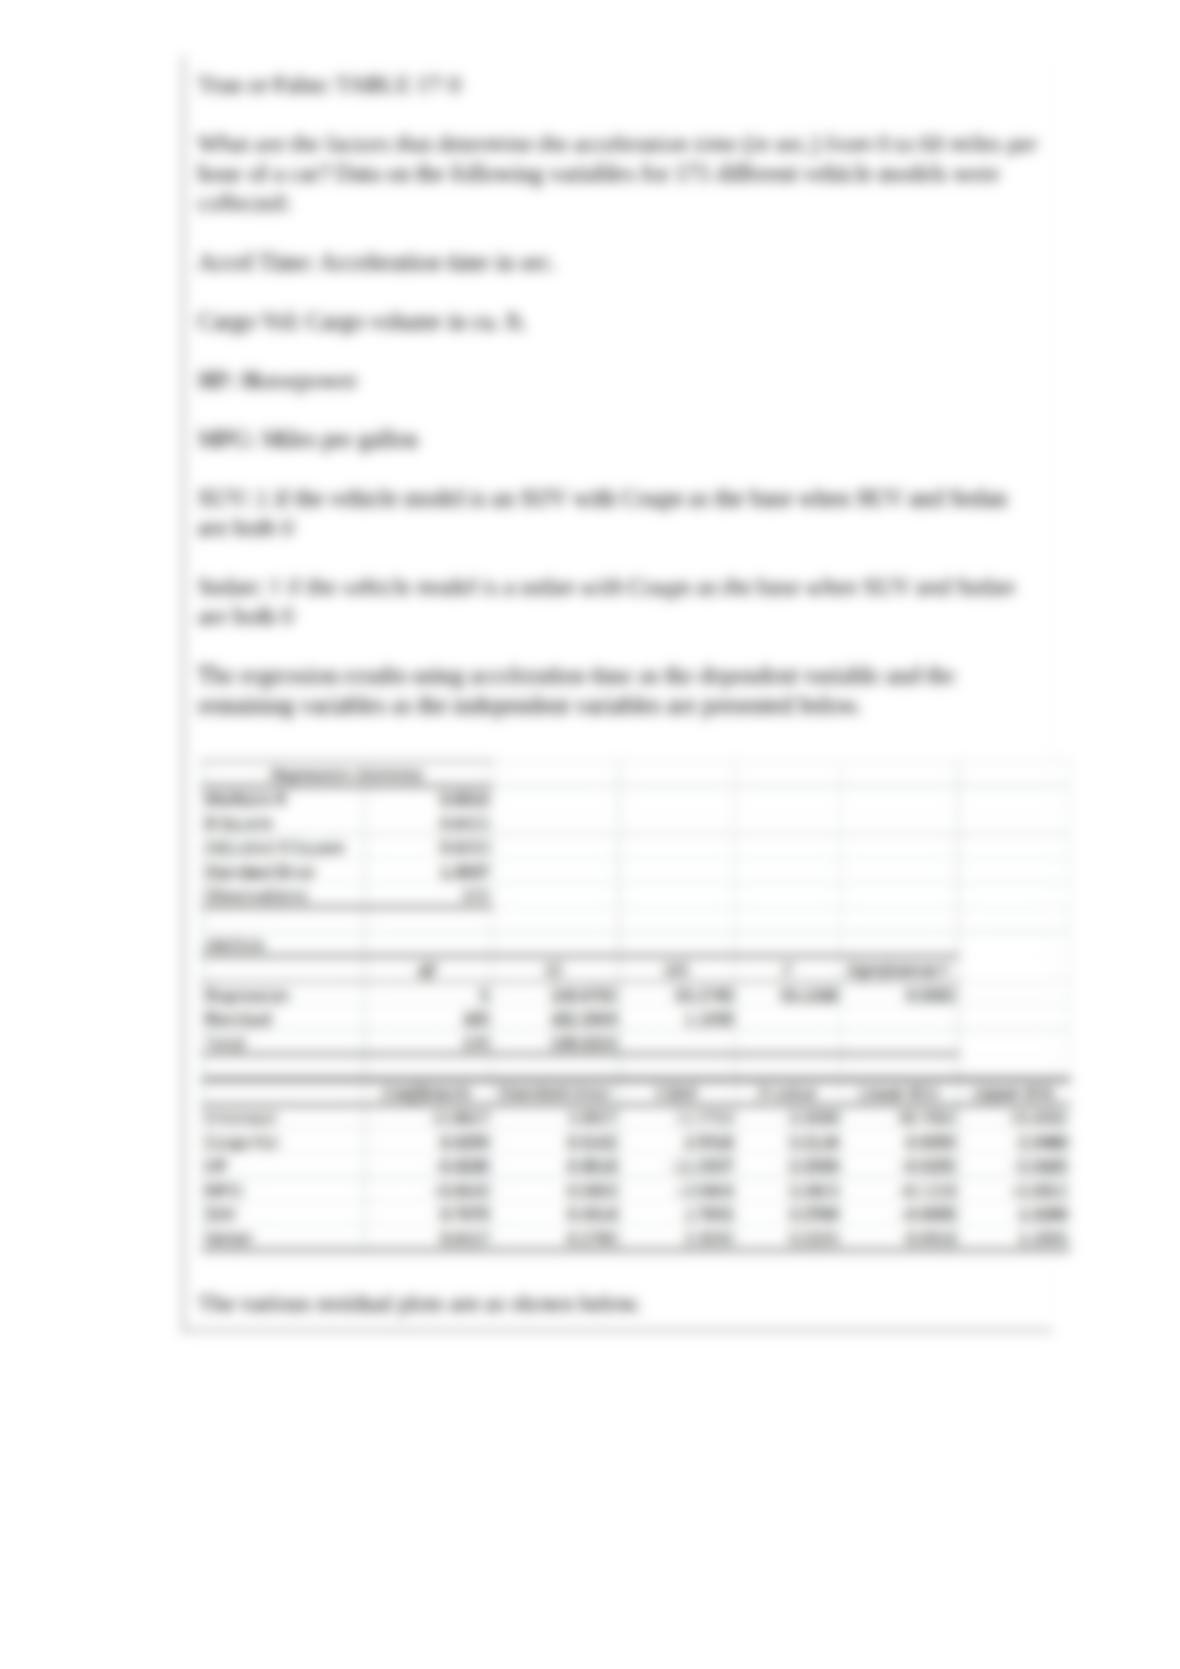
True or False: TABLE 17-9
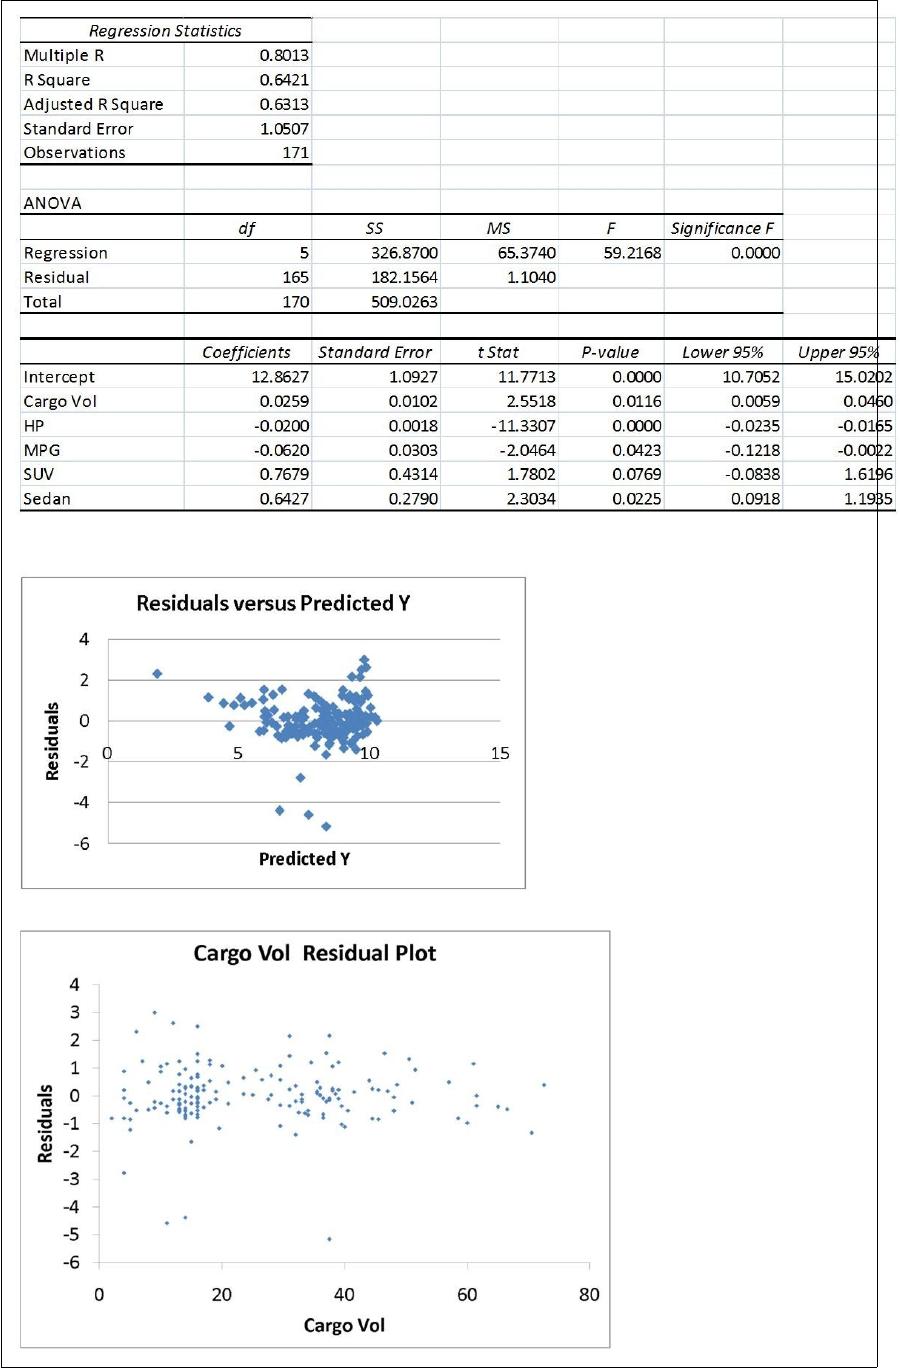
What are the factors that determine the acceleration time (in sec.) from 0 to 60 miles per
hour of a car? Data on the following variables for 171 different vehicle models were
collected:
Accel Time: Acceleration time in sec.
Cargo Vol: Cargo volume in cu. ft.
HP: Horsepower
MPG: Miles per gallon
SUV: 1 if the vehicle model is an SUV with Coupe as the base when SUV and Sedan
are both 0
Sedan: 1 if the vehicle model is a sedan with Coupe as the base when SUV and Sedan
are both 0
The regression results using acceleration time as the dependent variable and the
remaining variables as the independent variables are presented below.
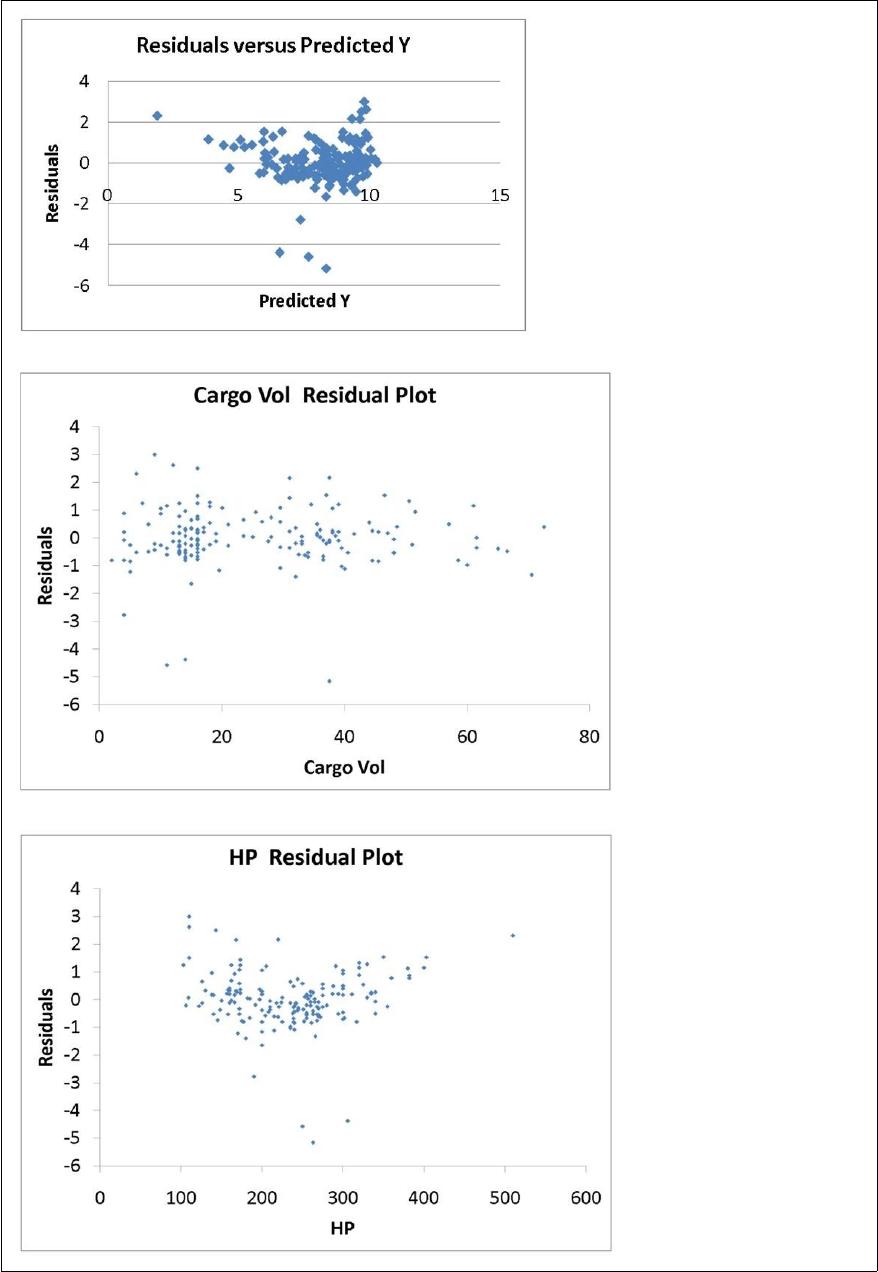
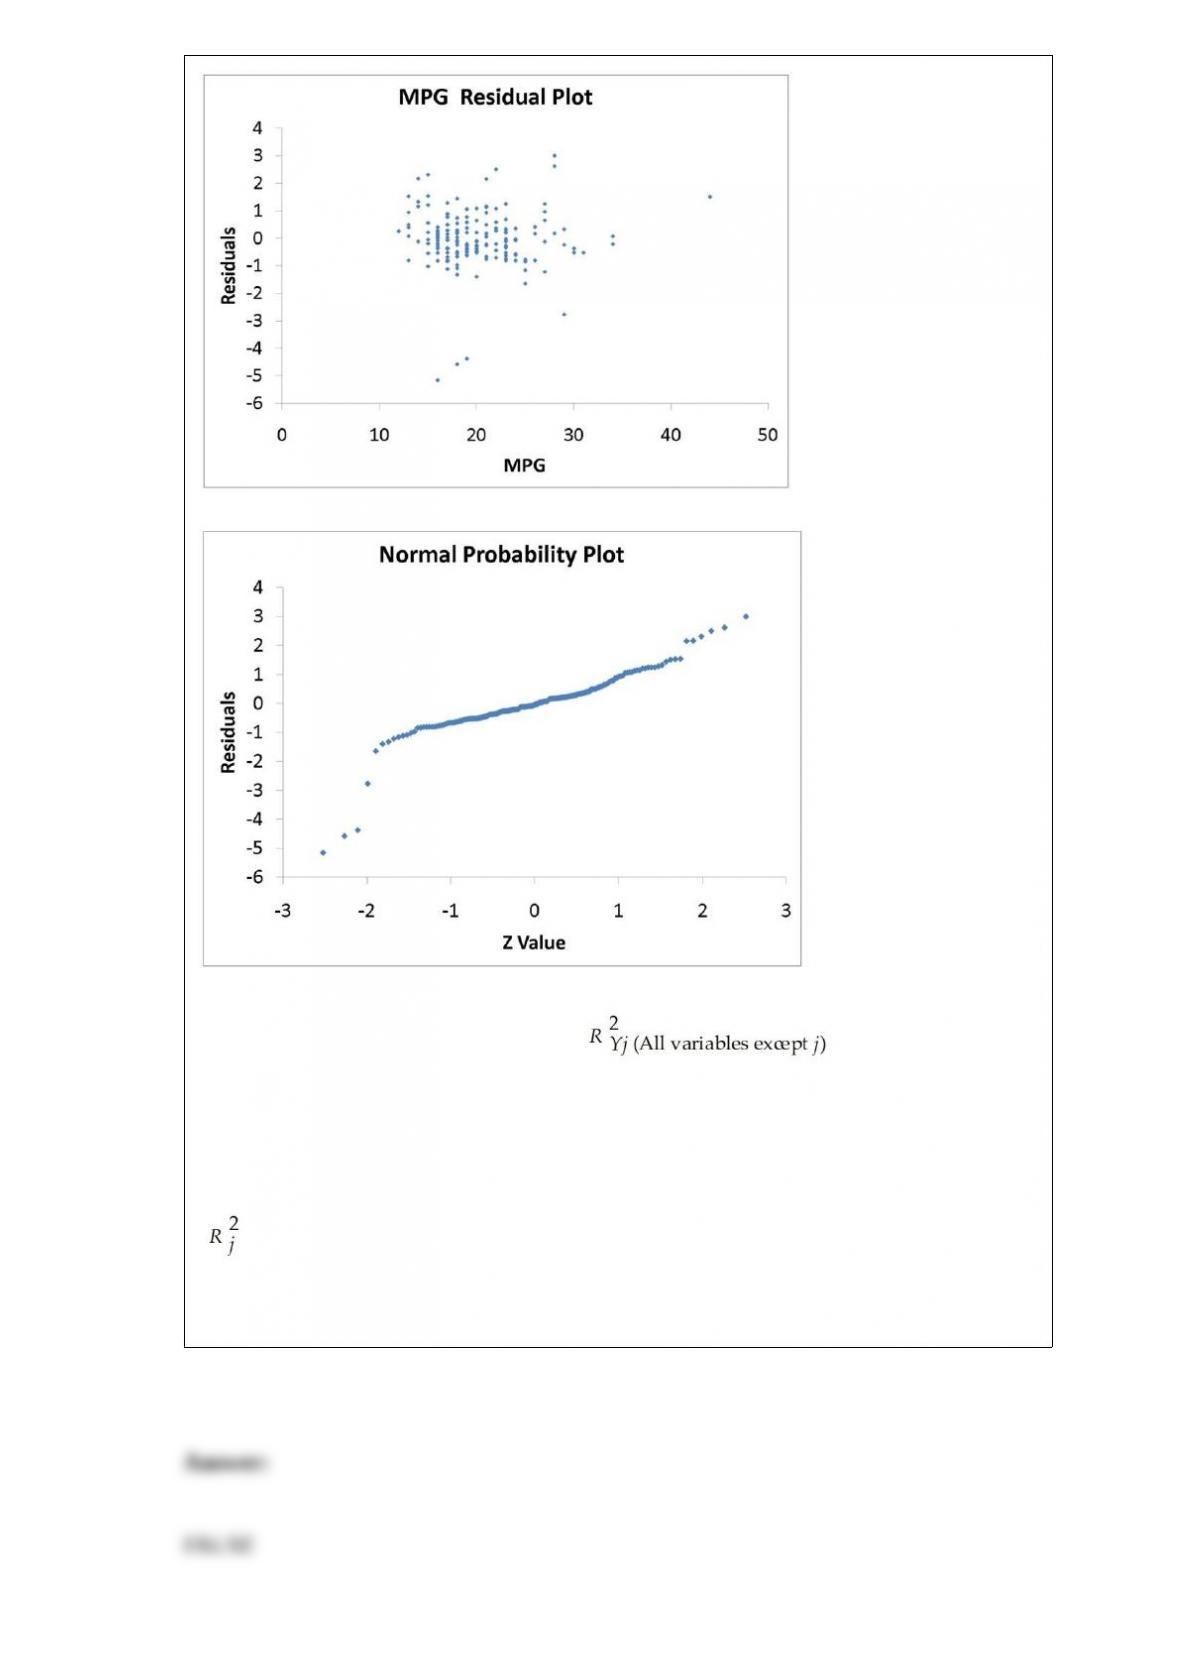
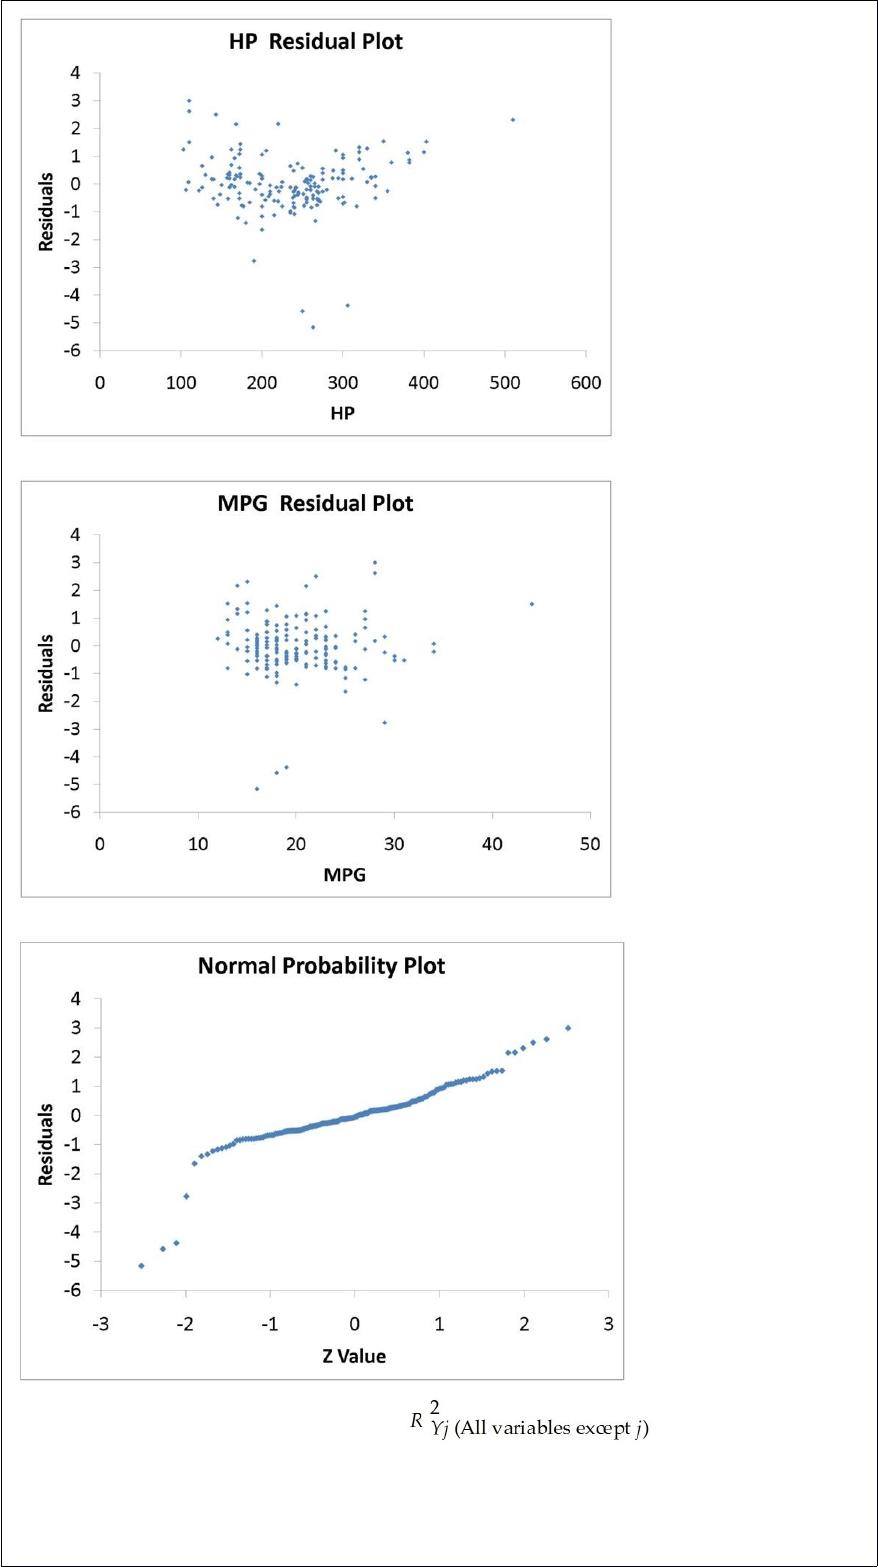
The various residual plots are as shown below.
The coefficient of partial determination ( ) of each of the 5
predictors are, respectively, 0.0380, 0.4376, 0.0248, 0.0188, and 0.0312.
The coefficient of multiple determination for the regression model using each of the 5
variables Xj as the dependent variable and all other X variables as independent variables
( ) are, respectively, 0.7461, 0.5676, 0.6764, 0.8582, 0.6632.
Referring to Table 17-9, the errors (residuals) appear to be right-skewed.
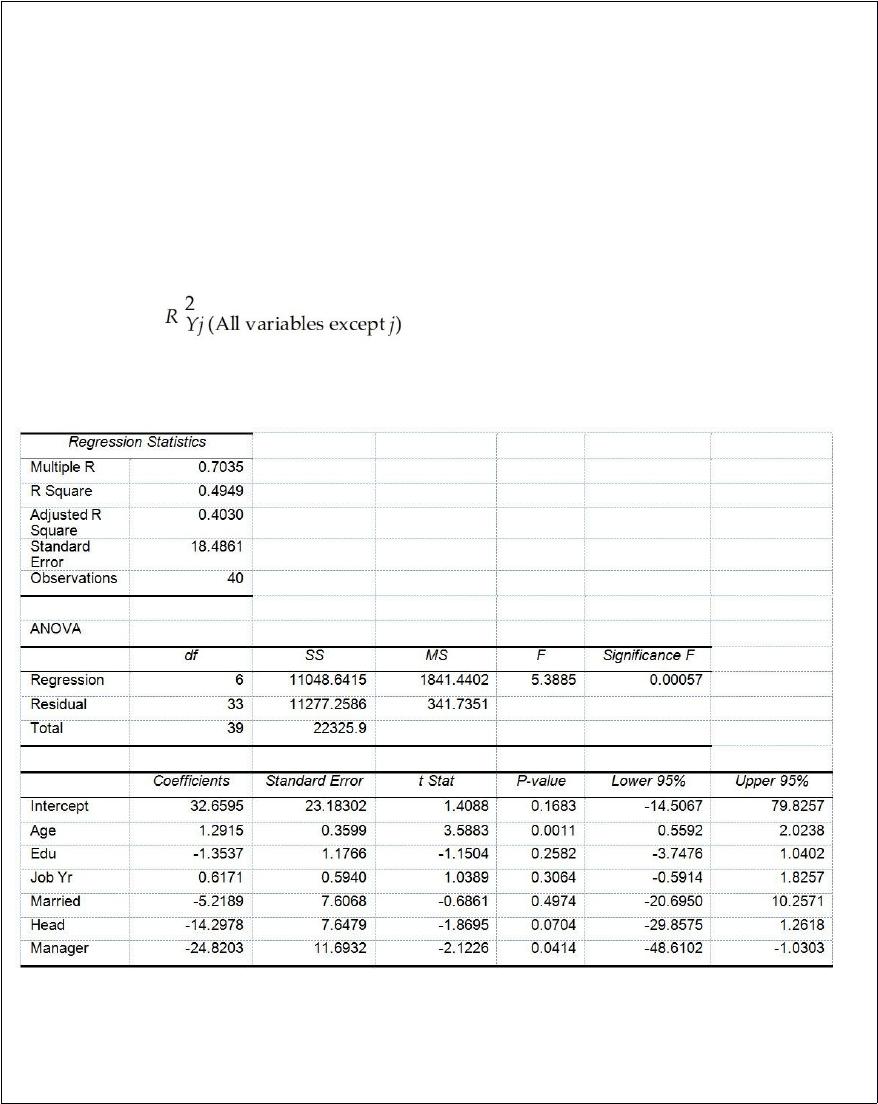
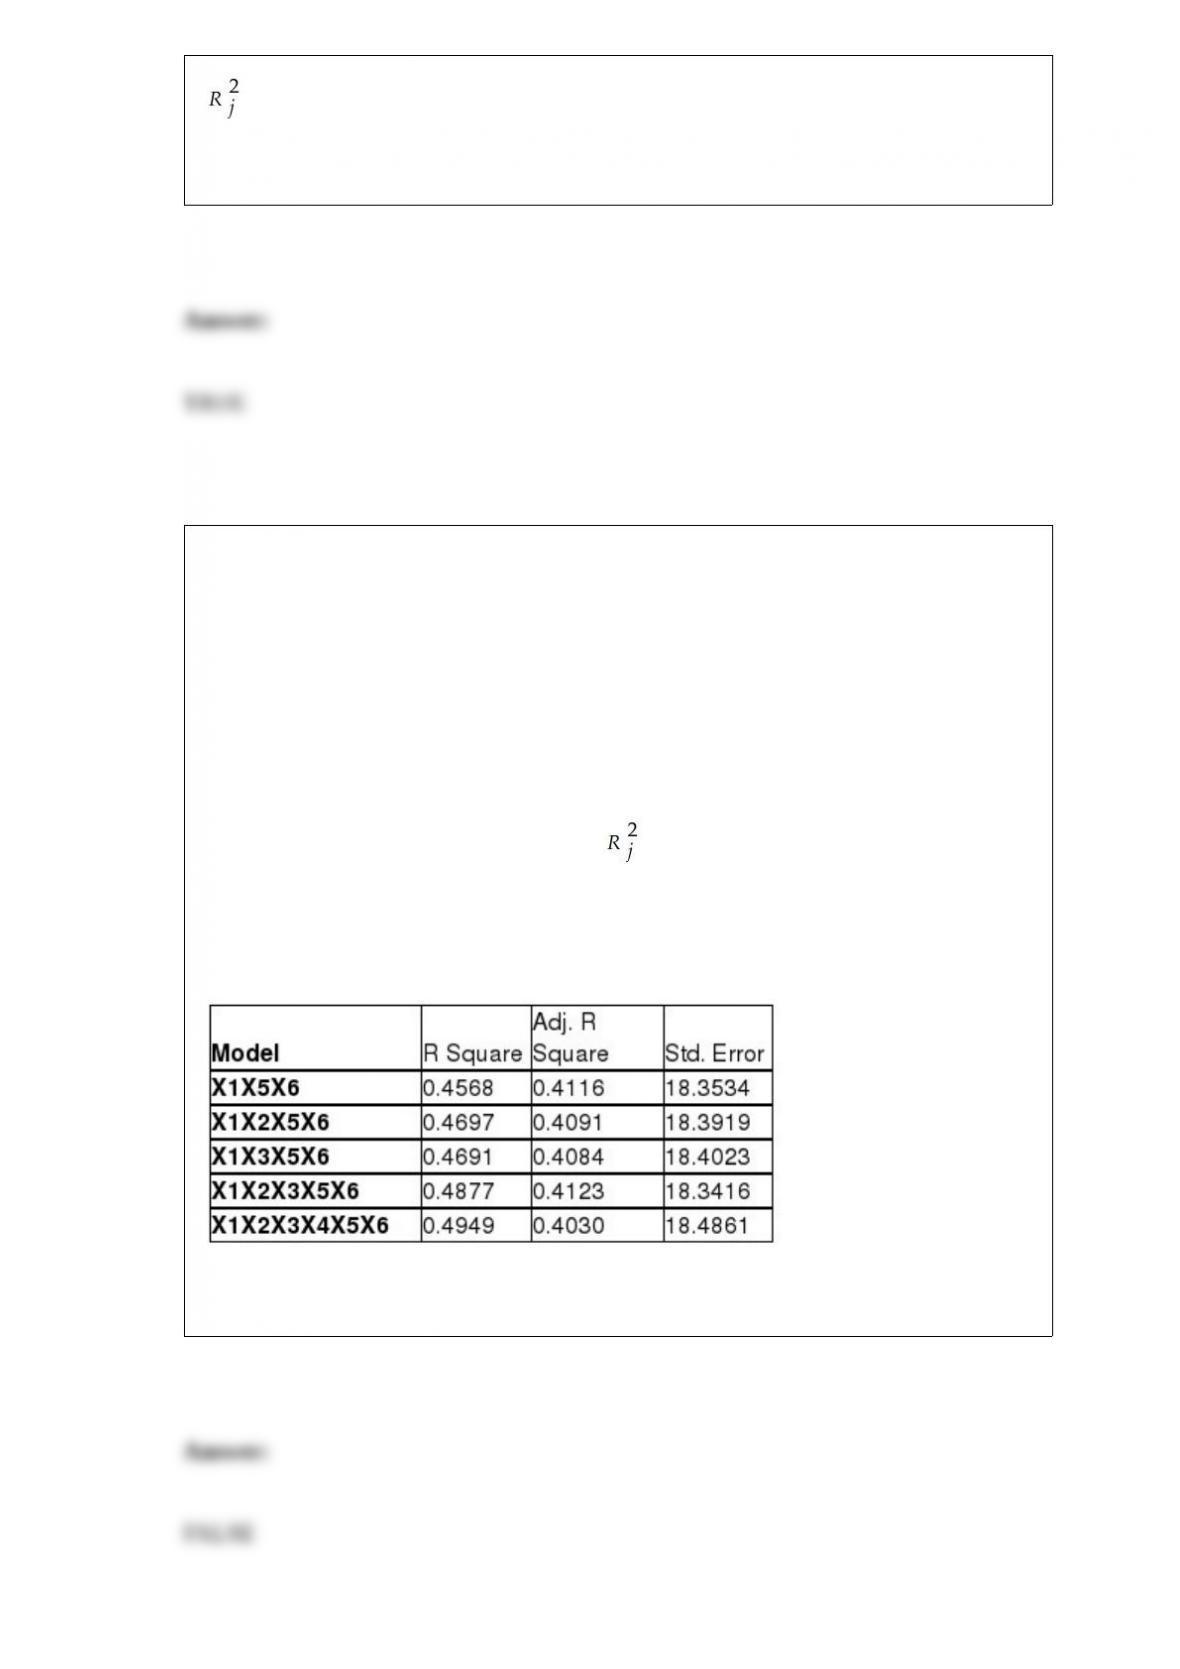
True or False: TABLE 17-10
Given below are results from the regression analysis where the dependent variable is
the number of weeks a worker is unemployed due to a layoff (Unemploy) and the
independent variables are the age of the worker (Age), the number of years of education
received (Edu), the number of years at the previous job (Job Yr), a dummy variable for
marital status (Married: 1 = married, 0 = otherwise), a dummy variable for head of
household (Head: 1 = yes, 0 = no) and a dummy variable for management position
(Manager: 1 = yes, 0 = no). We shall call this Model 1. The coefficient of partial
determination ( ) of each of the 6 predictors are, respectively,
0.2807, 0.0386, 0.0317, 0.0141, 0.0958, and 0.1201.
Model 2 is the regression analysis where the dependent variable is Unemploy and the
independent variables are Age and Manager. The results of the regression analysis are
given below:
Referring to Table 17-10, Model 1, the alternative hypothesis H1 : At least one of βj â
‰ 0 for j = 1, 2, 3, 4, 5, 6 implies that the number of weeks a worker is unemployed
due to a layoff is related to at least one of the explanatory variables.
True or False: The amount of time it takes to complete an examination has a left skewed
distribution with a mean of 65 minutes and a standard deviation of 8 minutes. If 64
students were randomly sampled, the probability that the sample mean of the sampled
students exceeds 71 minutes is approximately 0.
TABLE 9-1
Microsoft Excel was used on a set of data involving the number of defective items
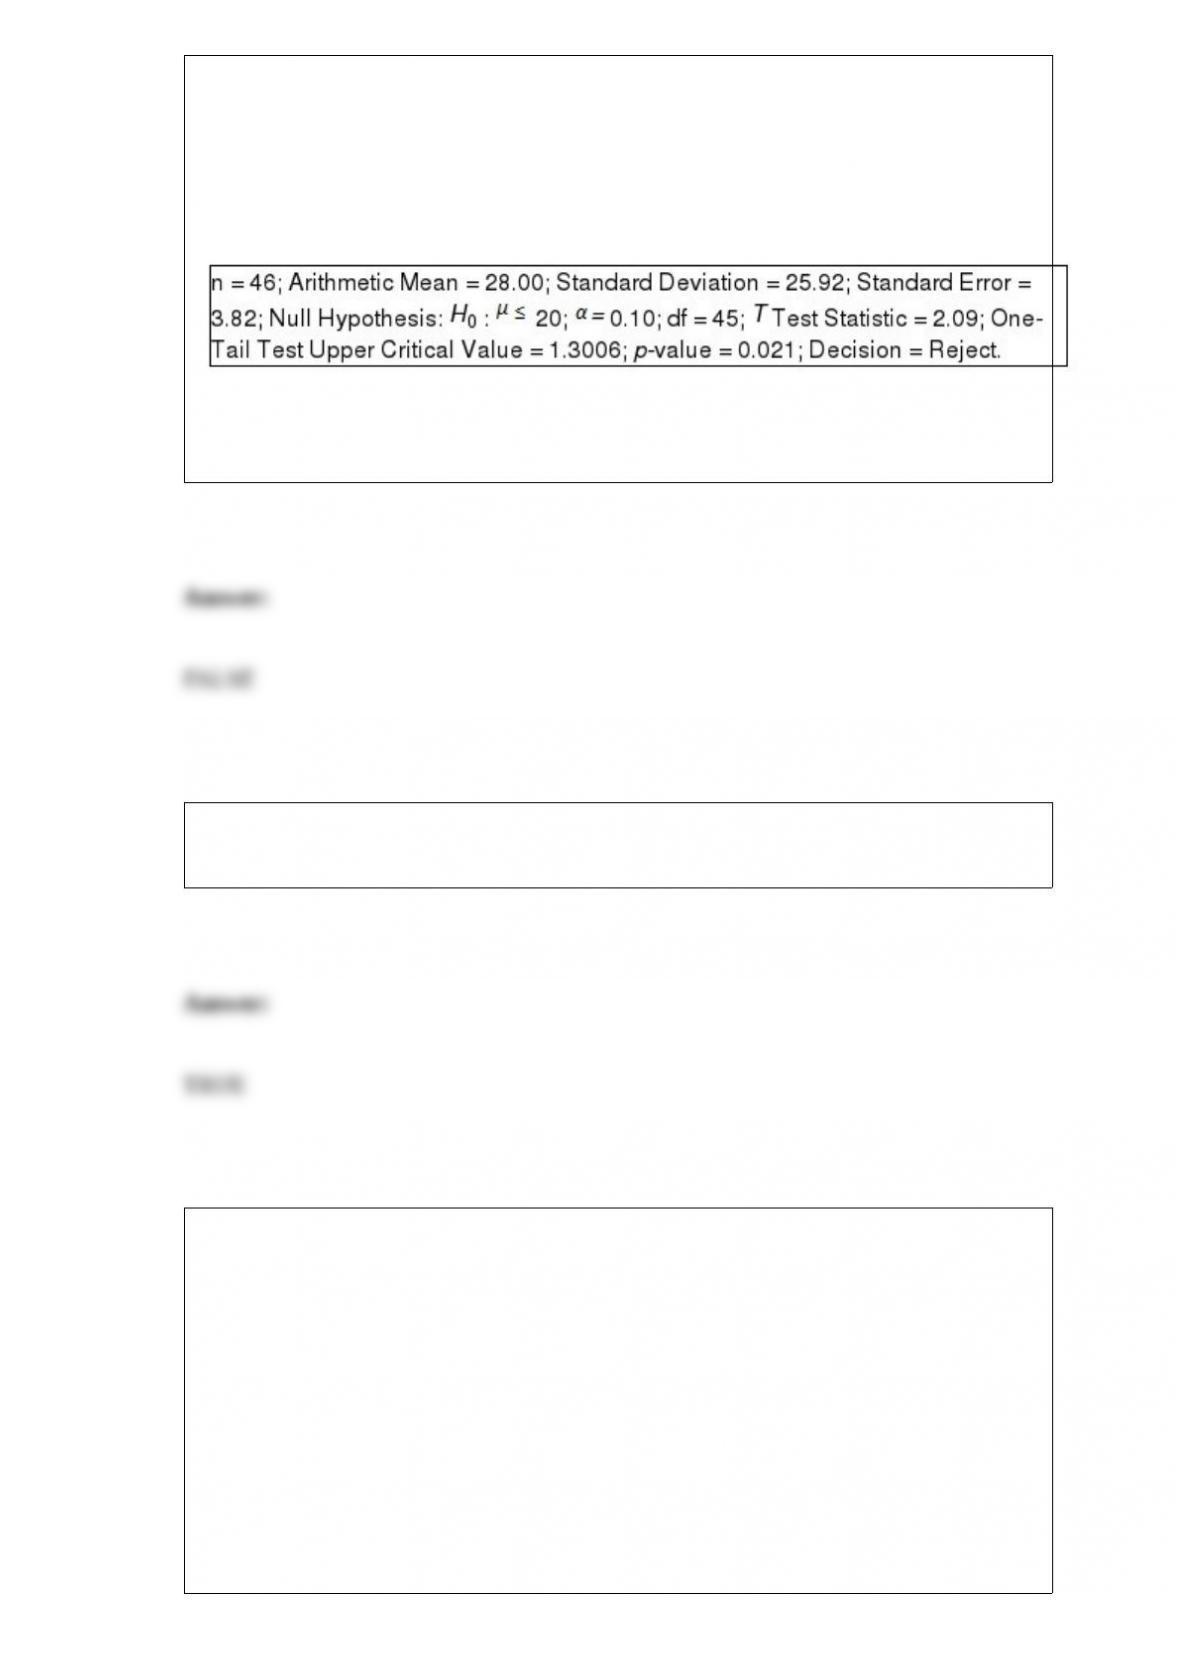
found in a random sample of 46 cases of light bulbs produced during a morning shift at
a plant. A manager wants to know if the mean number of defective bulbs per case is
greater than 20 during the morning shift. She will make her decision using a test with a
level of significance of 0.10. The following information was extracted from the
Microsoft Excel output for the sample of 46 cases:
True or False: Referring to Table 9-1, the null hypothesis would be rejected if a 1%
probability of committing a Type I error is allowed.
True or False: The amount of time a student spent studying for an exam will be
measured on a ratio scale.
True or False: Referring to Table 14-15, there is suffcient evidence
that instructional spending per pupil has an effect on percentage of
students passing the proficiency test while holding constant the effect
of mean teacher salary at a 5% level of significance.
TABLE 14-15
The superintendent of a school district wanted to predict the
percentage of students passing a sixth-grade proficiency test. She
obtained the data on percentage of students passing the proficiency
test (% Passing), mean teacher salary in thousands of dollars
(Salaries), and instructional spending per pupil in thousands of dollars

(Spending) of 47 schools in the state.
Following is the multiple regression output with Y = % Passing as the
dependent variable, X1 = Salaries and X2 = Spending:
True or False: The Regression Sum of Squares (SSR) can never be greater than the Total
Sum of Squares (SST).

TABLE 9-9
The president of a university claimed that the entering class this year appeared to be
larger than the entering class from previous years but their mean SAT score is lower
than previous years. He took a sample of 20 of this year’s entering students and found
that their mean SAT score is 1,501 with a standard deviation of 53. The university’s
record indicates that the mean SAT score for entering students from previous years is
1,520. He wants to find out if his claim is supported by the evidence at a 5% level of
significance.
True or False: Referring to Table 9-9, the null hypothesis would be rejected if a 10%
probability of committing a Type I error is allowed.
TABLE 14-17
Given below are results from the regression analysis where the
dependent variable is the number of weeks a worker is unemployed
due to a layoff (Unemploy) and the independent variables are the age
of the worker (Age) and a dummy variable for management position
(Manager: 1 = yes, 0 = no).
The results of the regression analysis are given below:
True or False: Referring to Table 14-17, the alternative hypothesis H1 :
At least one of βj ≠0 for j = 1, 2 implies that the number of weeks
a worker is unemployed due to a layoff is affected by at least one of
the explanatory variables.
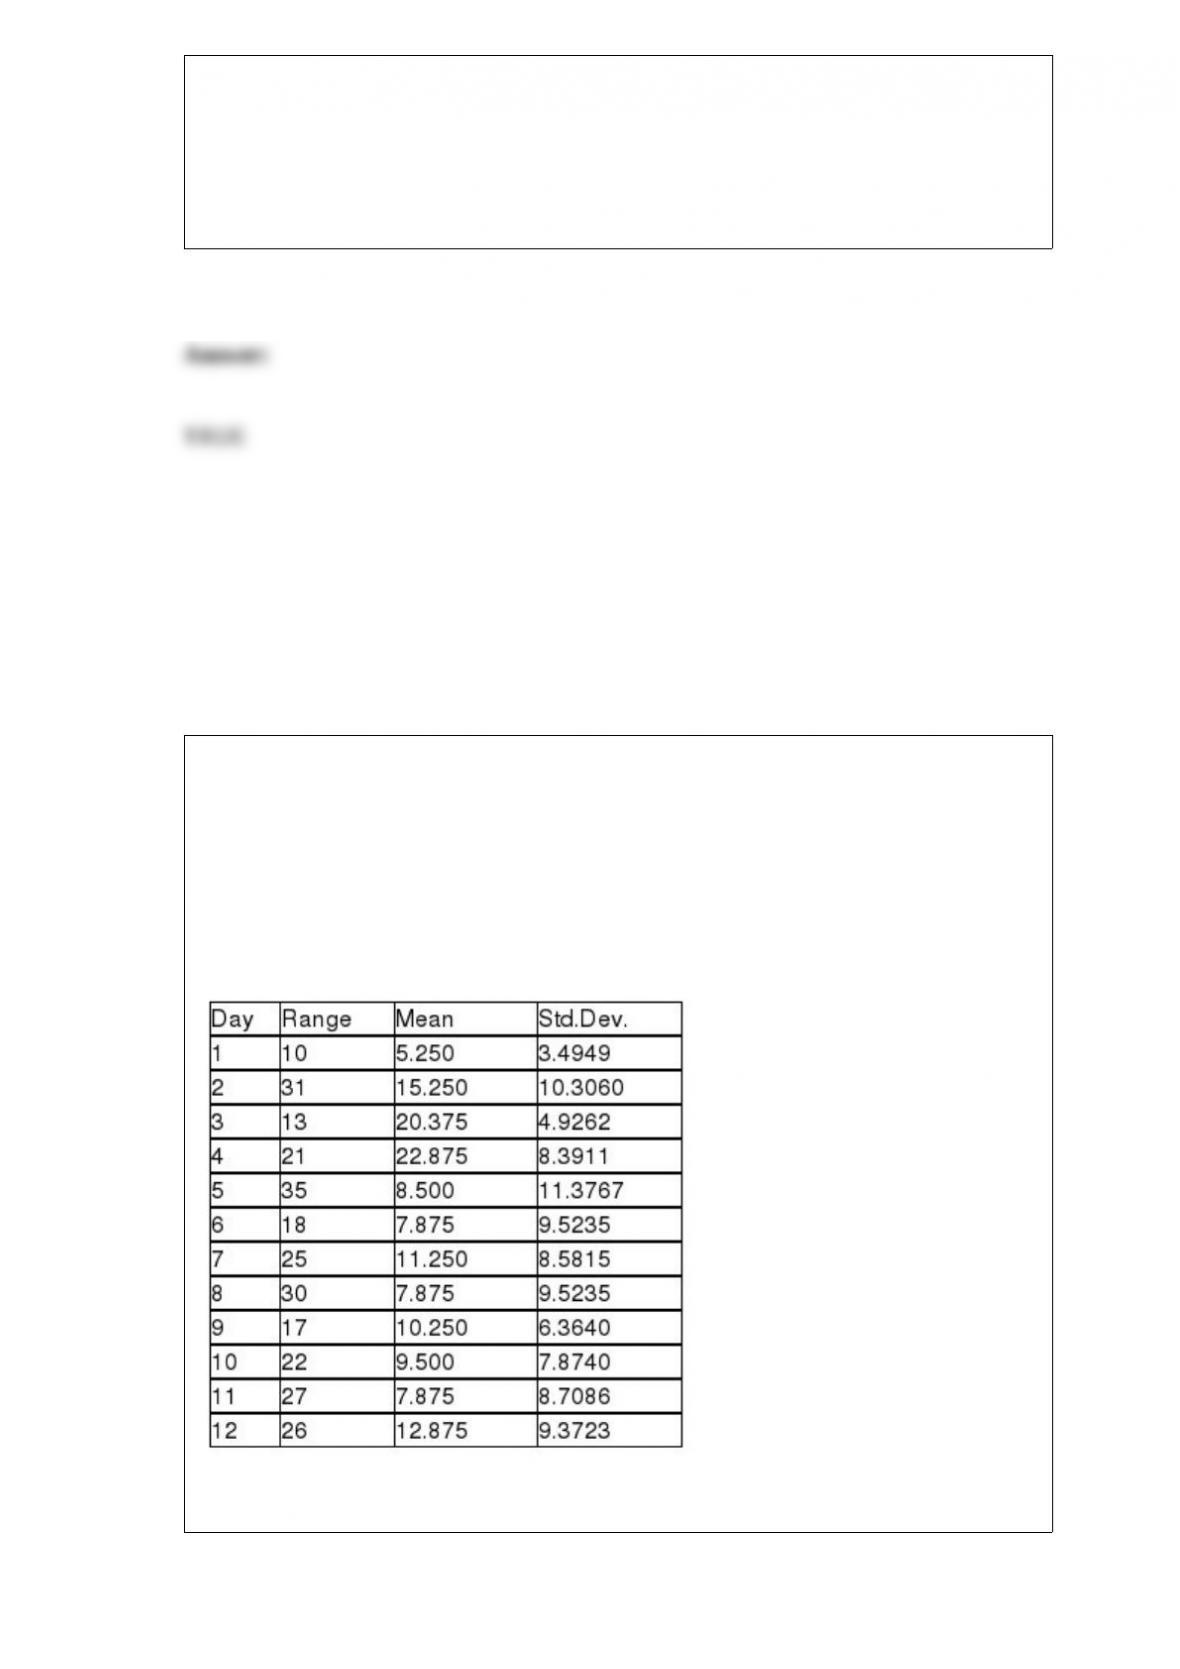
True or False: TABLE 18-8
Recently, a university switched to a new type of computer-based registration. The
registrar is concerned with the amount of time students are spending on the computer
registering under the new system. She decides to randomly select 8 students on each of
the 12 days of the registration and determine the time each spends on the computer
registering. The range, mean, and standard deviation of the times required to register are
in the table that follows.
Referring to Table 18-8, based on the R chart, it appears that the process is out of
control.

True or False: The McNemar test is approximately distributed as a Student’s t.
True or False: TABLE 17-9
What are the factors that determine the acceleration time (in sec.) from 0 to 60 miles per
hour of a car? Data on the following variables for 171 different vehicle models were
collected:
Accel Time: Acceleration time in sec.
Cargo Vol: Cargo volume in cu. ft.
HP: Horsepower
MPG: Miles per gallon
SUV: 1 if the vehicle model is an SUV with Coupe as the base when SUV and Sedan
are both 0
Sedan: 1 if the vehicle model is a sedan with Coupe as the base when SUV and Sedan
are both 0
The regression results using acceleration time as the dependent variable and the
remaining variables as the independent variables are presented below.
The various residual plots are as shown below.
The coefficient of partial determination ( ) of each of the 5
predictors are, respectively, 0.0380, 0.4376, 0.0248, 0.0188, and 0.0312.
The coefficient of multiple determination for the regression model using each of the 5
variables Xj as the dependent variable and all other X variables as independent variables
( ) are, respectively, 0.7461, 0.5676, 0.6764, 0.8582, 0.6632.
Referring to Table 17-9, the 0 to 60 miles per hour acceleration time of a coupe is
predicted to be 0.7679 seconds lower than that of an SUV.
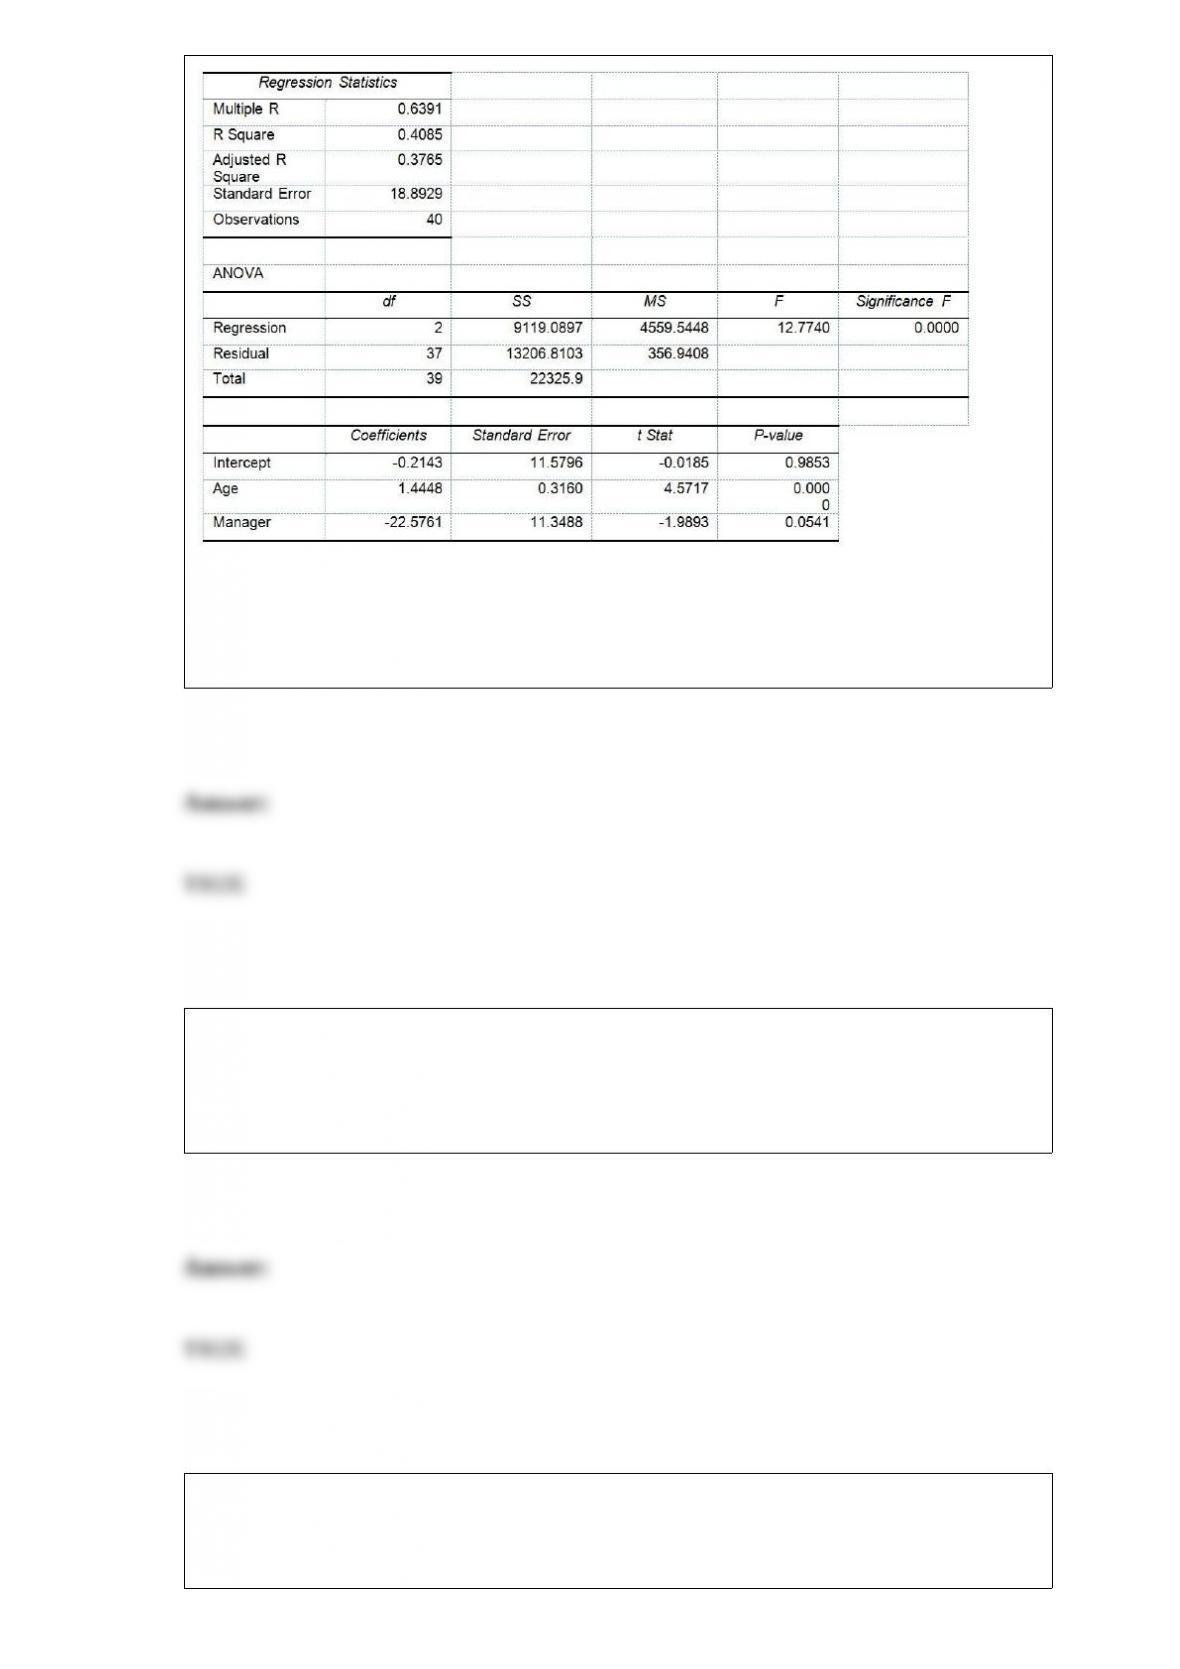
TABLE 15-6
Given below are results from the regression analysis on 40 observations where the
dependent variable is the number of weeks a worker is unemployed due to a layoff (Y)
and the independent variables are the age of the worker (X1), the number of years of
education received (X2), the number of years at the previous job (X3), a dummy variable
for marital status (X4: 1 = married, 0 = otherwise), a dummy variable for head of
household (X5: 1 = yes, 0 = no) and a dummy variable for management position (X6: 1
= yes, 0 = no).
The coefficient of multiple determination ( ) for the regression model using each of
the 6 variables Xj as the dependent variable and all other X variables as independent
variables are, respectively, 0.2628, 0.1240, 0.2404, 0.3510, 0.3342 and 0.0993.
The partial results from best-subset regression are given below:
True or False: Referring to Table 15-6, the variable X6 should be dropped to remove
collinearity.

True or False: The standardized normal distribution is used to develop a confidence
interval estimate of the population proportion when the sample size is sufficiently large.
True or False: The more expensive commodities are overly influential in an unweighted
aggregate price index.
TABLE 17-10
Given below are results from the regression analysis where the dependent variable is
the number of weeks a worker is unemployed due to a layoff (Unemploy) and the
independent variables are the age of the worker (Age), the number of years of education
received (Edu), the number of years at the previous job (Job Yr), a dummy variable for
marital status (Married: 1 = married, 0 = otherwise), a dummy variable for head of
household (Head: 1 = yes, 0 = no) and a dummy variable for management position
(Manager: 1 = yes, 0 = no). We shall call this Model 1. The coefficient of partial
determination ( ) of each of the 6 predictors are, respectively,
0.2807, 0.0386, 0.0317, 0.0141, 0.0958, and 0.1201.
Model 2 is the regression analysis where the dependent variable is Unemploy and the
independent variables are Age and Manager. The results of the regression analysis are
given below:
Referring to Table 17-10, Model 1, which of the following is the correct null hypothesis
to test whether age has any effect on the number of weeks a worker is unemployed due
to a layoff while holding constant the effect of all the other independent variables?
A) H0 : β0 = 0
B) H0 : β1 = 0
C) H0 : β2 = 0
D) H0 : β3 = 0
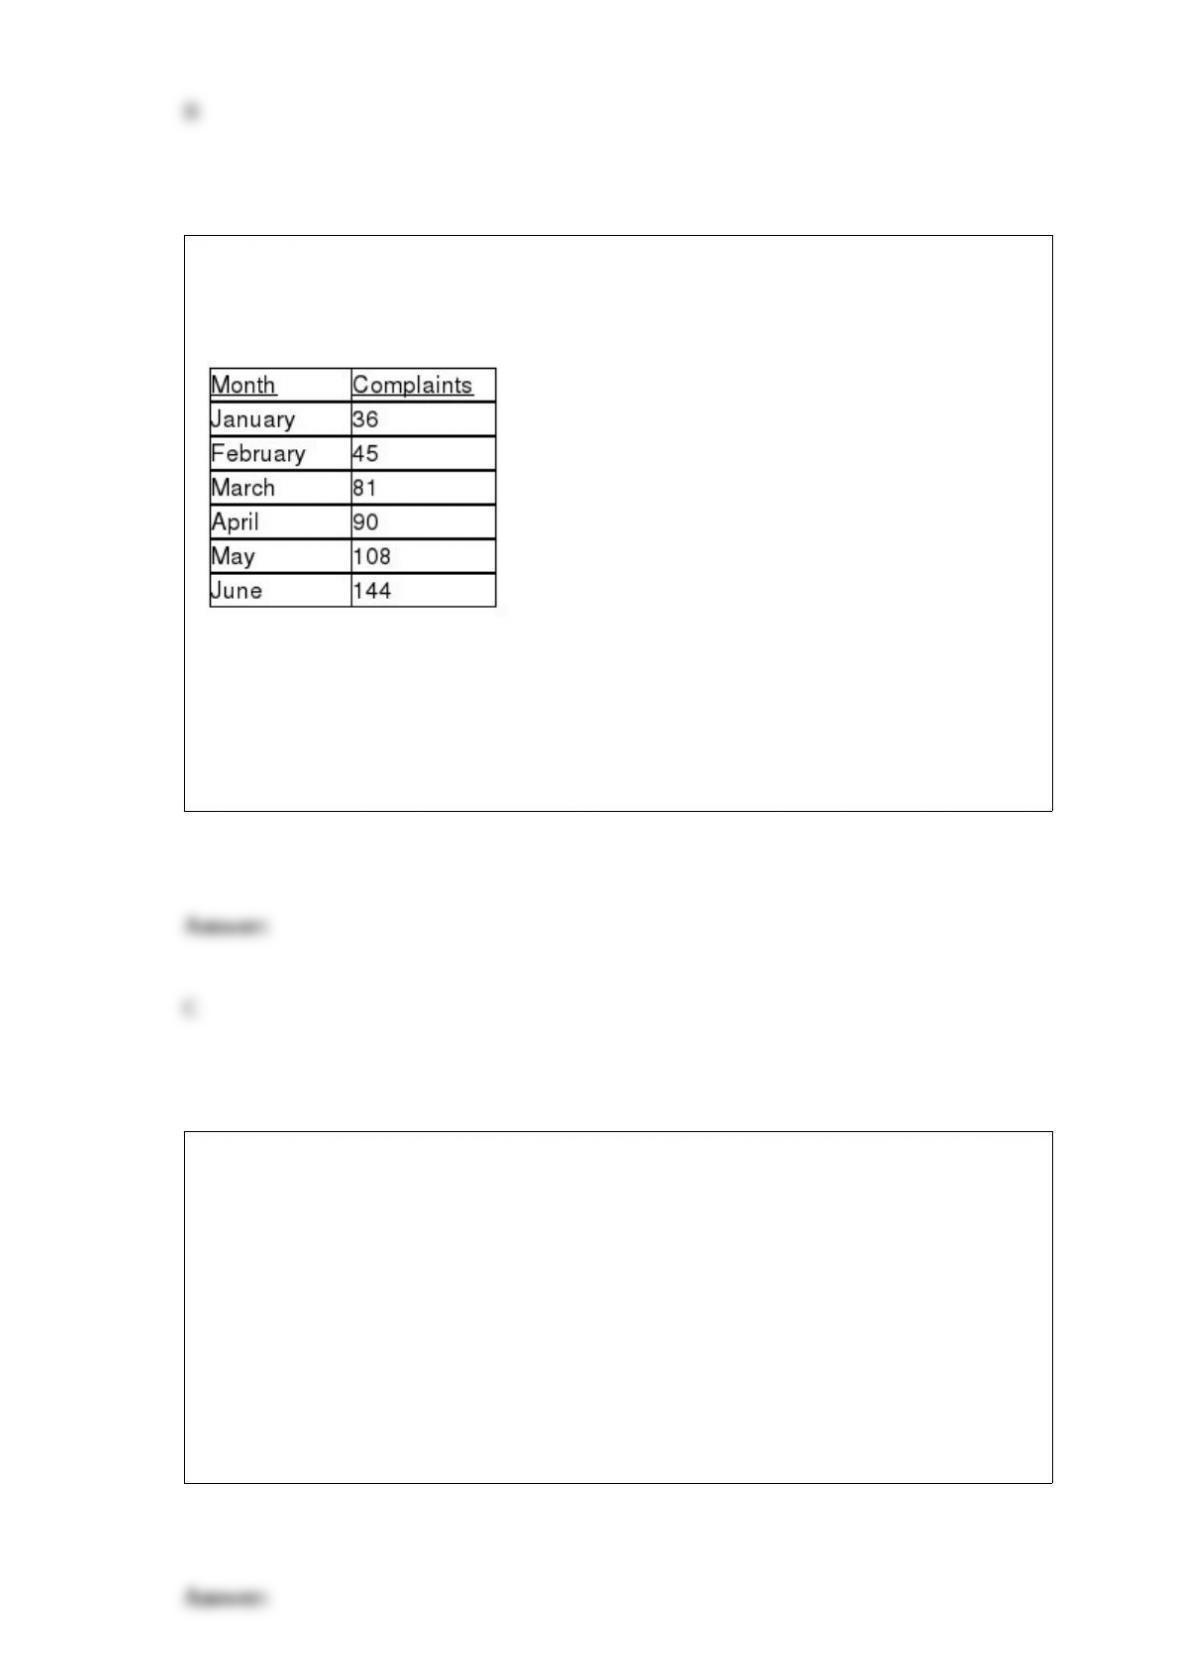
TABLE 16-3
The following table contains the number of complaints received in a department store
for the first 6 months of last year.
Referring to Table 16-3, if a three-month moving average is used to smooth this series,
how many values would it have?
A) 2
B) 3
C) 4
D) 5
You have collected data on the approximate retail price (in $) and the energy cost per
year (in $) of 15 refrigerators. Which of the following is the best for presenting the
data?
A) a pie chart
B) a scatter plot
C) a side-by-side bar chart
D) a contingency table

Data on the amount of time spent studying and the exam score of 150 students at a high
school were collected. You want to know if a student’s exam score is linearly related to
the amount of time spent on studying. Which of the following would you compute?
A) Arithmetic mean
B) Median
C) Coefficient of variation
D) Coefficient of correlation
According to a survey of American households, the probability that the residents own 2
cars if annual household income is over $50,000 is 80%. Of the households surveyed,
60% had incomes over $50,000 and 70% had 2 cars. The probability that the residents
do not own 2 cars if annual household income is not over $50,000 is
A) 0.12.
B) 0.18.
C) 0.45.
D) 0.70.
A physician and president of a Tampa Health Maintenance Organization (HMO) are
attempting to show the benefits of managed health care to an insurance company. The
physician believes that certain types of doctors are more cost-effective than others. To

investigate this, the president obtained independent random samples of 20 HMO
physicians from each of 4 primary specialties – General Practice (GP), Internal
Medicine (IM), Pediatrics (PED), and Family Physicians (FP) – and recorded the total
charges per member per month for each. A second variable which the president believes
influences total charges per member per month is whether the doctor is a foreign or
USA medical school graduate. To investigate this, the president also collected data on
20 foreign medical school graduates in each of the 4 primary specialty types described
above. Altogether, information on charges for 40 doctors (20 foreign and 20 USA
medical school graduates) was obtained for each of the 4 specialties. The president has
already found out that specialty types and origin of the medical degree do not interact to
affect the charges. Which of the following tests will be the most appropriate to find out
if the primary specialty affects the charges?
A) Tukey-Kramer multiple comparisons procedure for one-way ANOVA
B) One-way ANOVA F test for differences among more than two means
C) Two-way ANOVA F test for primary specialty effect
D) Two-way ANOVA F test for origin of the medical degree effect
TABLE 17-6
A weight-loss clinic wants to use regression analysis to build a model for weight loss of
a client (measured in pounds). Two variables thought to affect weight loss are client’s
length of time on the weight-loss program and time of session. These variables are
described below:
Y = Weight loss (in pounds)
X1 = Length of time in weight-loss program (in months)
X2 = 1 if morning session, 0 if not
X3 = 1 if afternoon session, 0 if not (Base level = evening session)
Data for 12 clients on a weight-loss program at the clinic were collected and used to fit
the interaction model:
Y = β0 + β1X1 + β2X2 + β3X3 + β4X1X2 + β5X1X3 + ε
Partial output from Microsoft Excel follows:
Regression Statistics
ANOVA
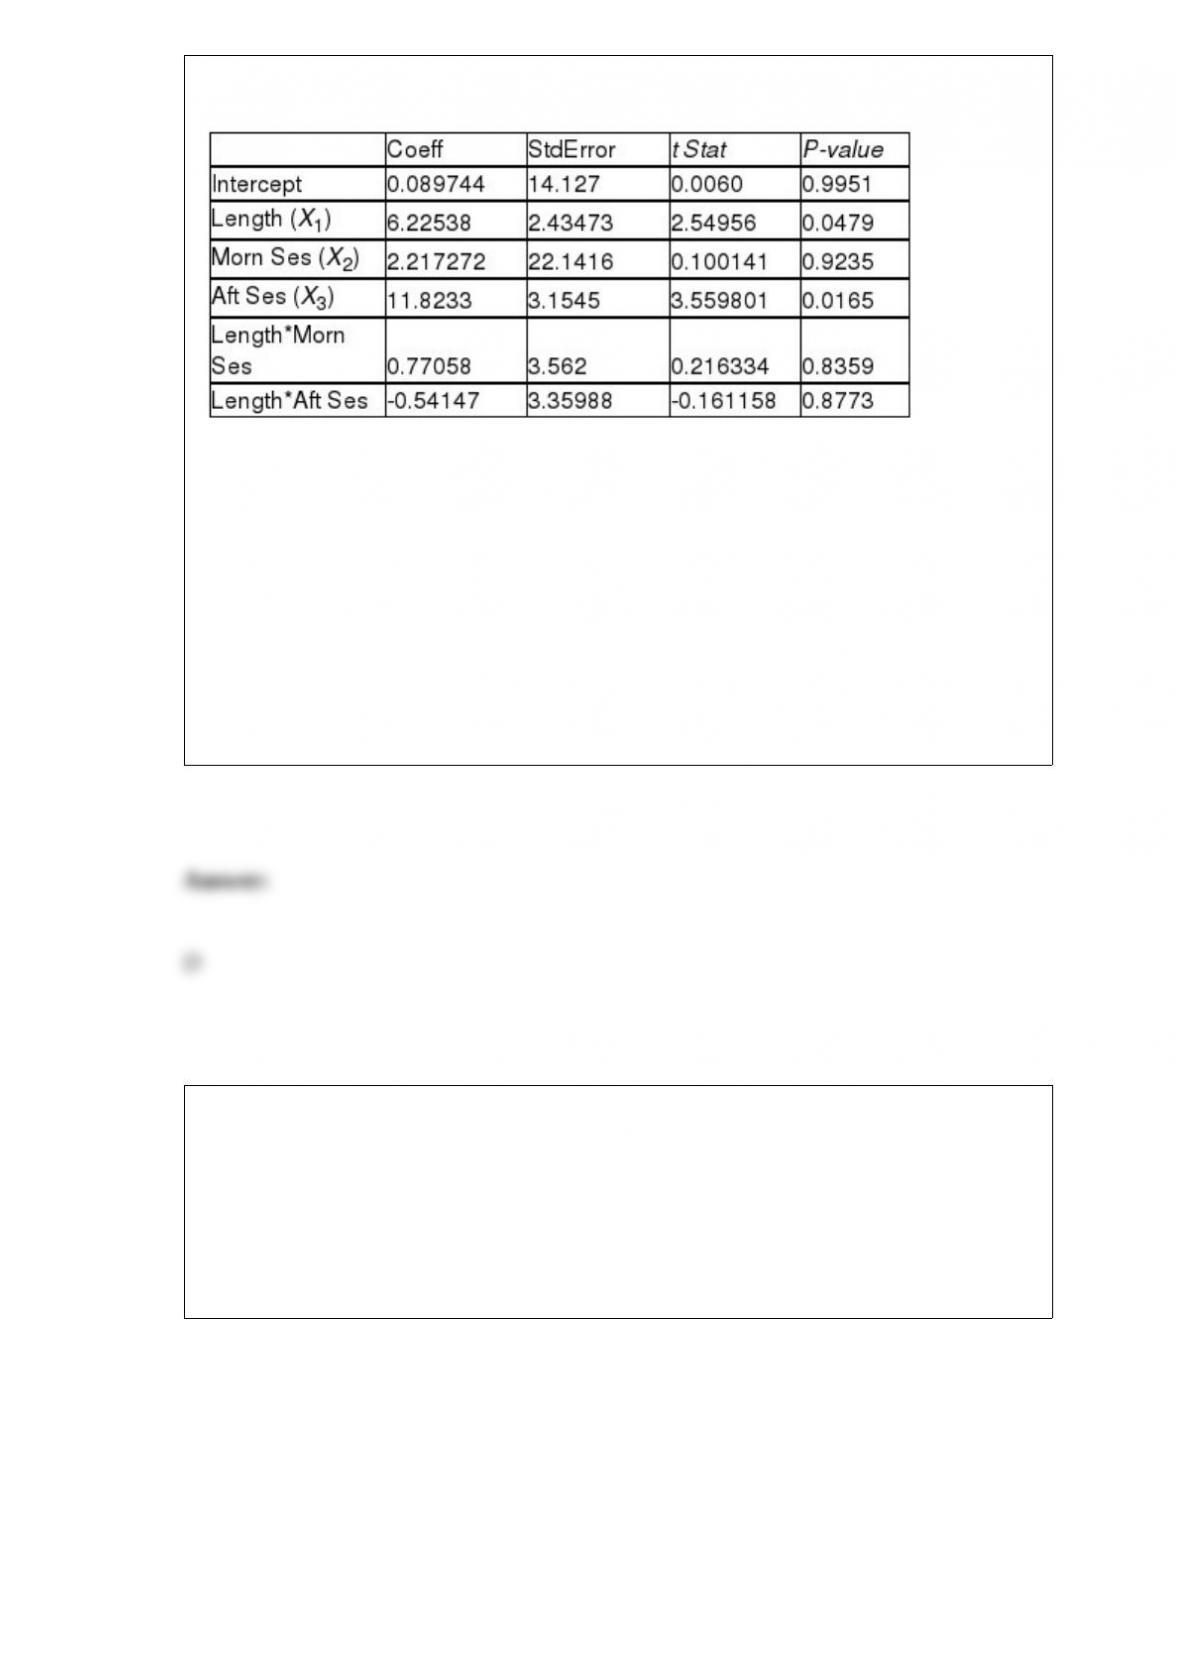
F = 5.41118 Significance F = 0.040201
Referring to Table 17-6, which of the following statements is supported by the analysis
shown?
A) There is sufficient evidence (at α = 0.05) of curvature in the relationship between
weight loss (Y) and months in program (X1).
B) There is sufficient evidence (at α = 0.05) to indicate that the relationship between
weight loss (Y) and months in program (X1) depends on session time.
C) There is sufficient evidence (at α = 0.10) to indicate that the session time (morning,
afternoon, evening) affects weight loss (Y).
D) There is insufficient evidence (at α = 0.10) to indicate that the relationship between
weight loss (Y) and months in program (X1) depends on session time.
Referring to Table 14-5, which of the following values for α is the smallest for which
the regression model as a whole is significant?
TABLE 14-5
A microeconomist wants to determine how corporate sales are influenced by capital and
wage spending by companies. She proceeds to randomly select 26 large corporations
and record information in millions of dollars. The Microsoft Excel output below shows
results of this multiple regression.
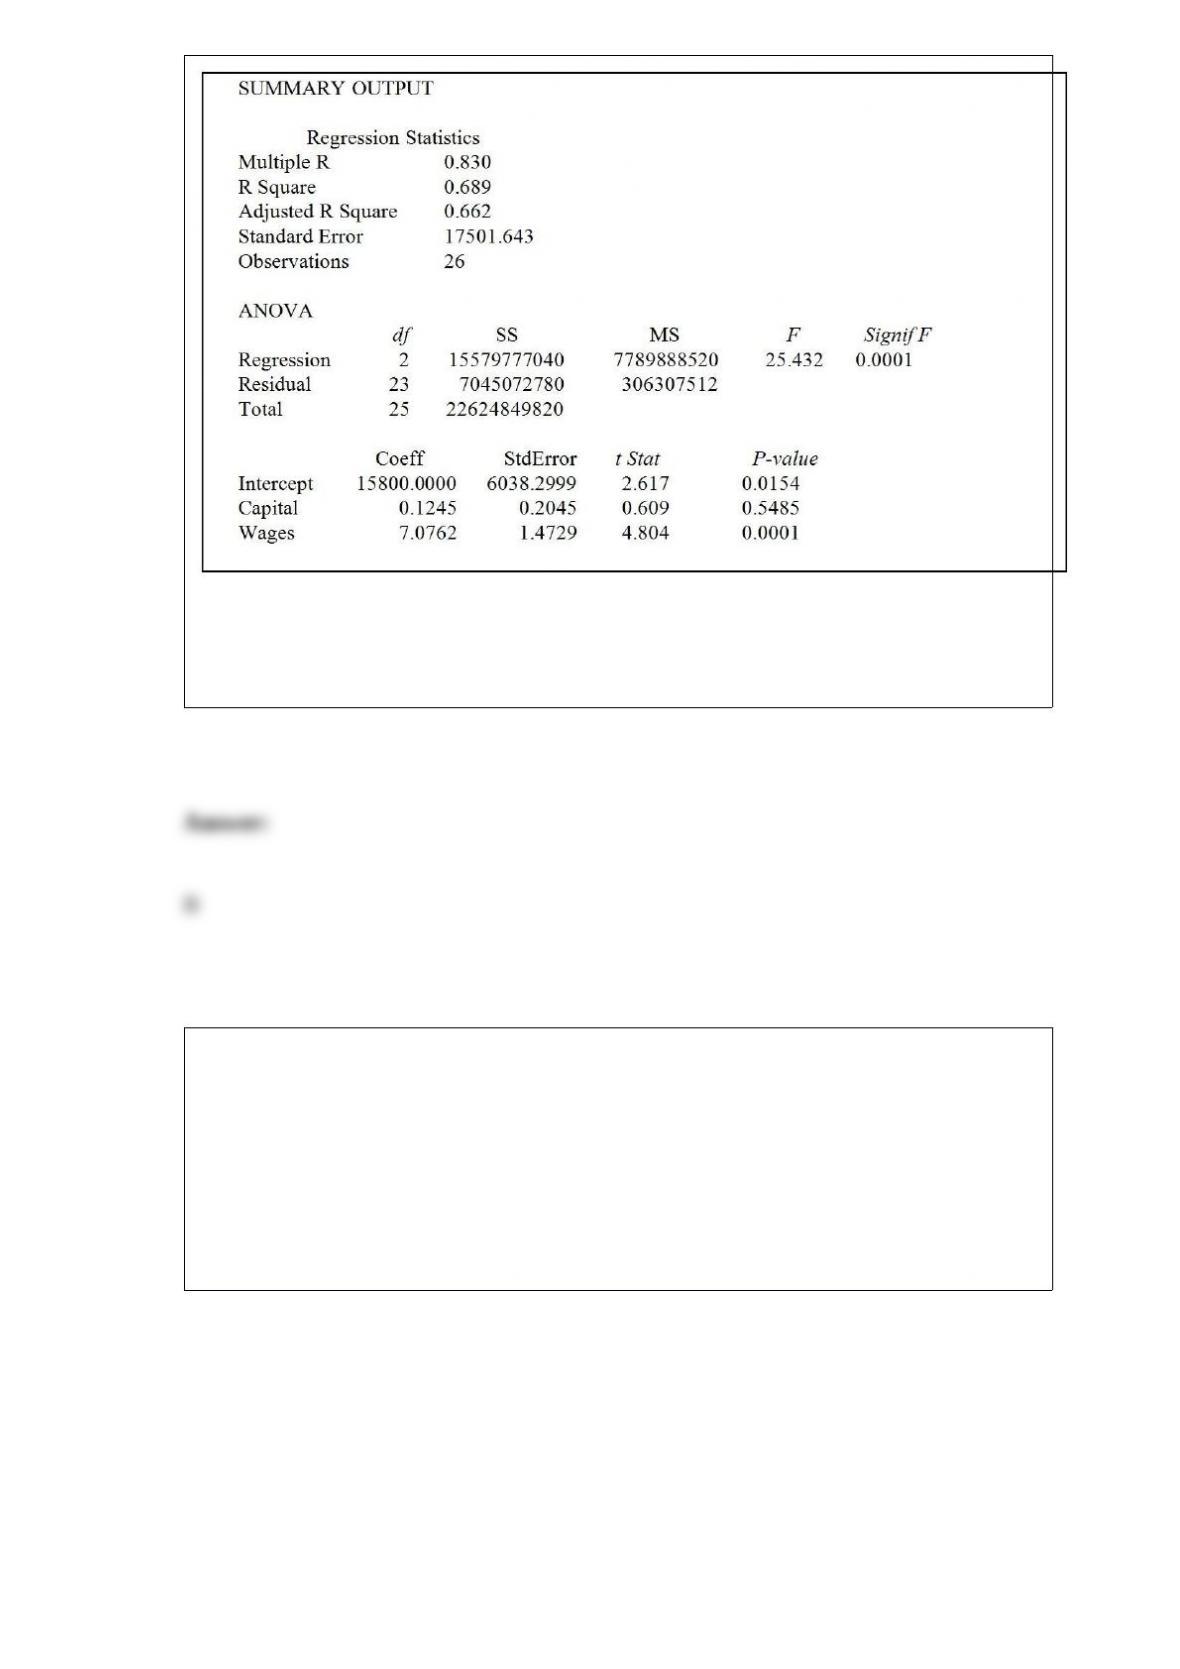
A) 0.00005
B) 0.001
C) 0.01
D) 0.05
TABLE 13-11
A computer software developer would like to use the number of downloads (in
thousands) for the trial version of his new shareware to predict the amount of revenue
(in thousands of dollars) he can make on the full version of the new shareware.
Following is the output from a simple linear regression along with the residual plot and
normal probability plot obtained from a data set of 30 different sharewares that he has
developed:
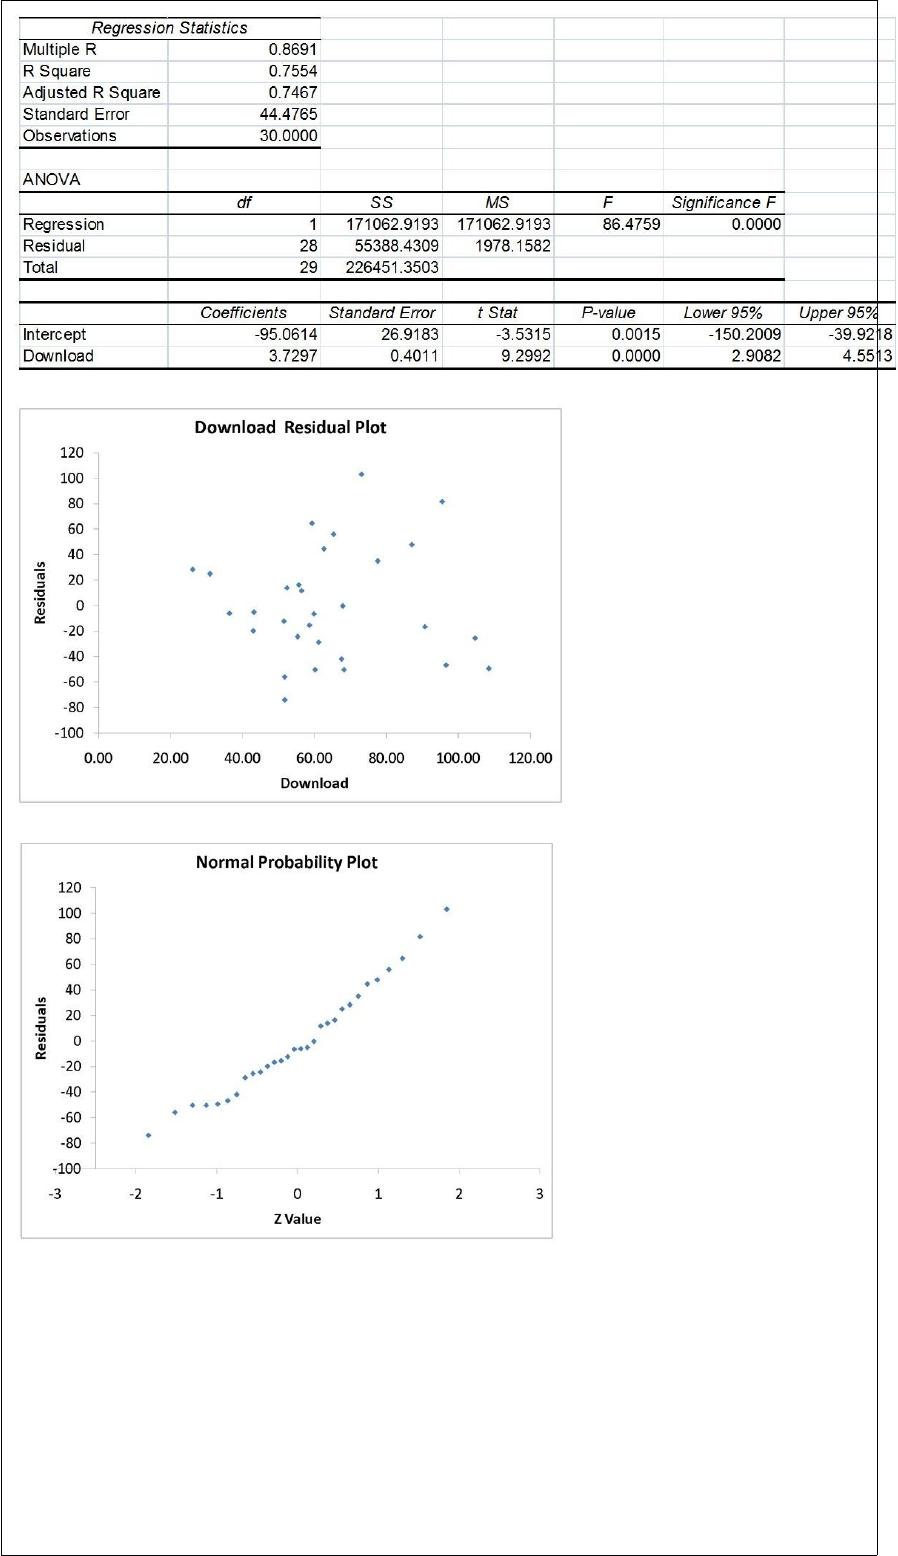
Referring to table 13-11, which of the following is the correct interpretation for the
slope coefficient?
A) For each decrease of 1 thousand downloads, the expected revenue is estimated to
increase by $3.7297 thousands.
B) For each increase of 1 thousand downloads, the expected revenue is estimated to
increase by $3.7297 thousands.

C) For each decrease of 1 thousand dollars in expected revenue, the expected number of
downloads is estimated to increase by 3.7297 thousands.
D) For each increase of 1 thousand dollars in expected revenue, the expected number of
downloads is estimated to increase by 3.7297 thousands.
The quality control manager of a candy plant is inspecting a batch of chocolate chip
bags. When the production process is in control, the average number of blue chocolate
chips per bag is 6.0. Suppose that the probability of a blue chocolate chip in a bag is
constant across bags and the number of blue chocolate chips in one bag is independent
of the number in any other bag. Which of the following distributions would you use to
figure out the probability that any particular bag being inspected has 4.0 blue chocolate
chips?
A) Hypergeometric distribution
B) Poisson distribution
C) Uniform distribution
D) Binomial distribution
Referring to Table 14-5, suppose the microeconomist wants to test whether the
coefficient on Capital is significantly different from 0. What is the value of the relevant
t-statistic?
TABLE 14-5
A microeconomist wants to determine how corporate sales are influenced by capital and
wage spending by companies. She proceeds to randomly select 26 large corporations
and record information in millions of dollars. The Microsoft Excel output below shows
results of this multiple regression.
A) 0.609
B) 2.617
C) 4.804
D) 25.432
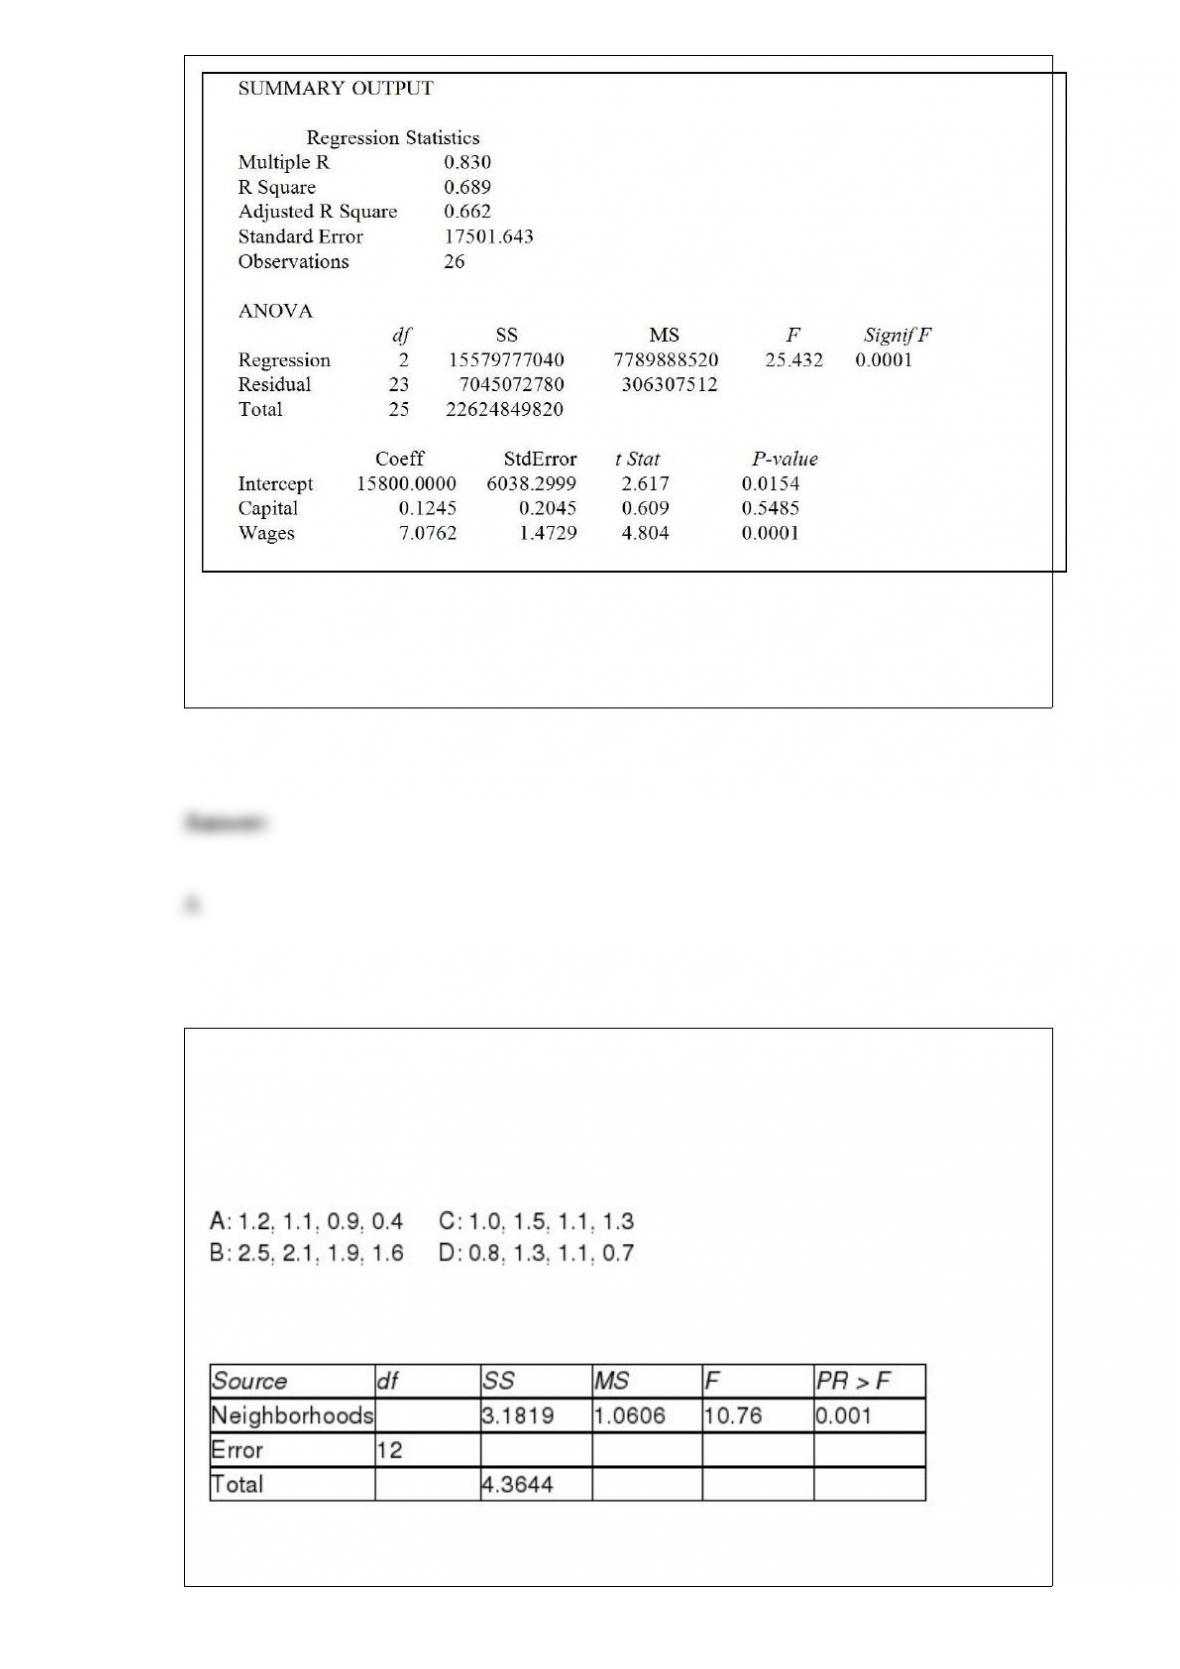
TABLE 11-2
A realtor wants to compare the mean sales-to-appraisal ratios of residential properties
sold in four neighborhoods (A, B, C, and D). Four properties are randomly selected
from each neighborhood and the ratios recorded for each, as shown below.
Interpret the results of the analysis summarized in the following table:
Referring to Table 11-2, the within group sum of squares is
A) 1.0606.
B) 1.1825.
C) 3.1819.
D) 4.3644.
TABLE 16-12
A local store developed a multiplicative time-series model to forecast its revenues in
future quarters, using quarterly data on its revenues during the 5-year period from 2008
to 2012. The following is the resulting regression equation:
log10 = 6.102 + 0.012 X – 0.129 1 – 0.054 2 + 0.098 3
where is the estimated number of contracts in a quarter
X is the coded quarterly value with X = 0 in the first quarter of 2008
1 is a dummy variable equal to 1 in the first quarter of a year and 0 otherwise
2 is a dummy variable equal to 1 in the second quarter of a year and 0 otherwise
is a dummy variable equal to 1 in the third quarter of a year and 0 otherwise
Referring to Table 16-12, the best interpretation of the coefficient of X (0.012) in the
regression equation is
A) the quarterly compound growth rate in revenues is around 2.8%.
B) the annual growth rate in revenues is around 2.8%.
C) the quarterly growth rate in revenues is around 1.2%.
D) the annual growth rate in revenues is around 1.2%.
The Dean of Students conducted a survey on campus. Grade point average (GPA) is an
example of a ________ numerical variable.

A contractor wants to forecast the number of contracts in future quarters, using
quarterly data on a number of contracts over the last 10 years. Which of the following
would be the most appropriate analysis to perform?
A) Autoregressive modeling
B) One-way ANOVA
C) Least-squares forecasting with monthly or quarterly data
D) Two-way ANOVA
The probability that a particular brand of smoke alarm will malfunction in the presence
of smoke is 0.002. A batch of 100,000 such alarms was produced by independent
production lines. Which of the following distributions would you use to figure out the
probability that at most 5,000 of them will malfunction in case of a fire?
A) Hypergeometric distribution
B) Poisson distribution
C) Binomial distribution
D) Uniform distribution
If a test of hypothesis has a Type I error probability ( ) of 0.01, it means that
A) if the null hypothesis is true, you don’t reject it 1% of the time.
B) if the null hypothesis is true, you reject it 1% of the time.
C) if the null hypothesis is false, you don’t reject it 1% of the time.
D) if the null hypothesis is false, you reject it 1% of the time.
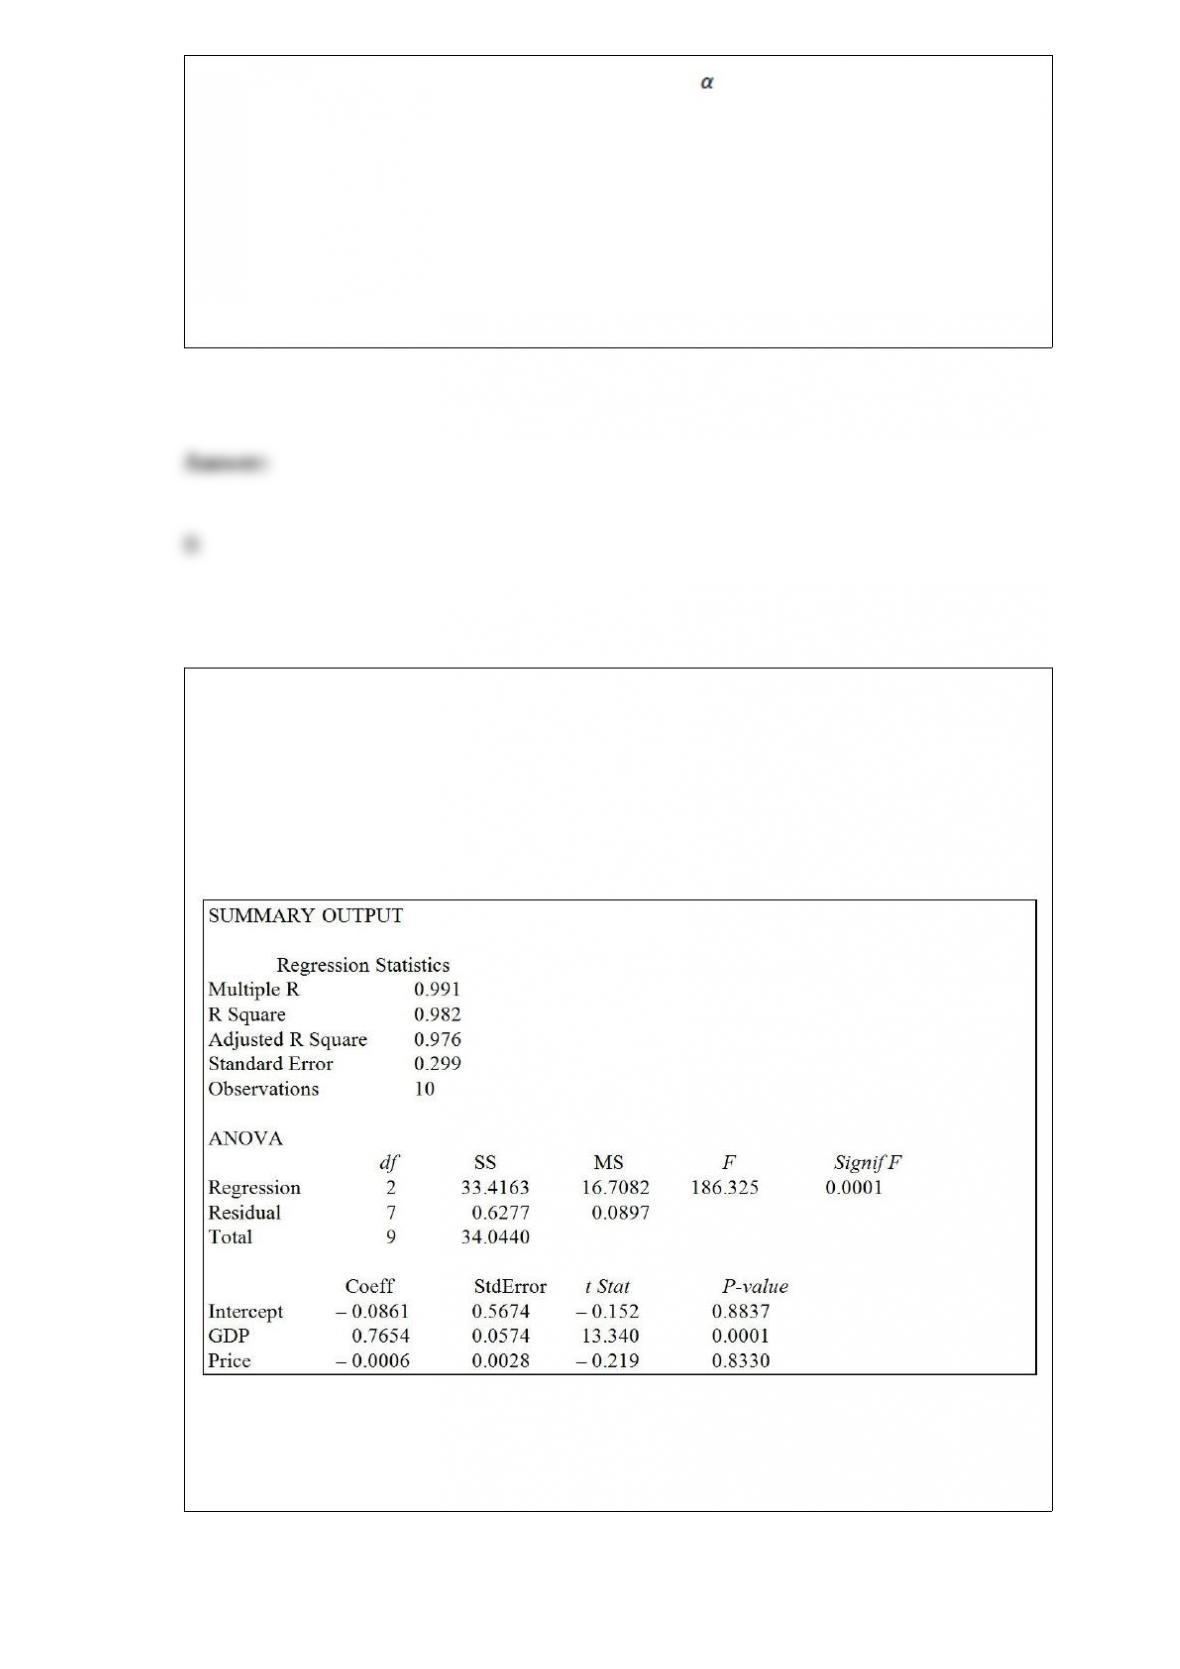
Referring to Table 14-3, to test whether aggregate price index has a negative impact on
consumption, the p-value is
TABLE 14-3
An economist is interested to see how consumption for an economy (in $ billions) is
influenced by gross domestic product ($ billions) and aggregate price (consumer price
index). The Microsoft Excel output of this regression is partially reproduced below.
A) 0.0001.
B) 0.4165.
C) 0.8330.
D) 0.8837.

TABLE 1-1
The manager of the customer service division of a major consumer electronics company
is interested in determining whether the customers who have purchased a Blu-ray
player made by the company over the past 12 months are satisfied with their products.
Referring to Table 1-1, the possible responses to the question “What brand of Blu-ray
player did you purchase?” result in
A) a nominal scale variable.
B) an ordinal scale variable.
C) an interval scale variable.
D) a ratio scale variable.
Referring to Table 14-13, the predicted demand in Los Angeles when
the mortgage rate is 8% is ________.
TABLE 14-13
An econometrician is interested in evaluating the relationship of
demand for building materials to mortgage rates in Los Angeles and
San Francisco. He believes that the appropriate model is
Y = 10 + 5X1 + 8X2
where X1 = mortgage rate in %
X2 = 1 if SF, 0 if LA
Y = demand in $100 per capita

The amount of bleach a machine pours into bottles has a mean of 36 oz. with a standard
deviation of 0.15 oz. Suppose we take a random sample of 36 bottles filled by this
machine. The probability that the mean of the sample is less than 36.03 is ________.
TABLE 10-3
A real estate company is interested in testing whether the mean time that families in
Gotham have been living in their current homes is less than families in Metropolis.
Assume that the two population variances are equal. A random sample of 100 families
from Gotham and a random sample of 150 families in Metropolis yield the following
data on length of residence in current homes.
Gotham: G = 35 months, = 900 Metropolis: M = 50 months, = 1050
Referring to Table 10-3, what is the 99% confidence interval estimate for the difference
in the two means?
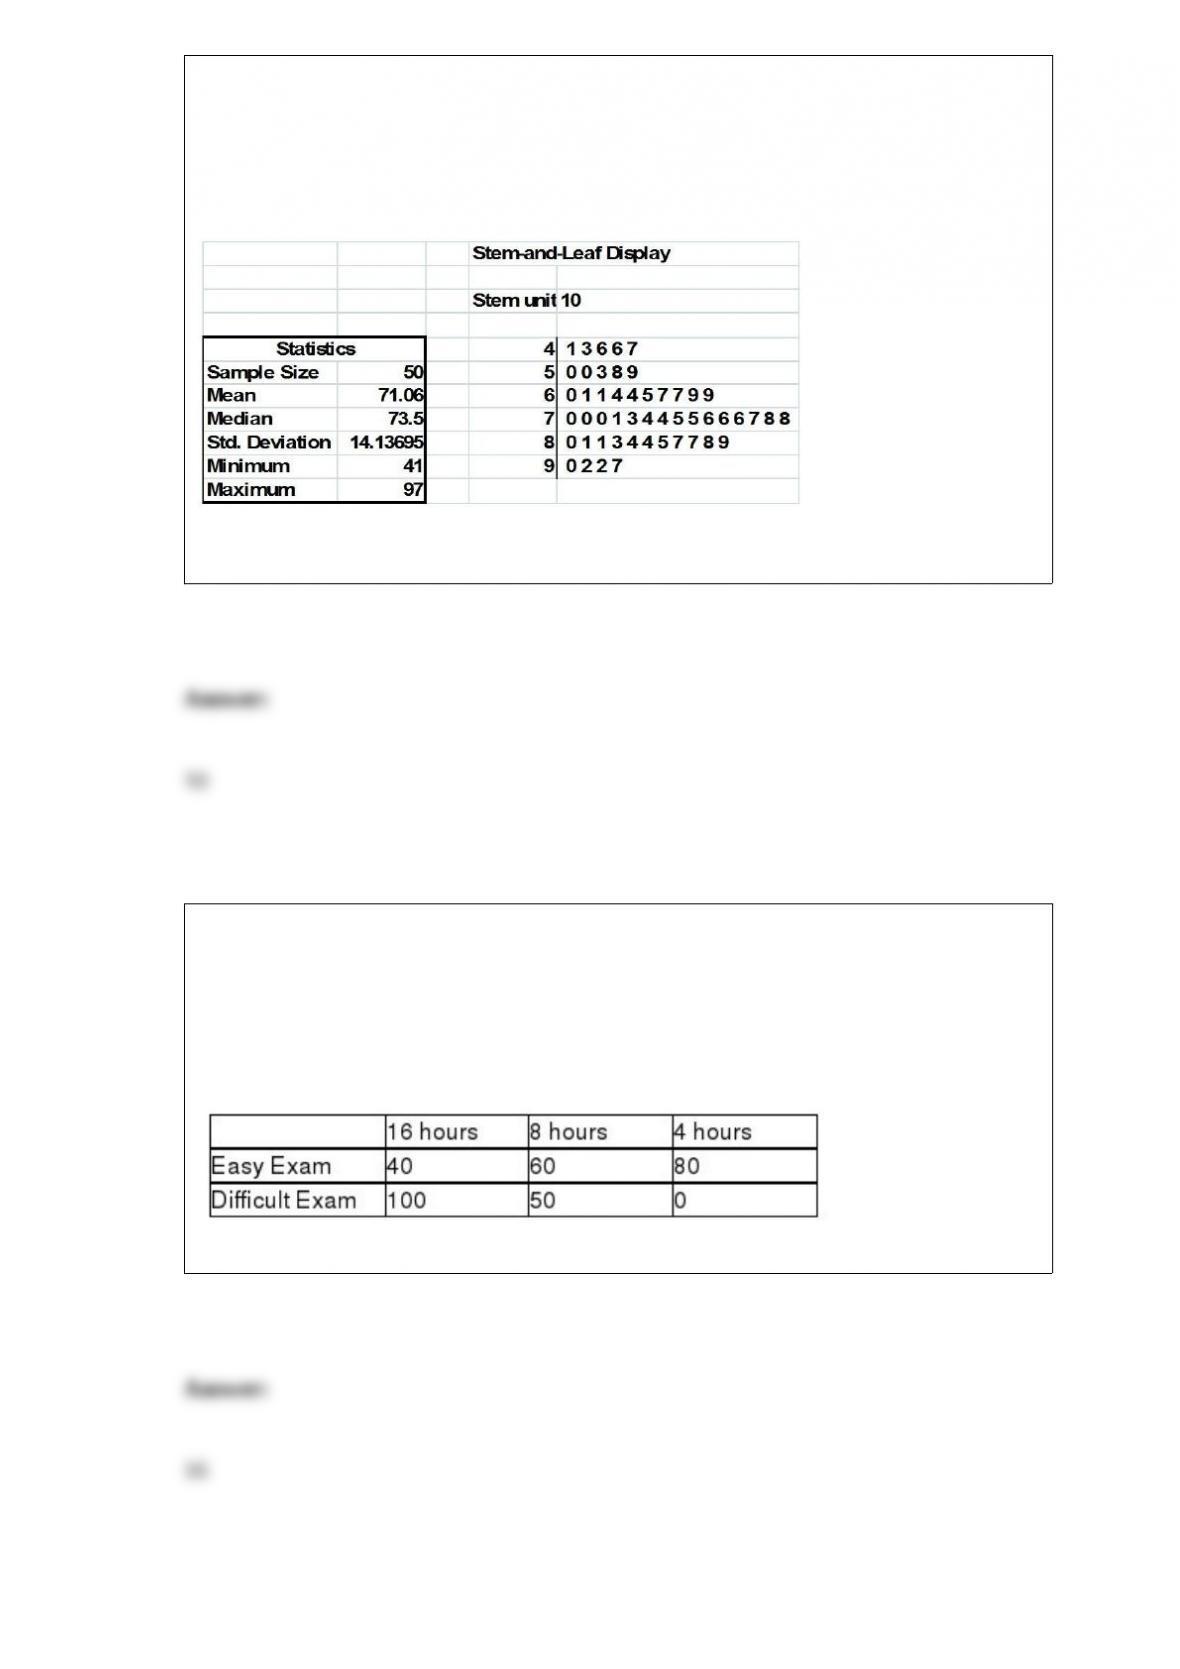
TABLE 2-18
The stem-and-leaf display below shows the result of a survey of 50 students on their
satisfaction with their school, with the higher scores representing a higher level of
satisfaction.
Referring to Table 2-18, how many students have a satisfaction level below 60?
TABLE 19-6
A student wanted to find out the optimal strategy to study for a Business Statistics
exam. He constructed the following payoff table based on the mean amount of time he
needed to study every week for the course and the degree of difficulty of the exam.
From the information that he gathered from students who had taken the course, he
concluded that there was a 40% probability that the exam would be easy.
Referring to Table 19-6, what is the expected value of perfect information?
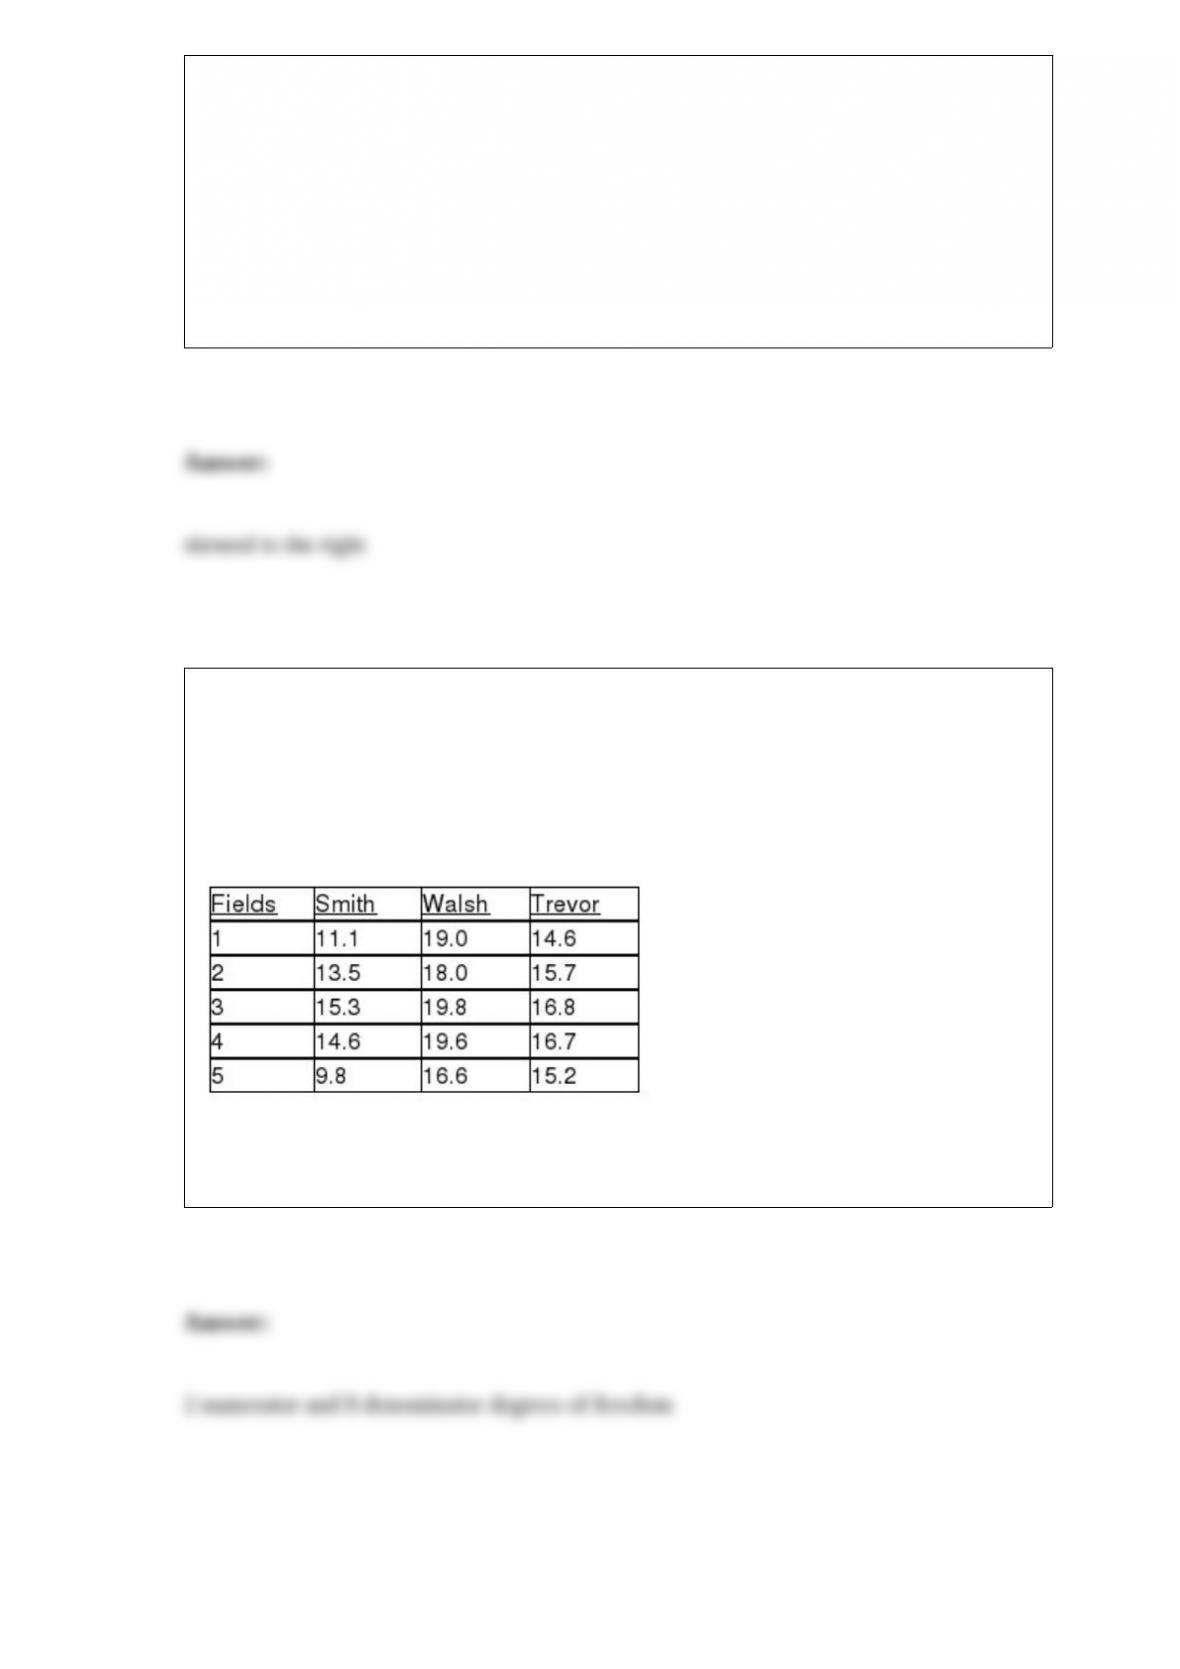
TABLE 3-7
In a recent academic year, many public universities in the United States raised tuition
and fees due to a decrease in state subsidies. The change in the cost of tuition, a shared
dormitory room, and the most popular meal plan from the previous academic year for a
sample of 10 public universities were as follows: $1,589, $593, $1,223, $869, $423,
$1,720, $708, $1,425, $922 and $308.
Referring to Table 3-7, are the data skewed? If so, how?
TABLE 11-10
An agronomist wants to compare the crop yield of 3 varieties of chickpea seeds. She
plants all 3 varieties of the seeds on each of 5 different patches of fields. She then
measures the crop yield in bushels per acre. Treating this as a randomized block design,
the results are presented in the table that follows.
Referring to Table 11-10, what are the degrees of freedom of the randomized block F
test for the difference in the means at a level of significance of 0.01?