
True or False: The number of customers arriving at a department store in a 5-minute
period has a Poisson distribution.
TABLE 14-17
Given below are results from the regression analysis where the
dependent variable is the number of weeks a worker is unemployed
due to a layo! (Unemploy) and the independent variables are the age
of the worker (Age) and a dummy variable for management position
(Manager: 1 = yes, 0 = no).
The results of the regression analysis are given below:
True or False: Referring to Table 14-17, the alternative hypothesis H1 :
At least one of βj ≠0 for j = 1, 2 implies that the number of weeks
a worker is unemployed due to a layo! is related to at least one of
the explanatory variables.
TABLE 9-5
A bank tests the null hypothesis that the mean age of the bank’s mortgage holders is less
than or equal to 45 years, versus an alternative that the mean age is greater than 45
years. They take a sample and calculate a p-value of 0.0202.
True or False: Referring to Table 9-5, the bank can conclude that the mean age is
greater than 45 at a significance level of = 0.01.
True or False: A simple price index tracks the price of a group of commodities at a
given period of time to the price paid for that group of commodities at a particular point
of time in the past.
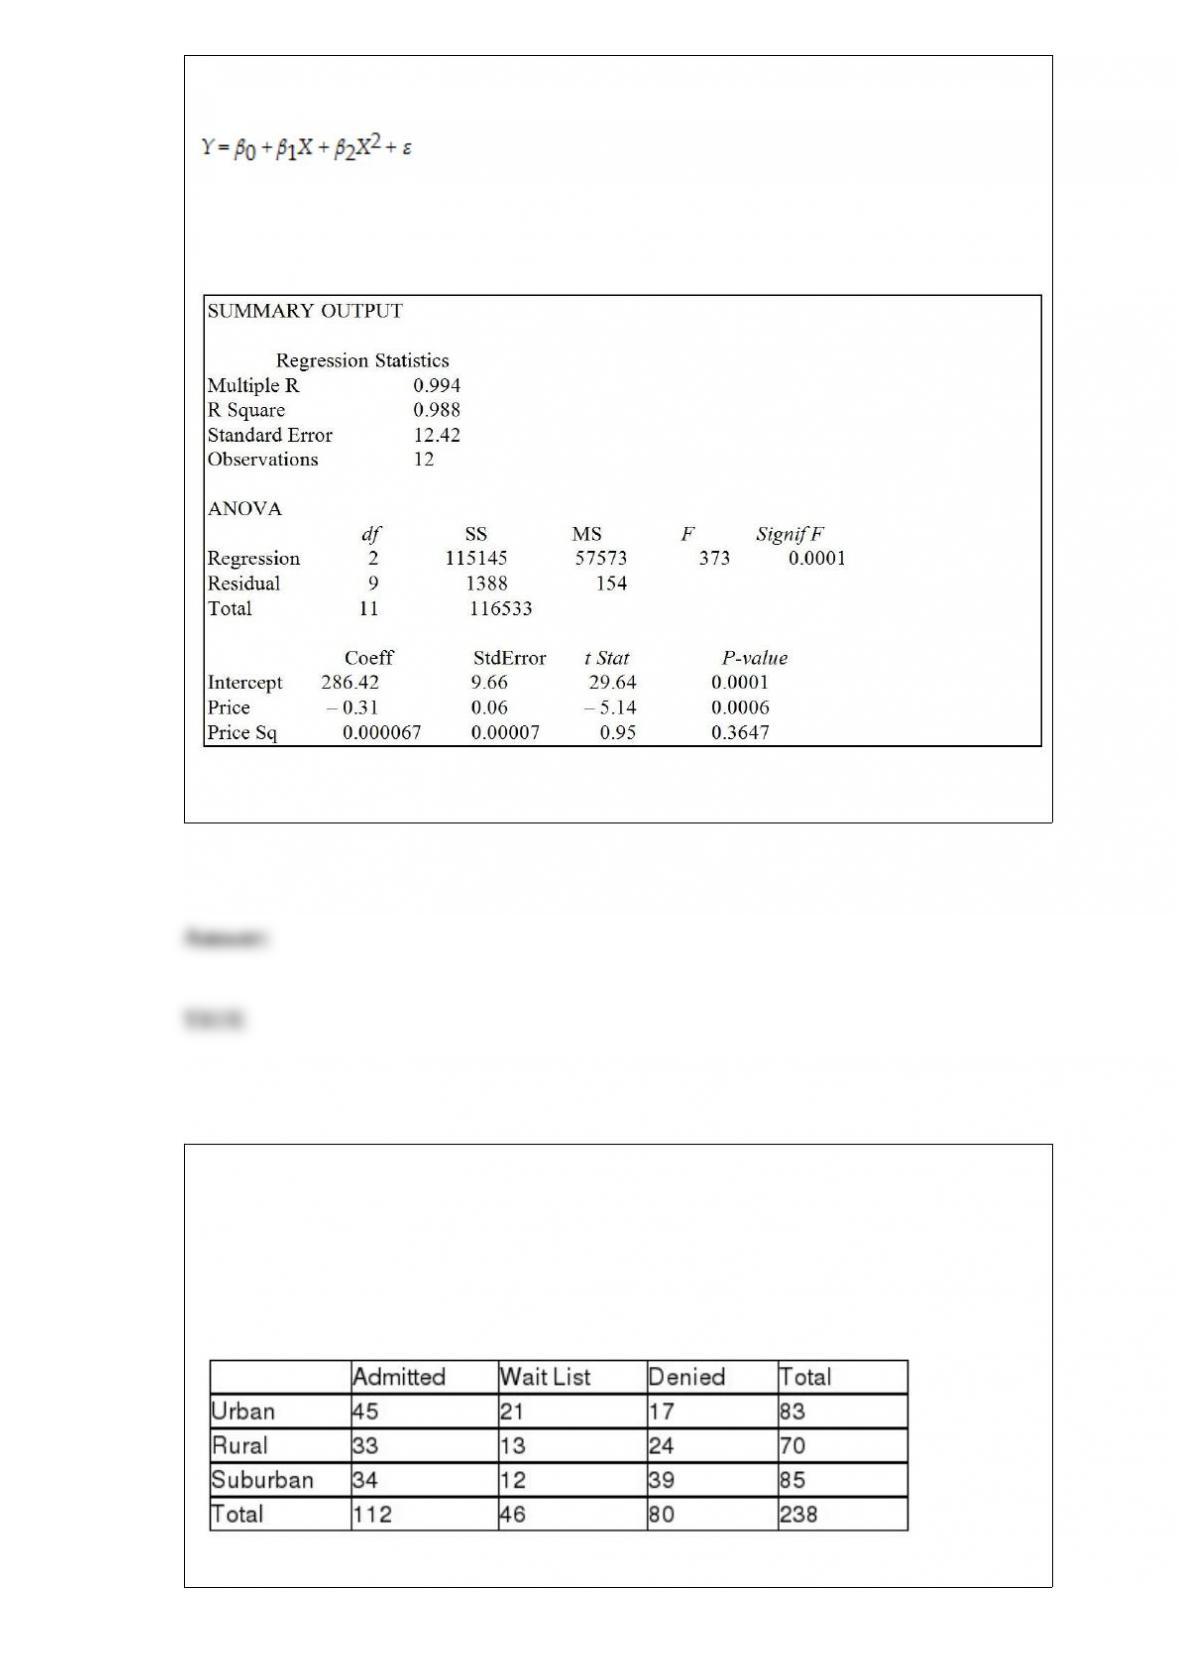
TABLE 15-1
A certain type of rare gem serves as a status symbol for many of its owners. In theory,
for low prices, the demand increases and it decreases as the price of the gem increases.
However, experts hypothesize that when the gem is valued at very high prices, the
demand increases with price due to the status owners believe they gain in obtaining the
gem. Thus, the model proposed to best explain the demand for the gem by its price is
the quadratic model:
where Y = demand (in thousands) and X = retail price per carat.
This model was fit to data collected for a sample of 12 rare gems of this type. A portion
of the computer analysis obtained from Microsoft Excel is shown below:
True or False: Referring to Table 15-1, a more parsimonious simple linear model is
likely to be statistically superior to the fitted curvilinear for predicting sale price (Y).
TABLE 12-11
The director of admissions at a state college is interested in seeing if admissions status
(admitted, waiting list, denied admission) at his college is independent of the type of
community in which an applicant resides. He takes a sample of recent admissions
decisions and forms the following table:
He will use this table to do a chi-square test of independence with a level of
significance of 0.01.
True or False: Referring to Table 12-11, the p-value of this test is greater than 0.01.
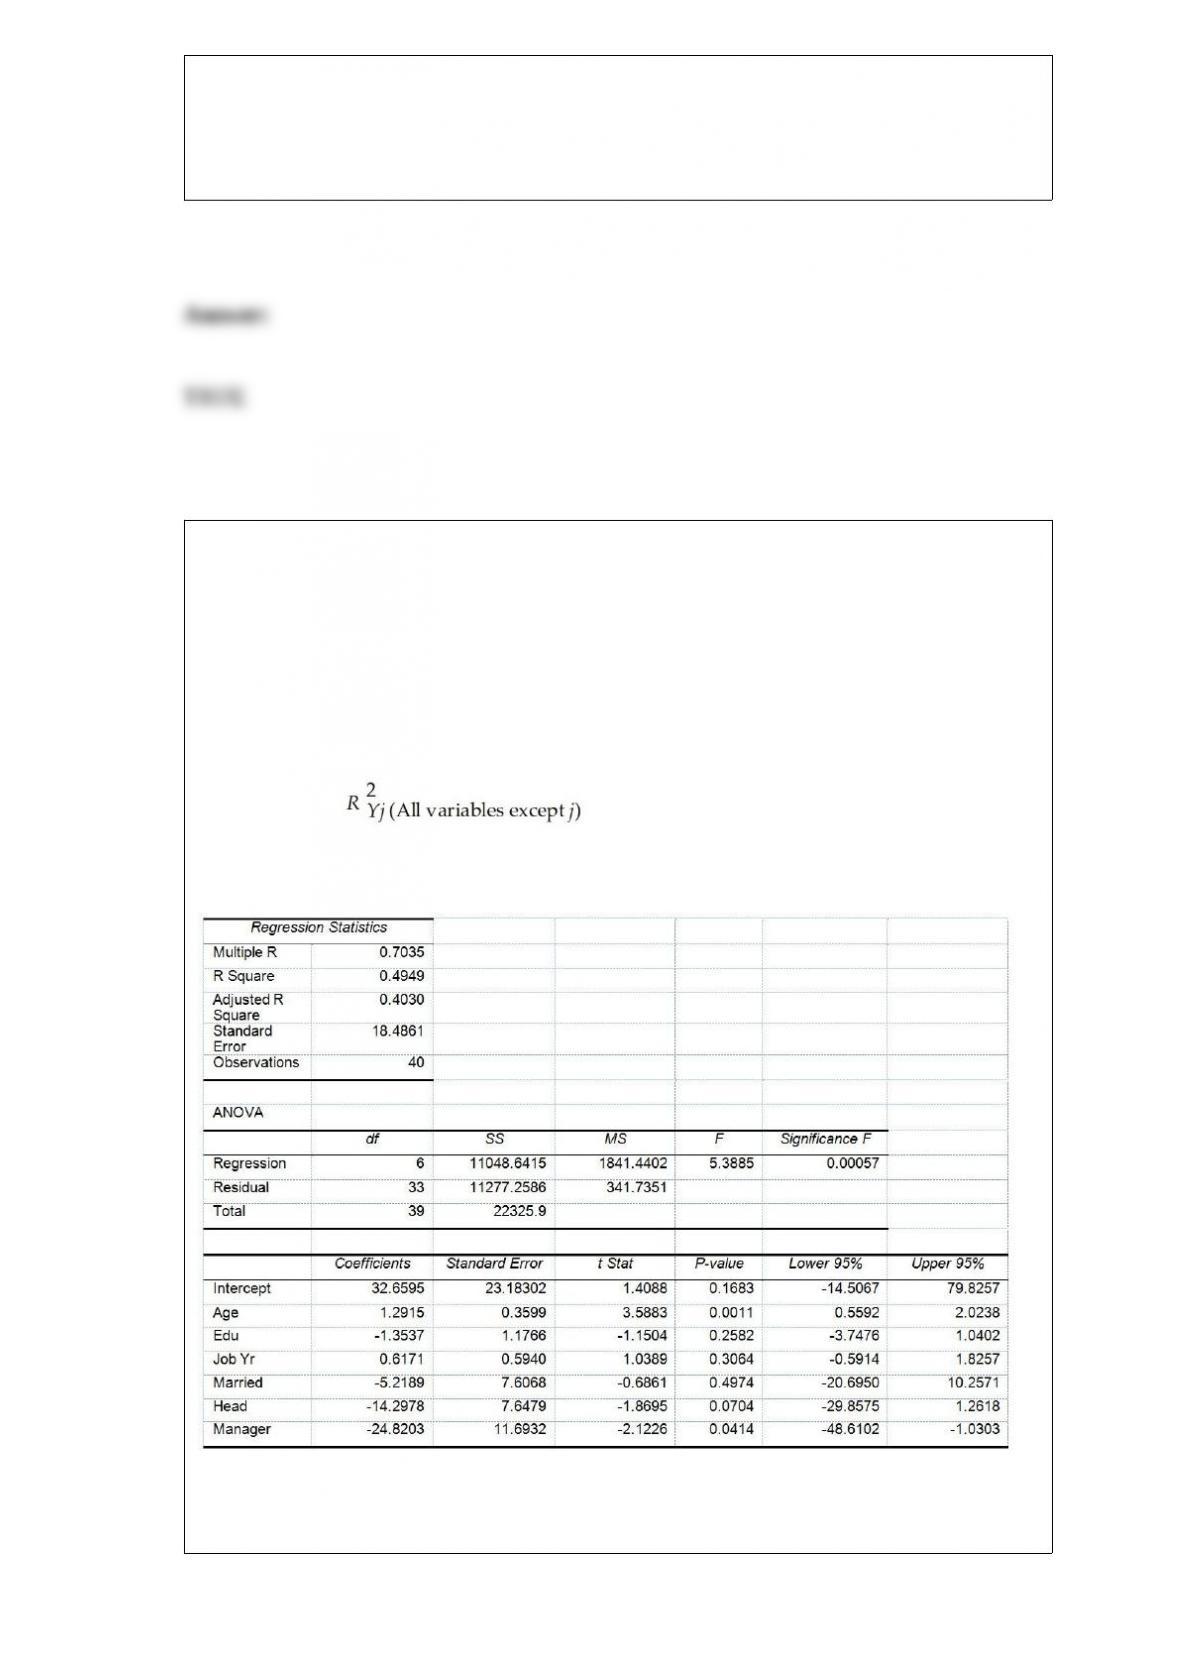
True or False: TABLE 17-10
Given below are results from the regression analysis where the dependent variable is
the number of weeks a worker is unemployed due to a layoff (Unemploy) and the
independent variables are the age of the worker (Age), the number of years of education
received (Edu), the number of years at the previous job (Job Yr), a dummy variable for
marital status (Married: 1 = married, 0 = otherwise), a dummy variable for head of
household (Head: 1 = yes, 0 = no) and a dummy variable for management position
(Manager: 1 = yes, 0 = no). We shall call this Model 1. The coefficient of partial
determination ( ) of each of the 6 predictors are, respectively,
0.2807, 0.0386, 0.0317, 0.0141, 0.0958, and 0.1201.
Model 2 is the regression analysis where the dependent variable is Unemploy and the
independent variables are Age and Manager. The results of the regression analysis are
given below:
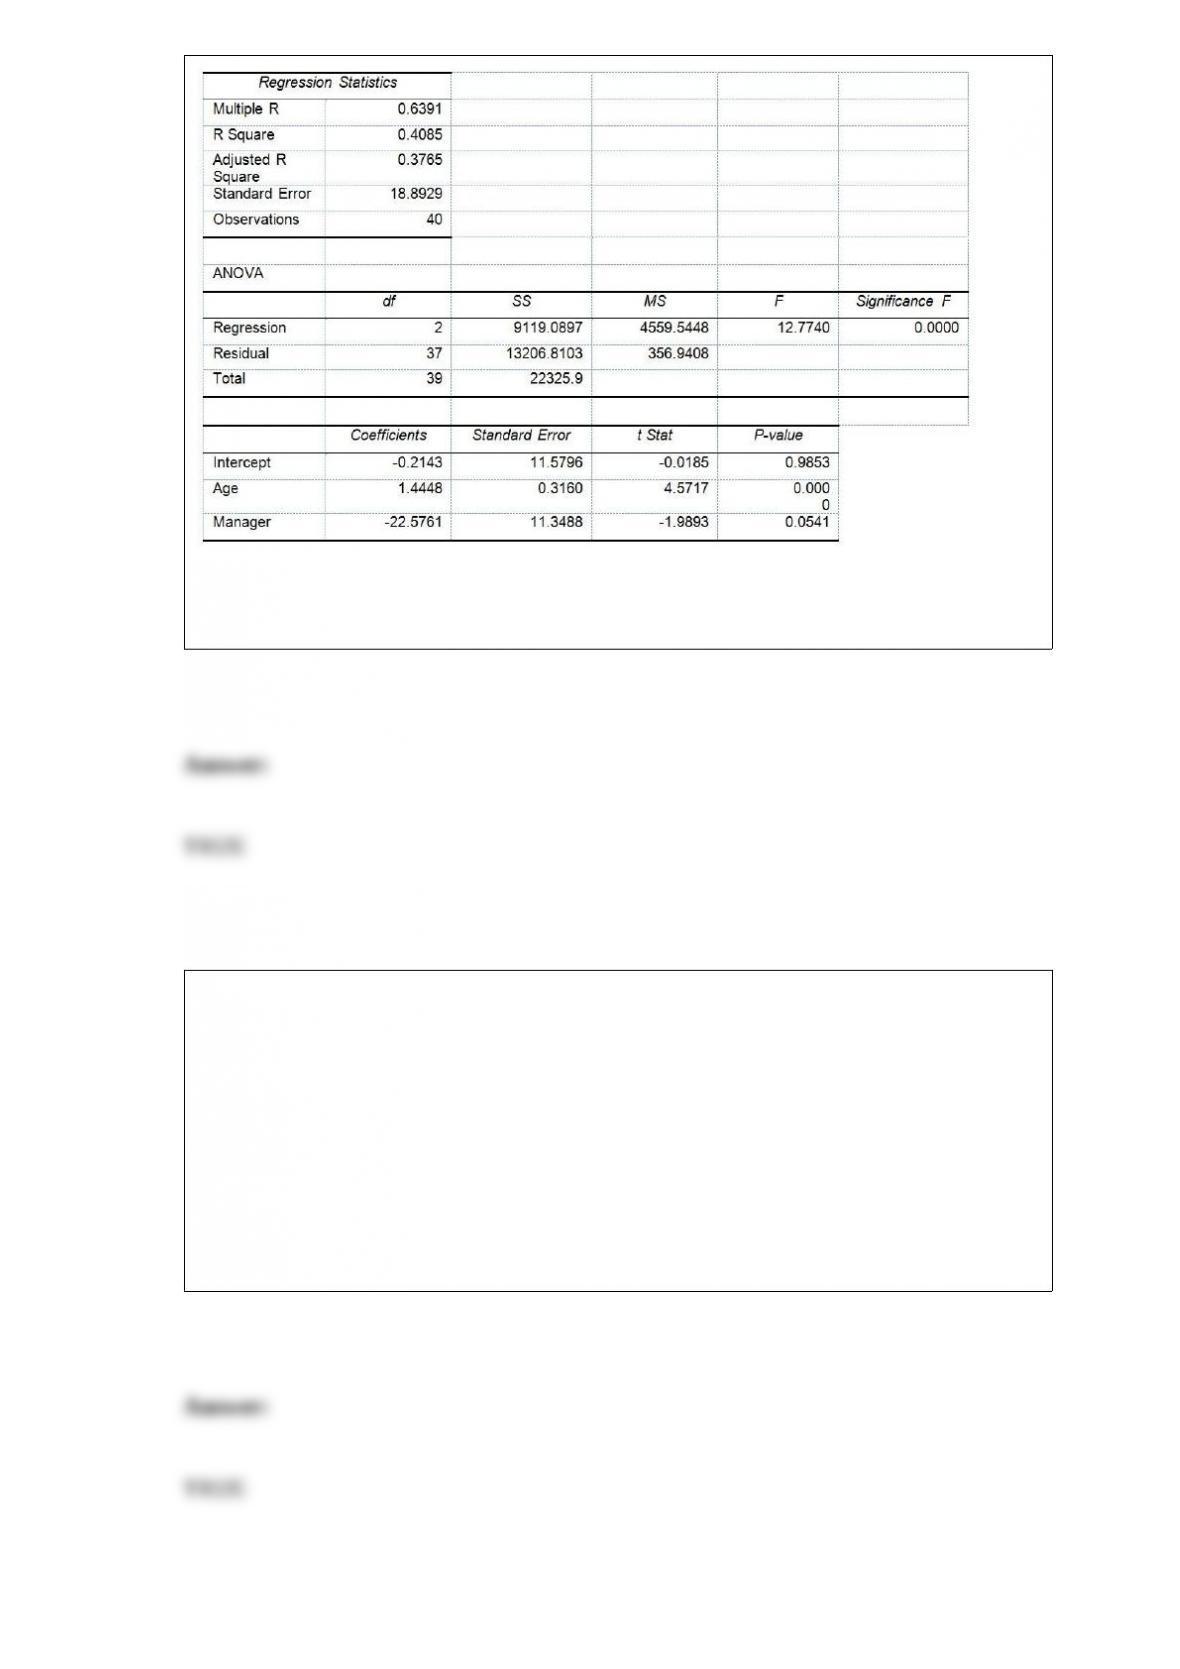
Referring to Table 17-10, Model 1, there is sufficient evidence that age has an effect on
the number of weeks a worker is unemployed due to a layoff while holding constant the
effect of all the other independent variables at a 10% level of significance.
TABLE 12-20
A filling machine at a local soft drinks company is calibrated to fill the cans at a mean
amount of 12 fluid ounces and a standard deviation of 0.5 ounces. The company wants
to test whether the standard deviation of the amount filled by the machine is 0.5 ounces.
A random sample of 15 cans filled by the machine reveals a standard deviation of 0.67
ounces.
True or False: Referring to Table 12-20, the p-value of the test is somewhere between
5% and 10%.
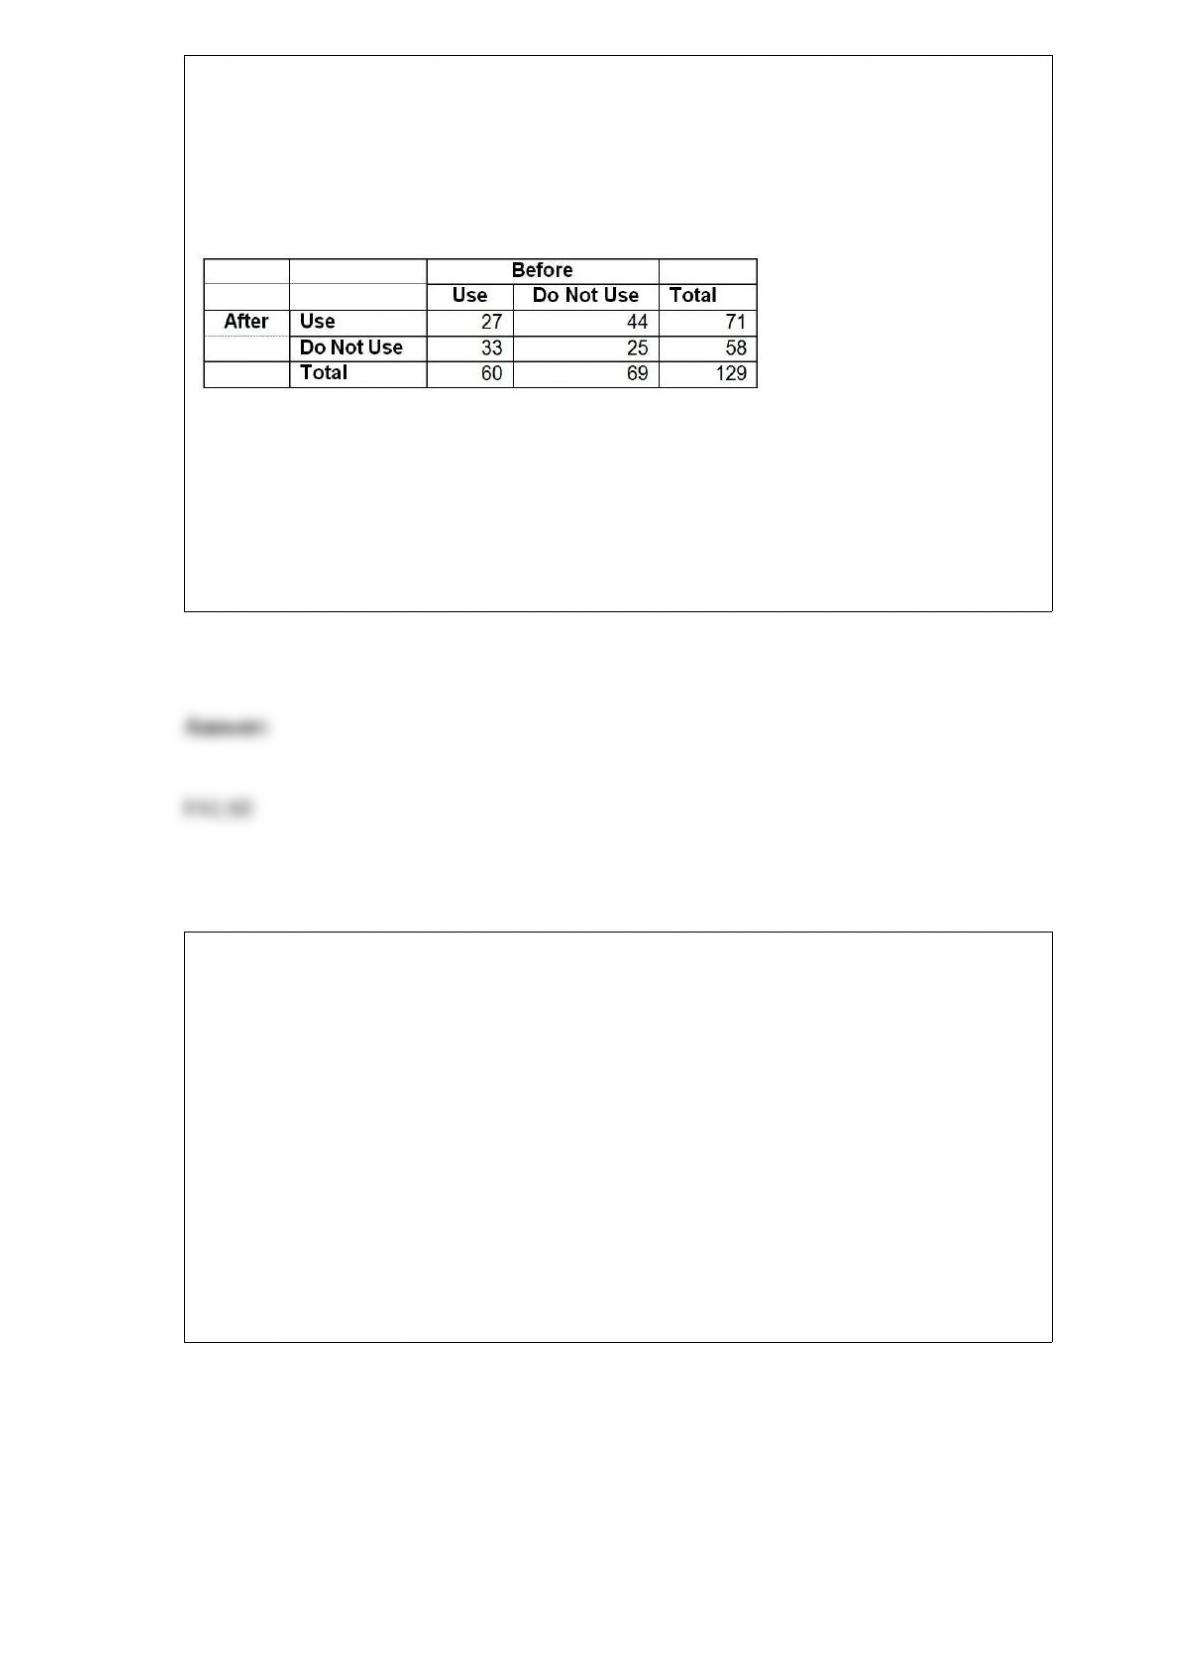
TABLE 12-18
The director of transportation of a large company is interested in the usage of the
company’s van pool program. She surveyed 129 of her employees on the usage of the
program before and after a campaign to convince her employees to use the service and
obtained the following:
She will use this information to perform a test using a level of significance of 0.05.
True or False: Referring to Table 12-18, the director now wants to know if the
proportion of employees who use the service before the campaign and the proportion of
employees who use the service after the campaign are the same. She should reject the
null hypothesis using a 5% level of significance.
True or False: TABLE 17-12
The marketing manager for a nationally franchised lawn service company would like to
study the characteristics that differentiate home owners who do and do not have a lawn
service. A random sample of 30 home owners located in a suburban area near a large
city was selected; 15 did not have a lawn service (code 0) and 15 had a lawn service
(code 1). Additional information available concerning these 30 home owners includes
family income (Income, in thousands of dollars), lawn size (Lawn Size, in thousands of
square feet), attitude toward outdoor recreational activities (Attitude 0 = unfavorable, 1
= favorable), number of teenagers in the household (Teenager), and age of the head of
the household (Age).
The Minitab output is given below:
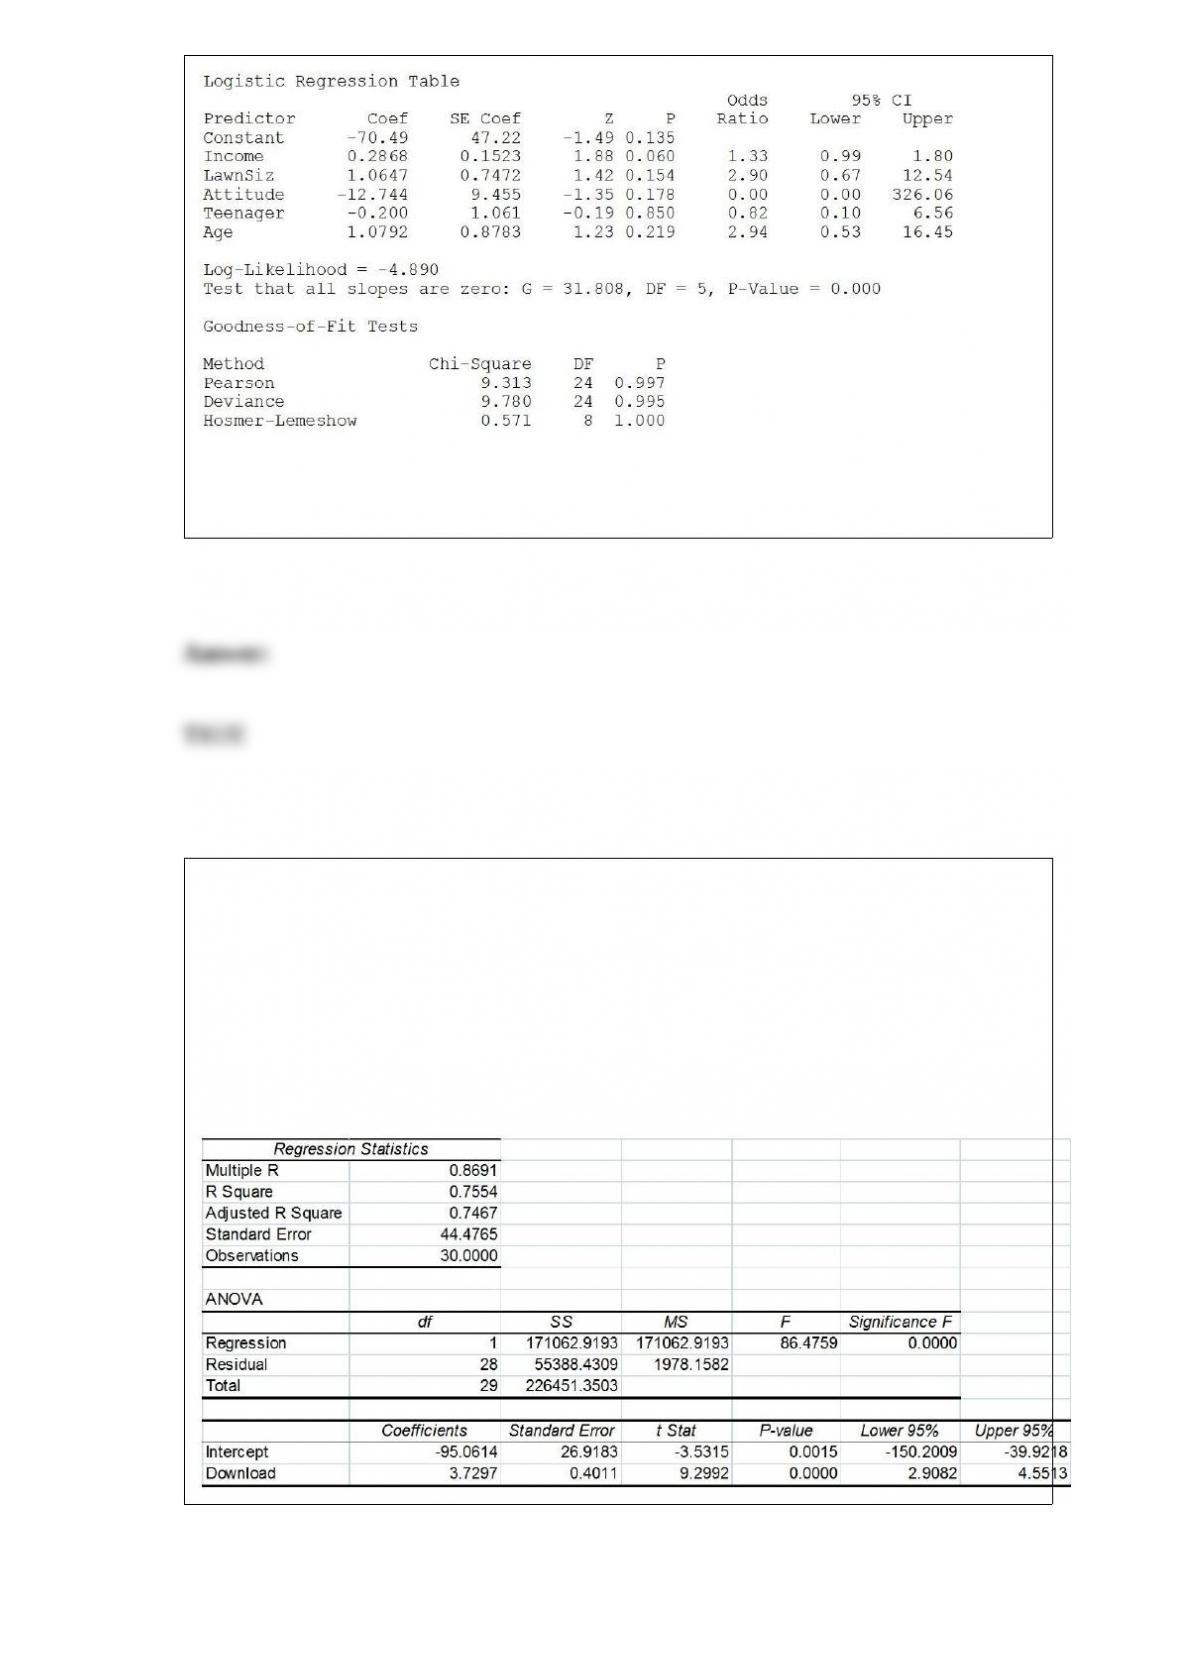
Referring to Table 17-12, there is not enough evidence to conclude that the model is not
a good-fitting model at a 0.05 level of significance.
TABLE 13-11
A computer software developer would like to use the number of downloads (in
thousands) for the trial version of his new shareware to predict the amount of revenue
(in thousands of dollars) he can make on the full version of the new shareware.
Following is the output from a simple linear regression along with the residual plot and
normal probability plot obtained from a data set of 30 different sharewares that he has
developed:
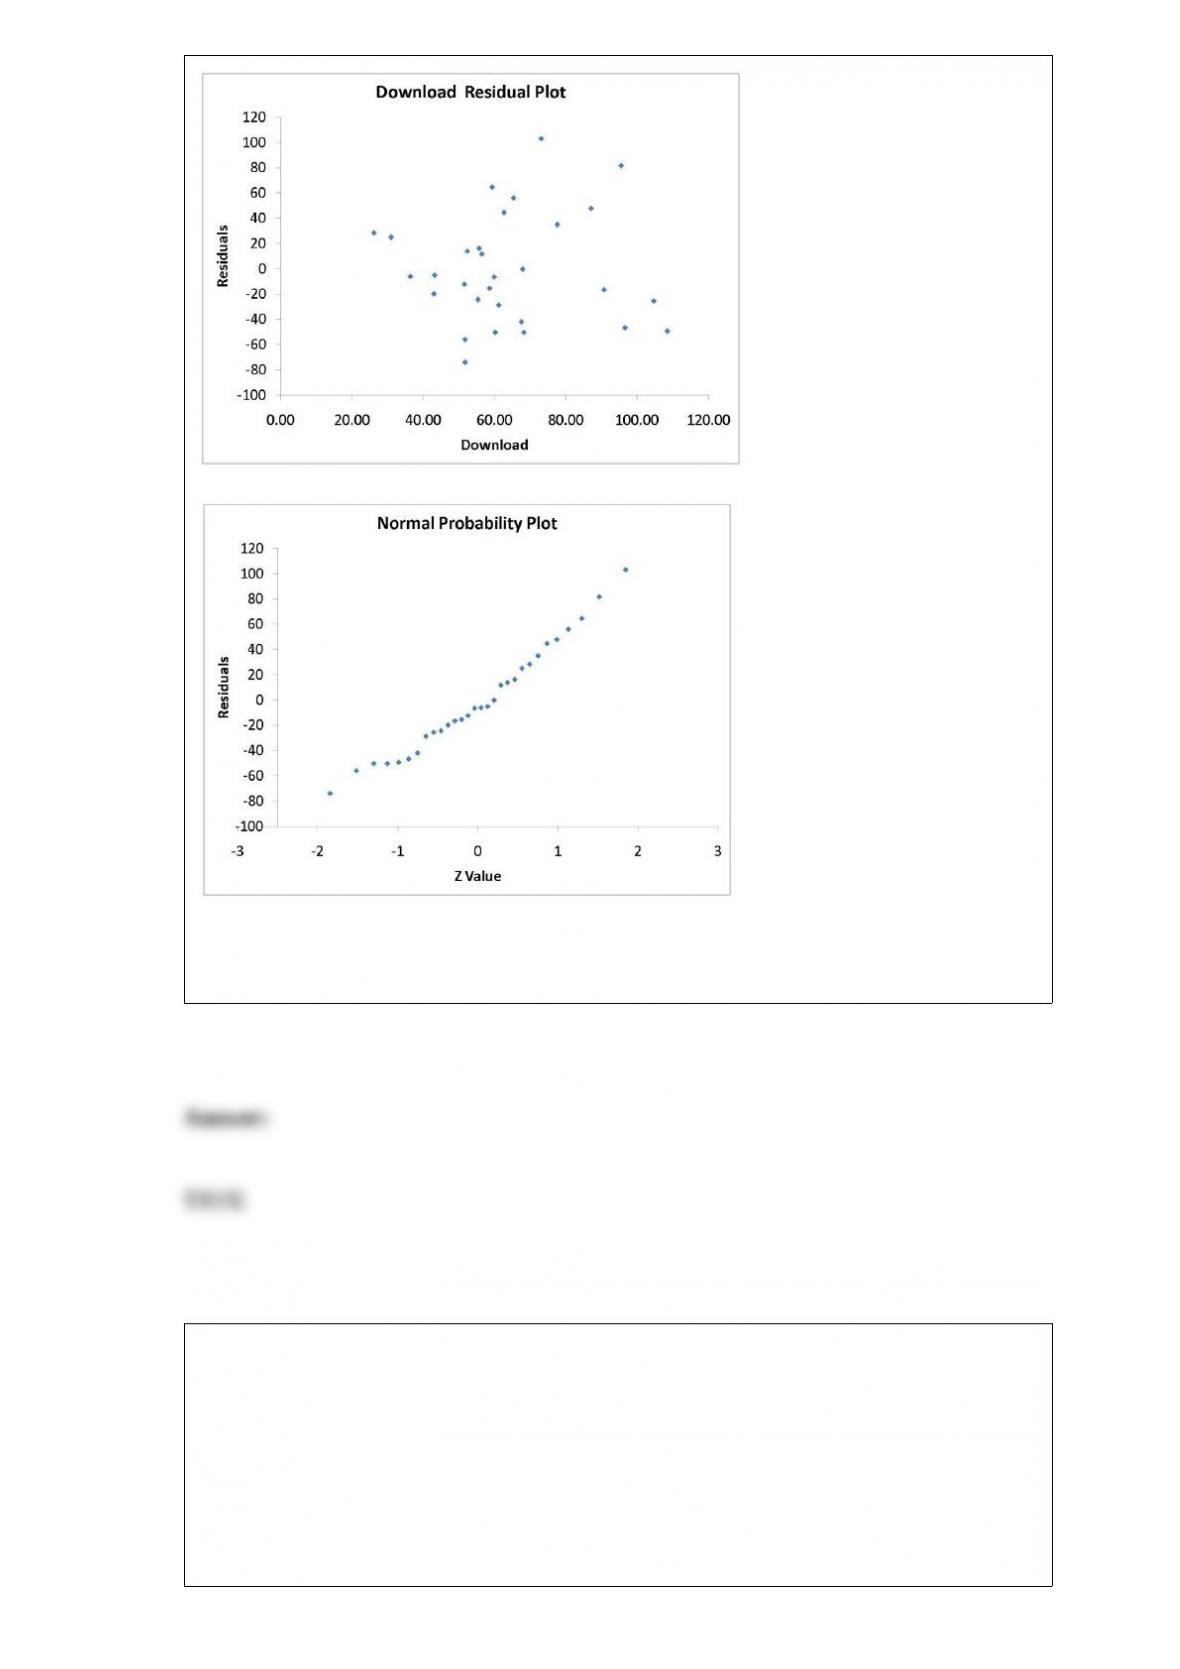
True or False: Referring to Table 13-11, there is sufficient evidence that revenue and the
number of downloads are linearly related at a 5% level of significance.
TABLE 3-4
The ordered array below represents the number of cargo manifests approved by customs
inspectors of the Port of New York in a sample of 35 days:
16, 17, 18, 18, 19, 20, 20, 21, 21, 21, 22, 22, 22, 22, 23, 23, 23, 23, 24, 24, 24, 25, 25,
26, 26, 26, 27, 28, 28, 29, 29, 31, 31, 32, 32
Note: For this sample, the sum of the values is 838, and the sum of the squared
differences between each value and the mean is 619.89.
Referring to Table 3-4, the variance of the customs data is ________.
The oranges grown in corporate farms in an agricultural state were damaged by some
unknown fungi a few years ago. Suppose the manager of a large farm wanted to study
the impact of the fungi on the orange crops on a daily basis over a 6-week period. On
each day a random sample of orange trees was selected from within a random sample of
acres. The daily average number of damaged oranges per tree and the proportion of
trees having damaged oranges were calculated. The two main measures calculated each
day (i.e., average number of damaged oranges per tree and proportion of trees having
damaged oranges) are called ________.
TABLE 4-10
Are whites more likely to claim bias? It was found that 60% of the workers were white,
30% were black and 10% are other races. Given that a worker was white, the
probability that the worker had claimed bias was 30%. Given that a worker was black,
the probability that the worker had claimed bias was 40%. Given that a worker was
other race, the probability that the worker had claimed bias was 0%.
Referring to Table 4-10, what is the probability that a randomly selected worker is black
and had not claimed bias or is white and has claimed bias?
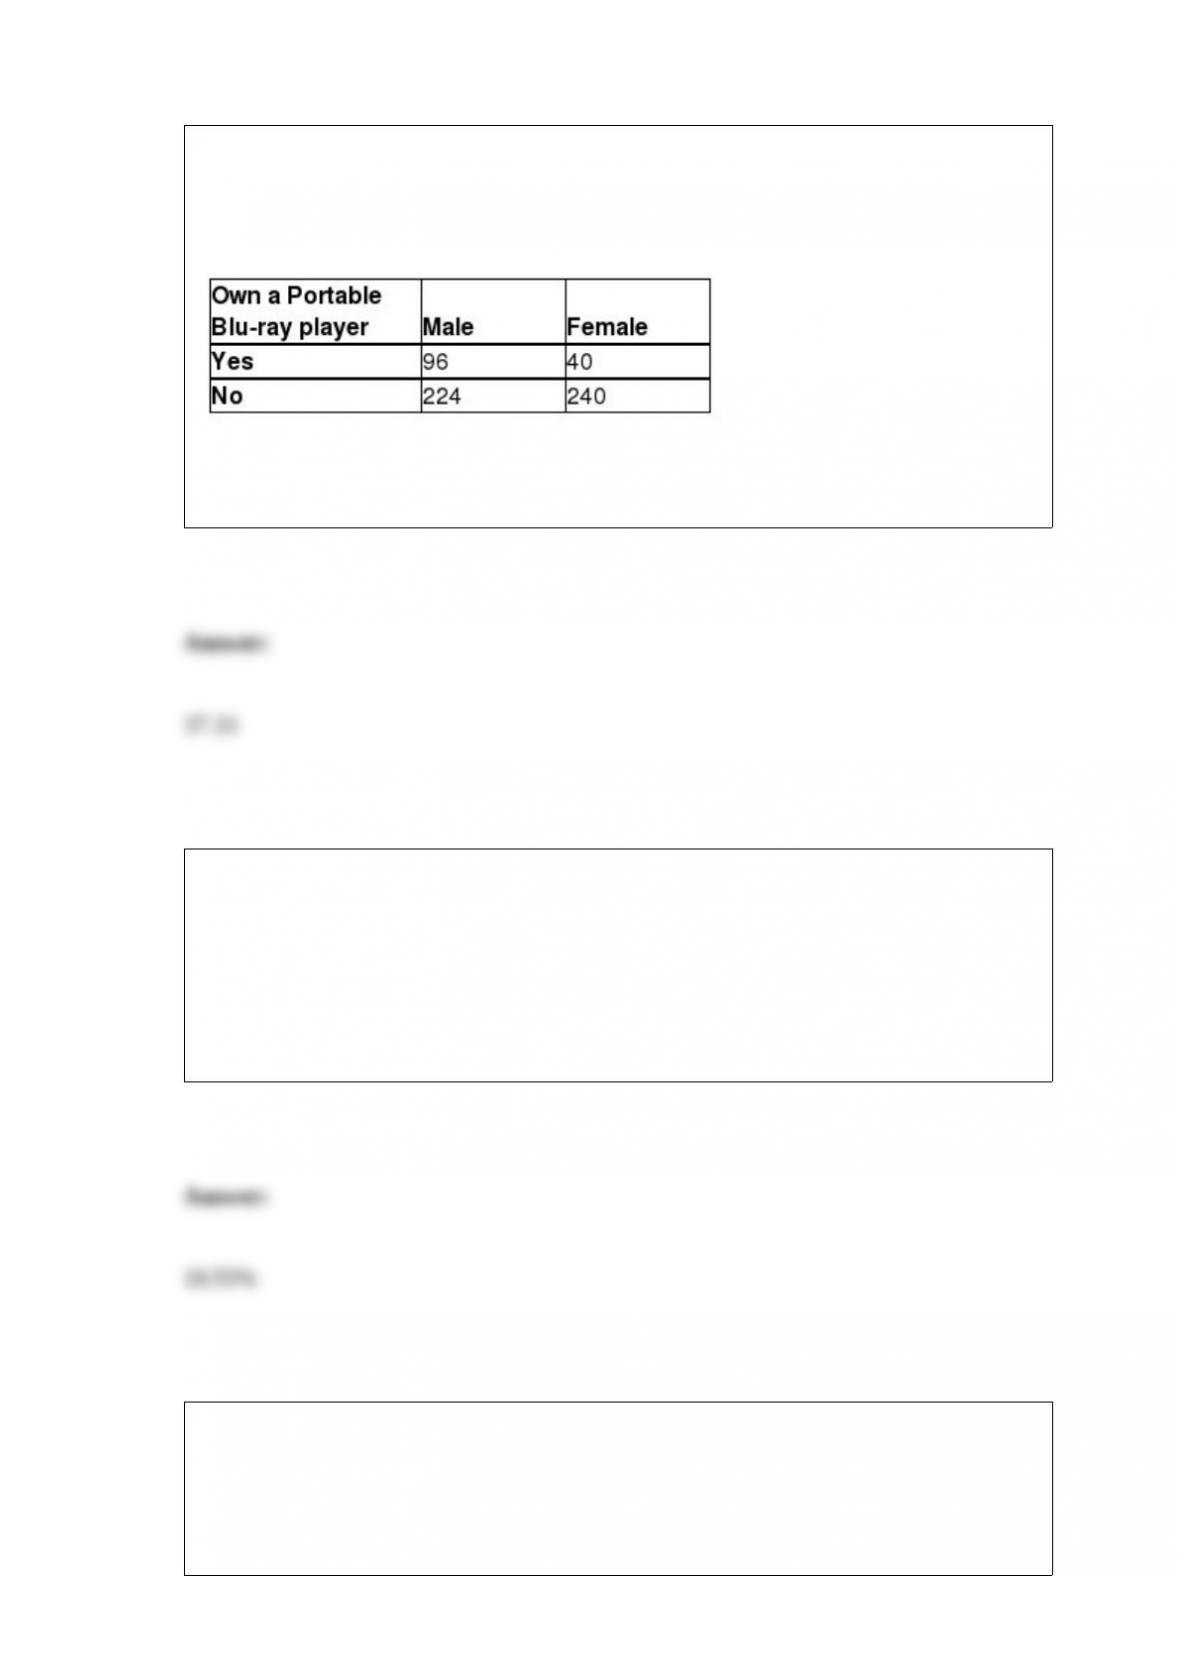
TABLE 2-14
The table below contains the number of people who own a portable Blu-ray player in a
sample of 600 broken down by gender.
Referring to Table 2-14, ________ percent of the 600 were males who did not own a
portable Blu-ray player.
TABLE 3-5
The rate of return of a Fortune 500 company over the past 15 years are: 3.17%, 4.43%,
5.93%, 5.43%, 7.29%, 8.21%, 6.23%, 5.23%, 4.34%, 6.68%, 7.14%, -5.56%, -5.23%,
-5.73%, -10.34%.
Referring to Table 3-5, what is the range of the rate of return?
TABLE 18-7
A supplier of silicone sheets for producers of computer chips wants to evaluate her
manufacturing process. She takes sample sizes of 5 from each day’s output and counts
the number of blemishes on each silicone sheet. The results from 20 days of such
evaluations are presented below.
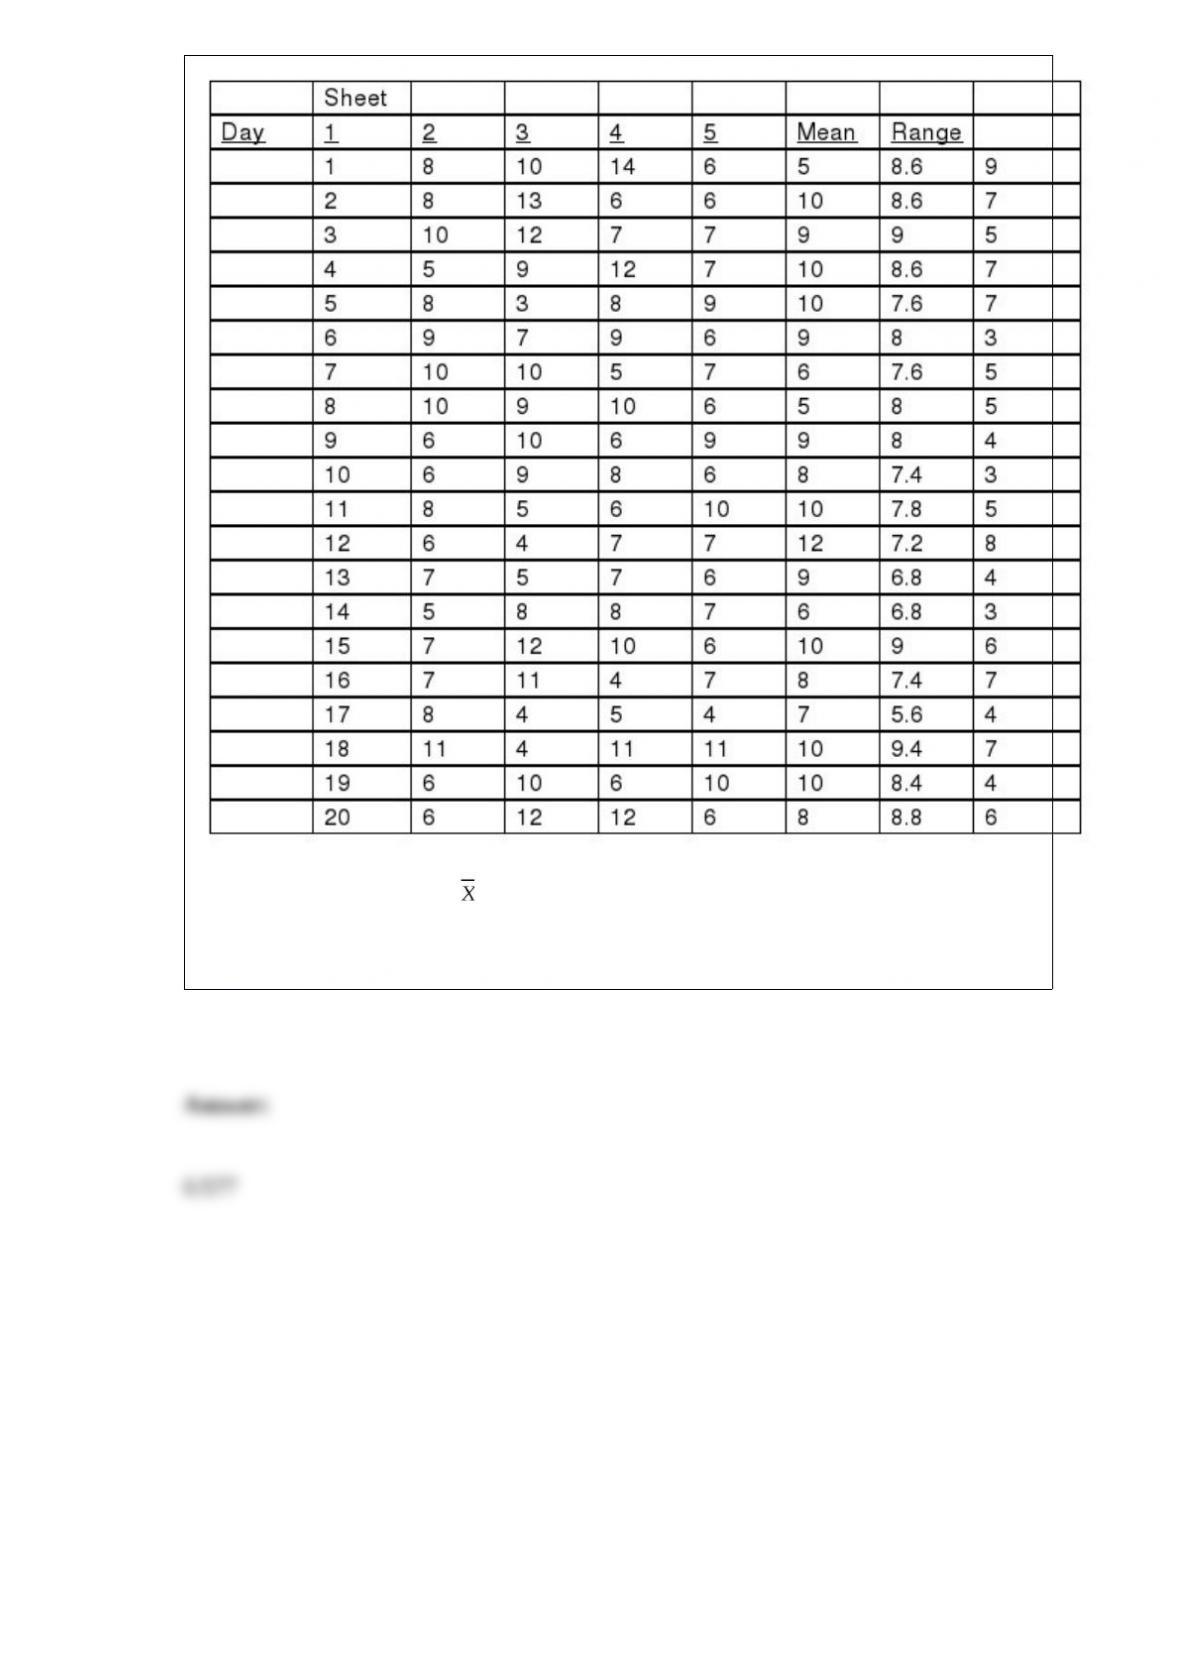
She also decides that the upper specification limit is 10 blemishes.
Referring to Table 18-7, an chart is to be used for the number of blemishes. One way
to obtain the control limits is to take the grand mean and add and subtract the product of
A2 times the mean of the sample ranges. For this data set, the value of A2 is ________.