TABLE 12-3
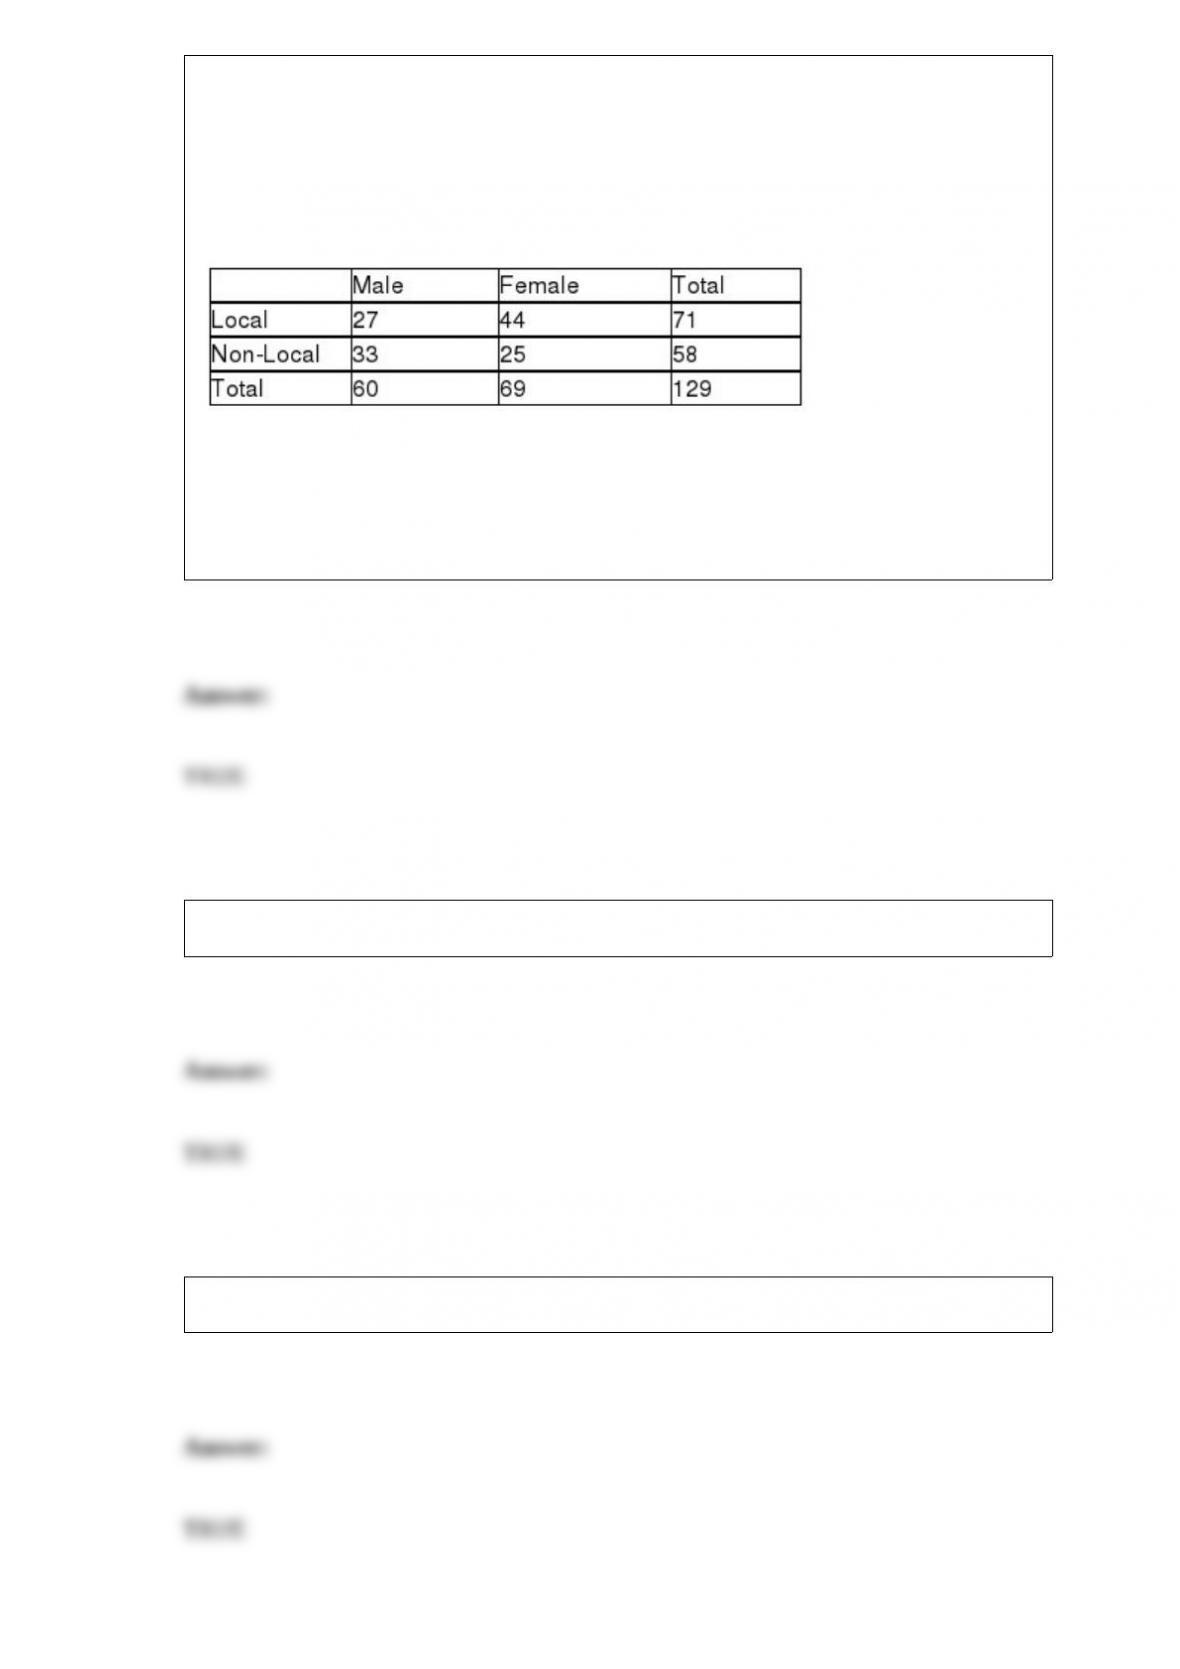
The director of transportation of a large company is interested in the usage of her van
pool. She considers her routes to be divided into local and non-local. She is particularly
interested in learning if there is a difference in the proportion of males and females who
use the local routes. She takes a sample of a day’s riders and finds the following:
She will use this information to perform a chi-square hypothesis test using a level of
significance of 0.05.
True or False: Referring to Table 12-3, the null hypothesis will be rejected.
True or False: If either A or B must occur they are called collectively exhaustive.
True or False: The sum of relative frequencies in a distribution always equals 1.
True or False: The only way one can eliminate sampling error is to take the whole
population as the sample.
True or False: To determine the probability of getting no more than 3 events of interest
in a binomial distribution, you will find the area under the normal curve for X = 2.5 and
below.
TABLE 9-6
The quality control engineer for a furniture manufacturer is interested in the mean
amount of force necessary to produce cracks in stressed oak furniture. She performs a
two-tail test of the null hypothesis that the mean for the stressed oak furniture is 650.
The calculated value of the Z test statistic is a positive number that leads to a p-value of
0.080 for the test.
True or False: Referring to Table 9-6, if the test is performed with a level of
significance of 0.05, the null hypothesis would be rejected.
When studying the simultaneous responses to two categorical questions, you should set
up a
A) contingency table
B) frequency distribution table
C) cumulative percentage distribution table
D) histogram
For air travelers, one of the biggest complaints is of the waiting time between when the
airplane taxis away from the terminal until the flight takes off. This waiting time is
known to have a right skewed distribution with a mean of 10 minutes and a standard
deviation of 8 minutes. Suppose 100 flights have been randomly sampled. Describe the
sampling distribution of the mean waiting time between when the airplane taxis away
from the terminal until the flight takes off for these 100 flights.
A) Distribution is right skewed with mean = 10 minutes and standard error = 0.8
minutes.
B) Distribution is right skewed with mean = 10 minutes and standard error = 8 minutes.
C) Distribution is approximately normal with mean = 10 minutes and standard error =
0.8 minutes.
D) Distribution is approximately normal with mean = 10 minutes and standard error = 8
minutes.
The Variance Inflationary Factor (VIF) measures the
A) correlation of the X variables with the Y variable.
B) correlation of the X variables with each other.
C) contribution of each X variable with the Y variable after all other X variables are
included in the model.
D) standard deviation of the slope.
The width of a confidence interval estimate for a proportion will be
A) narrower for 99% confidence than for 95% confidence.
B) wider for a sample size of 100 than for a sample size of 50.
C) narrower for 90% confidence than for 95% confidence.
D) narrower when the sample proportion is 0.50 than when the sample proportion is
0.20.
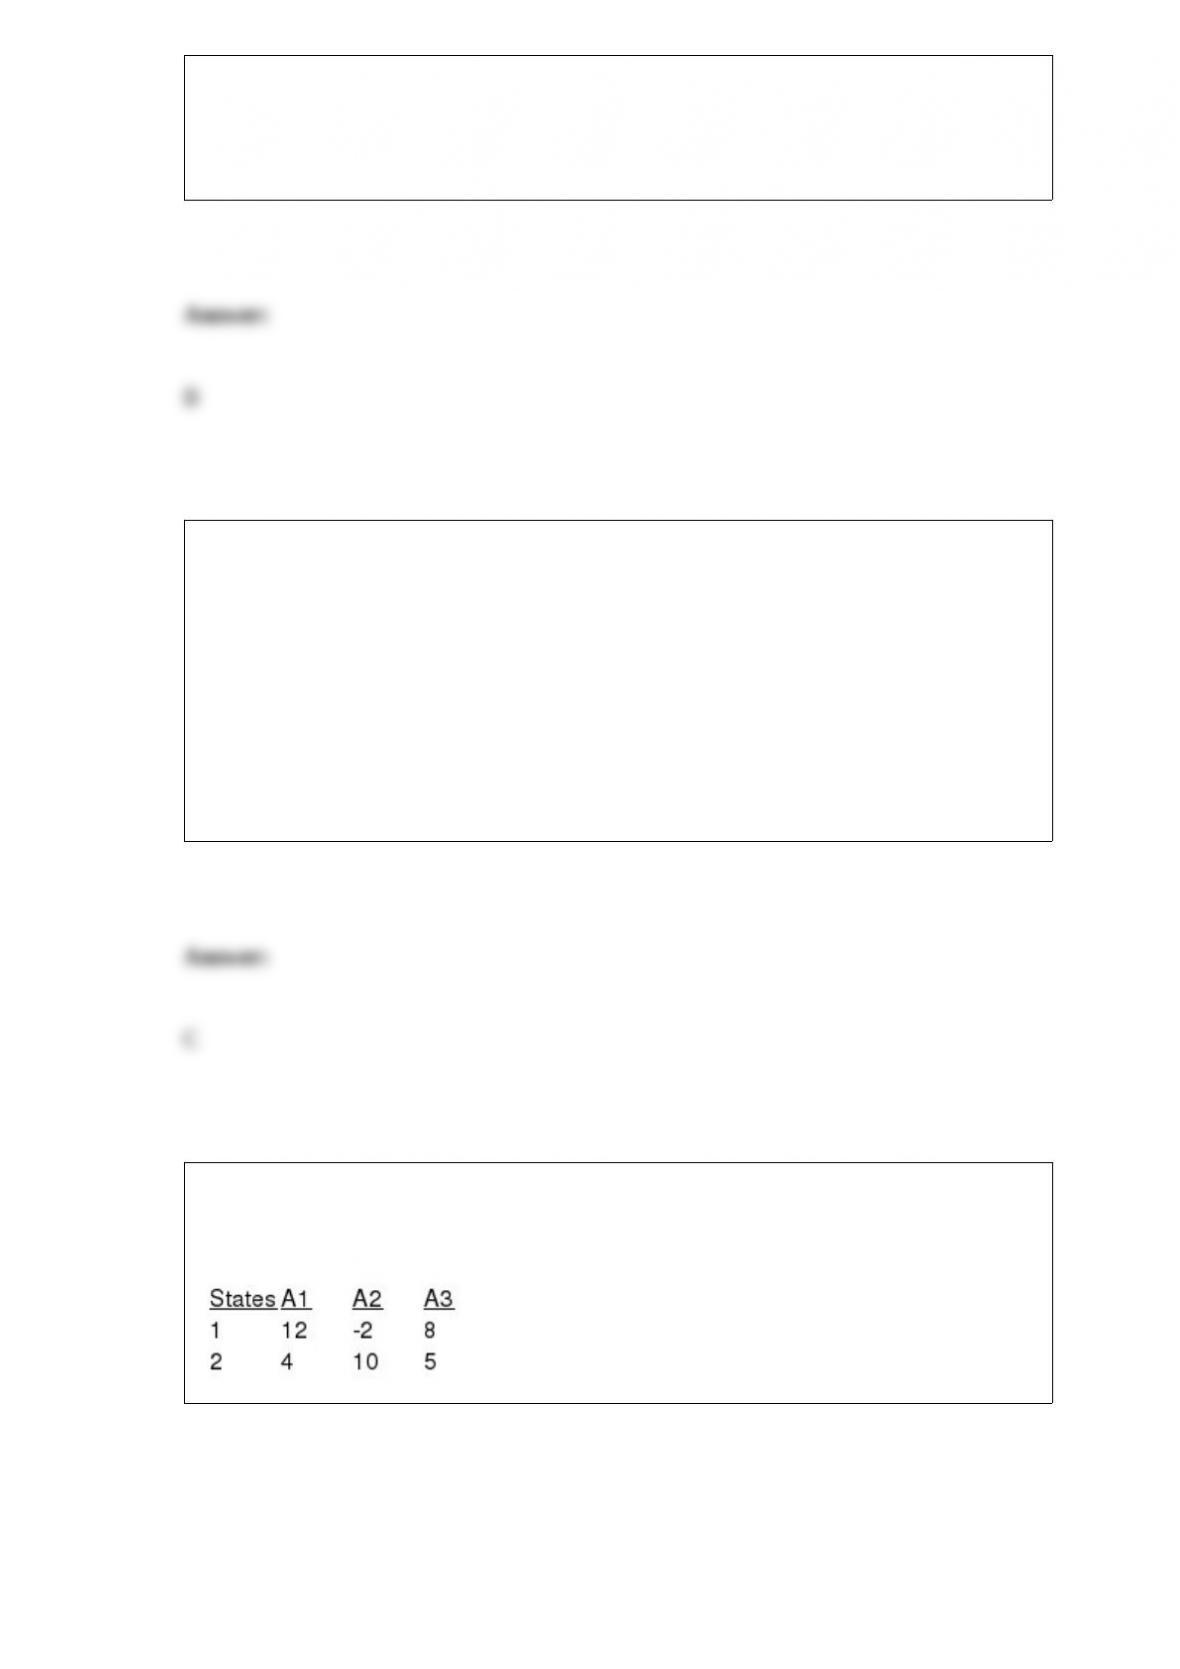
TABLE 19-1
The following payoff table shows profits associated with a set of 3 alternatives under 2
possible states of nature
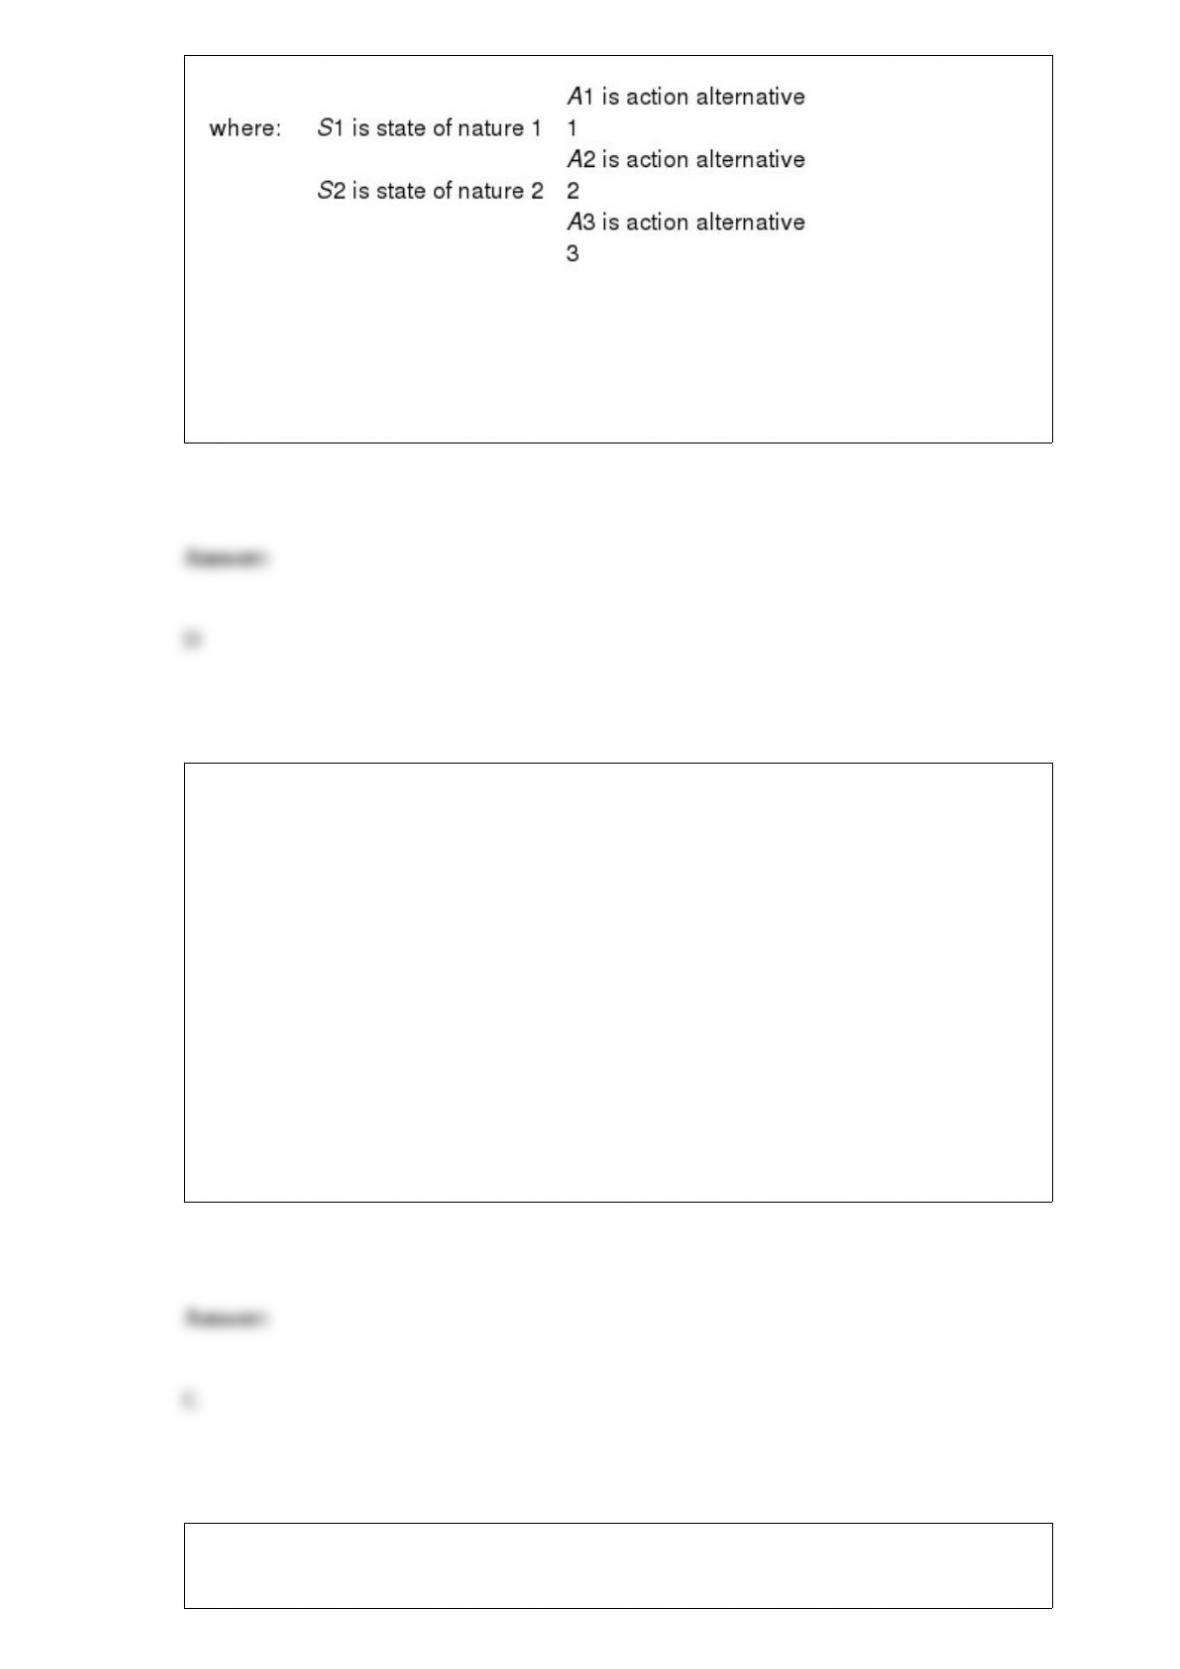
Referring to Table 19-1, the opportunity loss for A2 when S1 occurs is
A) -2.
B) 0.
C) 5.
D) 14.
TABLE 1-2
A Wall Street Journal poll asked 2,150 adults in the United States a series of questions
to find out their view on the U.S. economy.
Referring to Table 1-2, the population of interest is
A) all the males living in the United States when the poll was taken.
B) all the females living in the United States when the poll was taken.
C) all the adults living in the United States when the poll was taken.
D) all the people living in the United States when the poll was taken.
TABLE 12-13
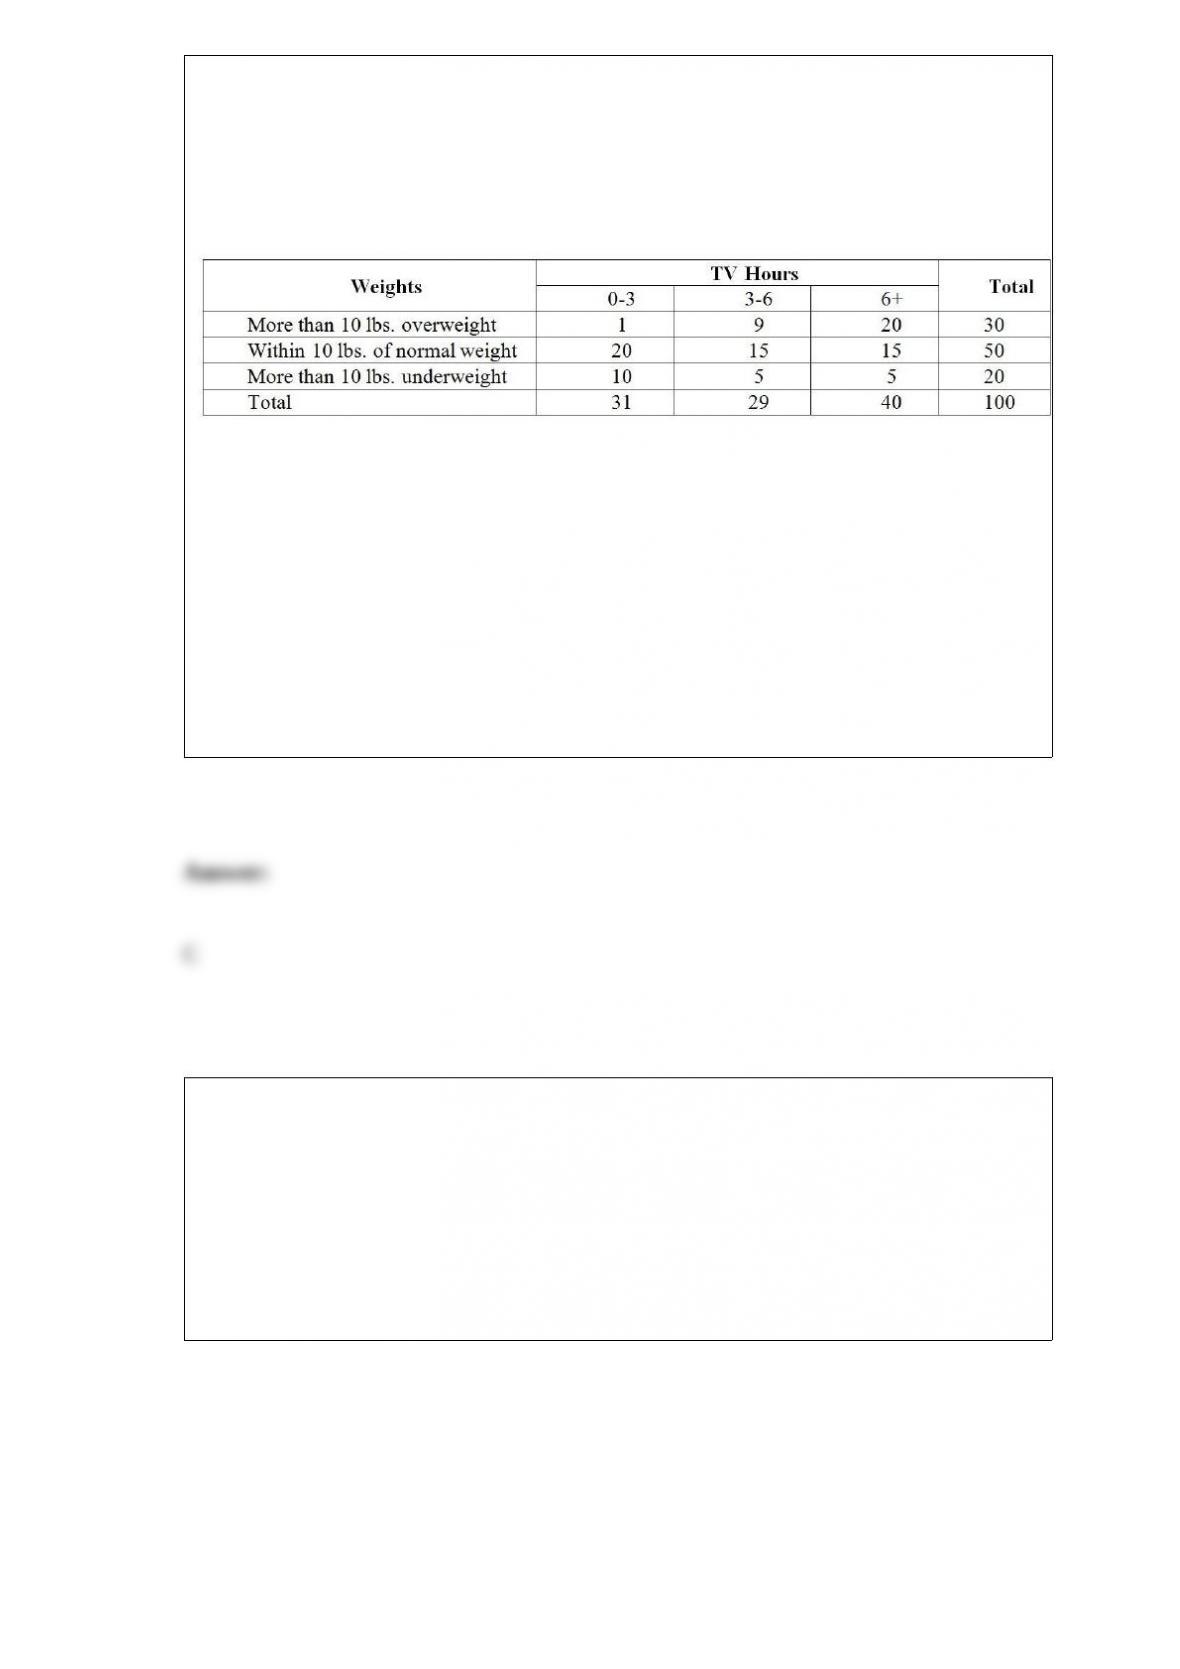
Recent studies have found that American children are more obese than in the past. The
amount of time children spent watching television has received much of the blame. A
survey of 100 ten-year-olds revealed the following with regards to weights and average
number of hours a day spent watching television. We are interested in testing whether
the mean number of hours spent watching TV and weights are independent at 1% level
of significance.
Referring to Table 12-13, how many children in the survey spend no more than 6 hours
watching TV and are more than 10 lbs. underweight?
A) 5
B) 10
C) 15
D) 20
Referring to Table 14-4, which of the following values for the level of significance is
the smallest for which the regression model as a whole is significant?
TABLE 14-4
A real estate builder wishes to determine how house size (House) is influenced by
family income (Income) and family size (Size). House size is measured in hundreds of
square feet and income is measured in thousands of dollars. The builder randomly
selected 50 families and ran the multiple regression. Partial Microsoft Excel output is
provided below:
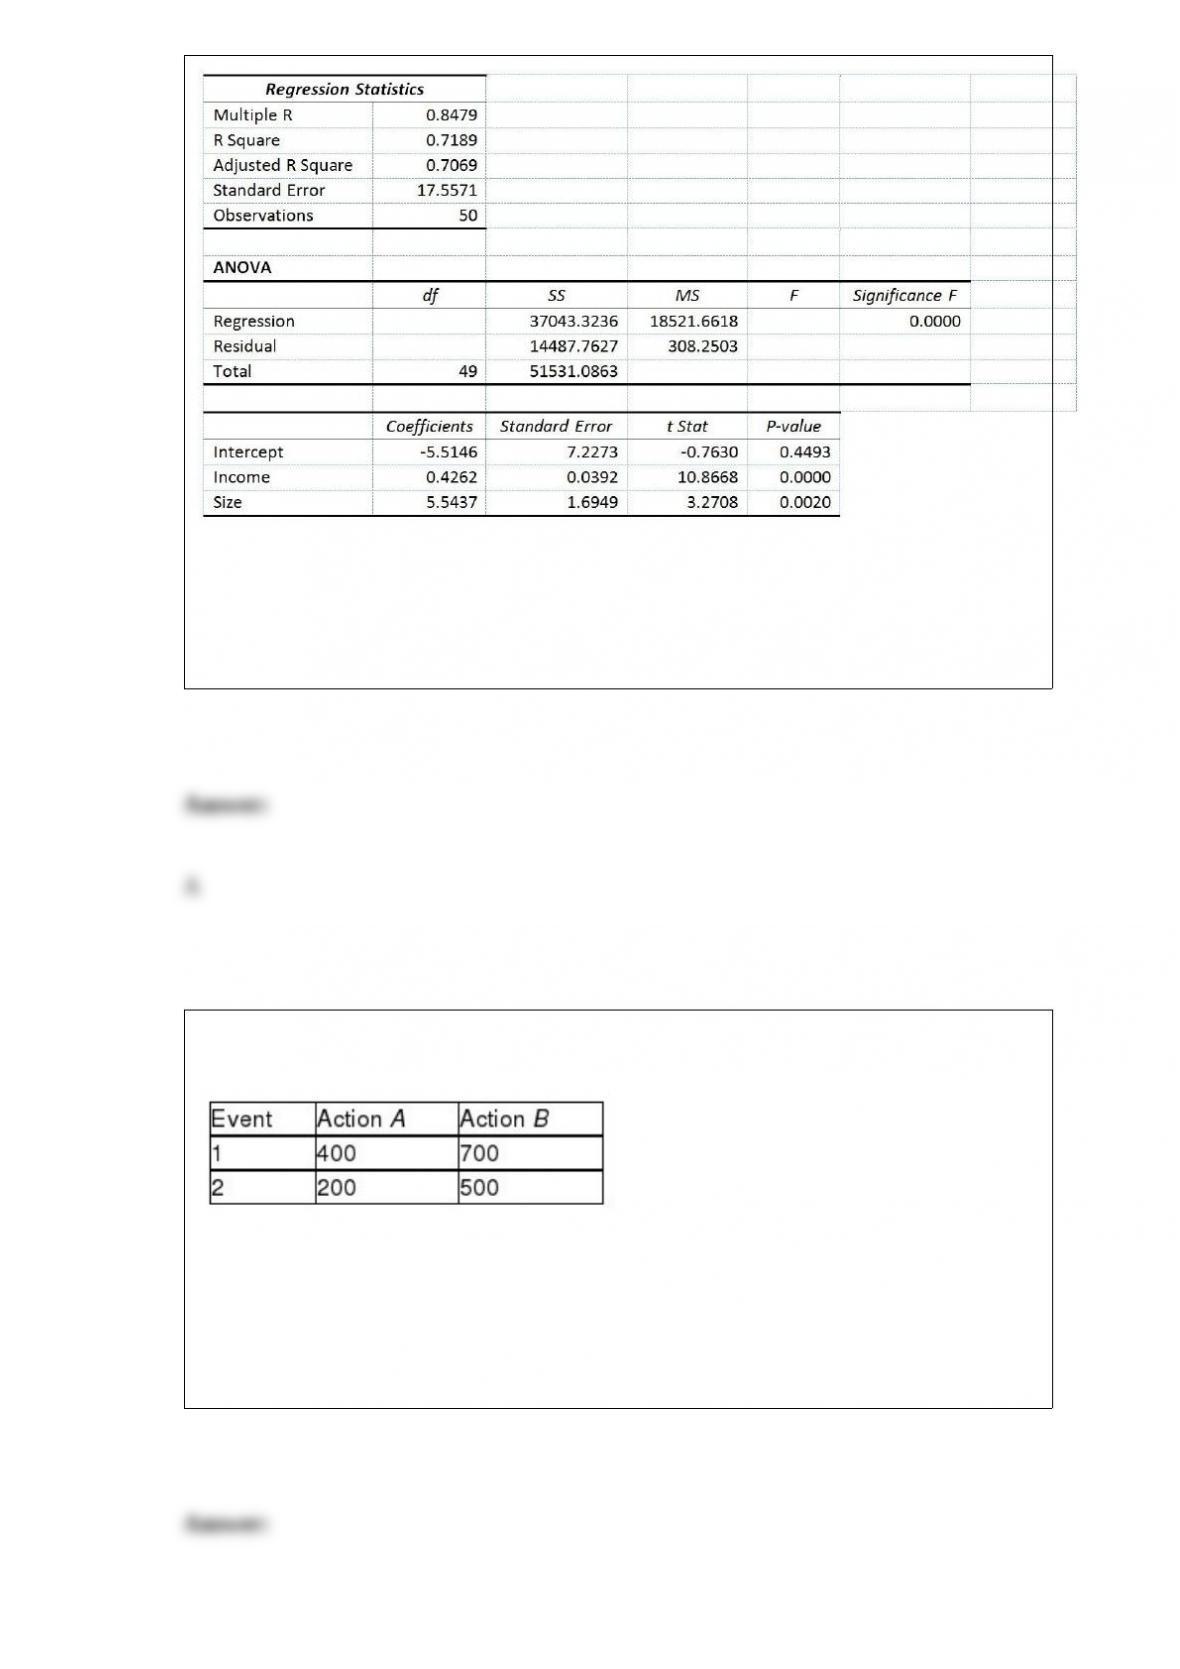
Also SSR (X1∣ X2) = 36400.6326 and SSR (X2∣ X1) = 3297.7917
A) 0.0005
B) 0.001
C) 0.01
D) 0.05
TABLE 19-2
The following payoff matrix is given in dollars.
Suppose the probability of Event 1 is 0.5 and Event 2 is 0.5.
Referring to Table 19-2, what is the action with the preferable return to risk ratio?
A) Action A
B) Action B
C) Either Action A or Action B
D) It cannot be determined.
Are Japanese managers more motivated than American managers? A randomly selected
group of 100 managers from each group were administered the Sarnoff Survey of
Attitudes Toward Life (SSATL), which measures motivation for upward mobility. The
mean and standard deviation of the SSATL scores are computed. The standard
deviations of the SSATL scores suggest that the standard deviation from the two groups
is very different. Which of the following tests will be the most appropriate?
A) t test for the mean
B) Z test for the proportion
C) Pooled-variance t test
D) Separate-variance t test
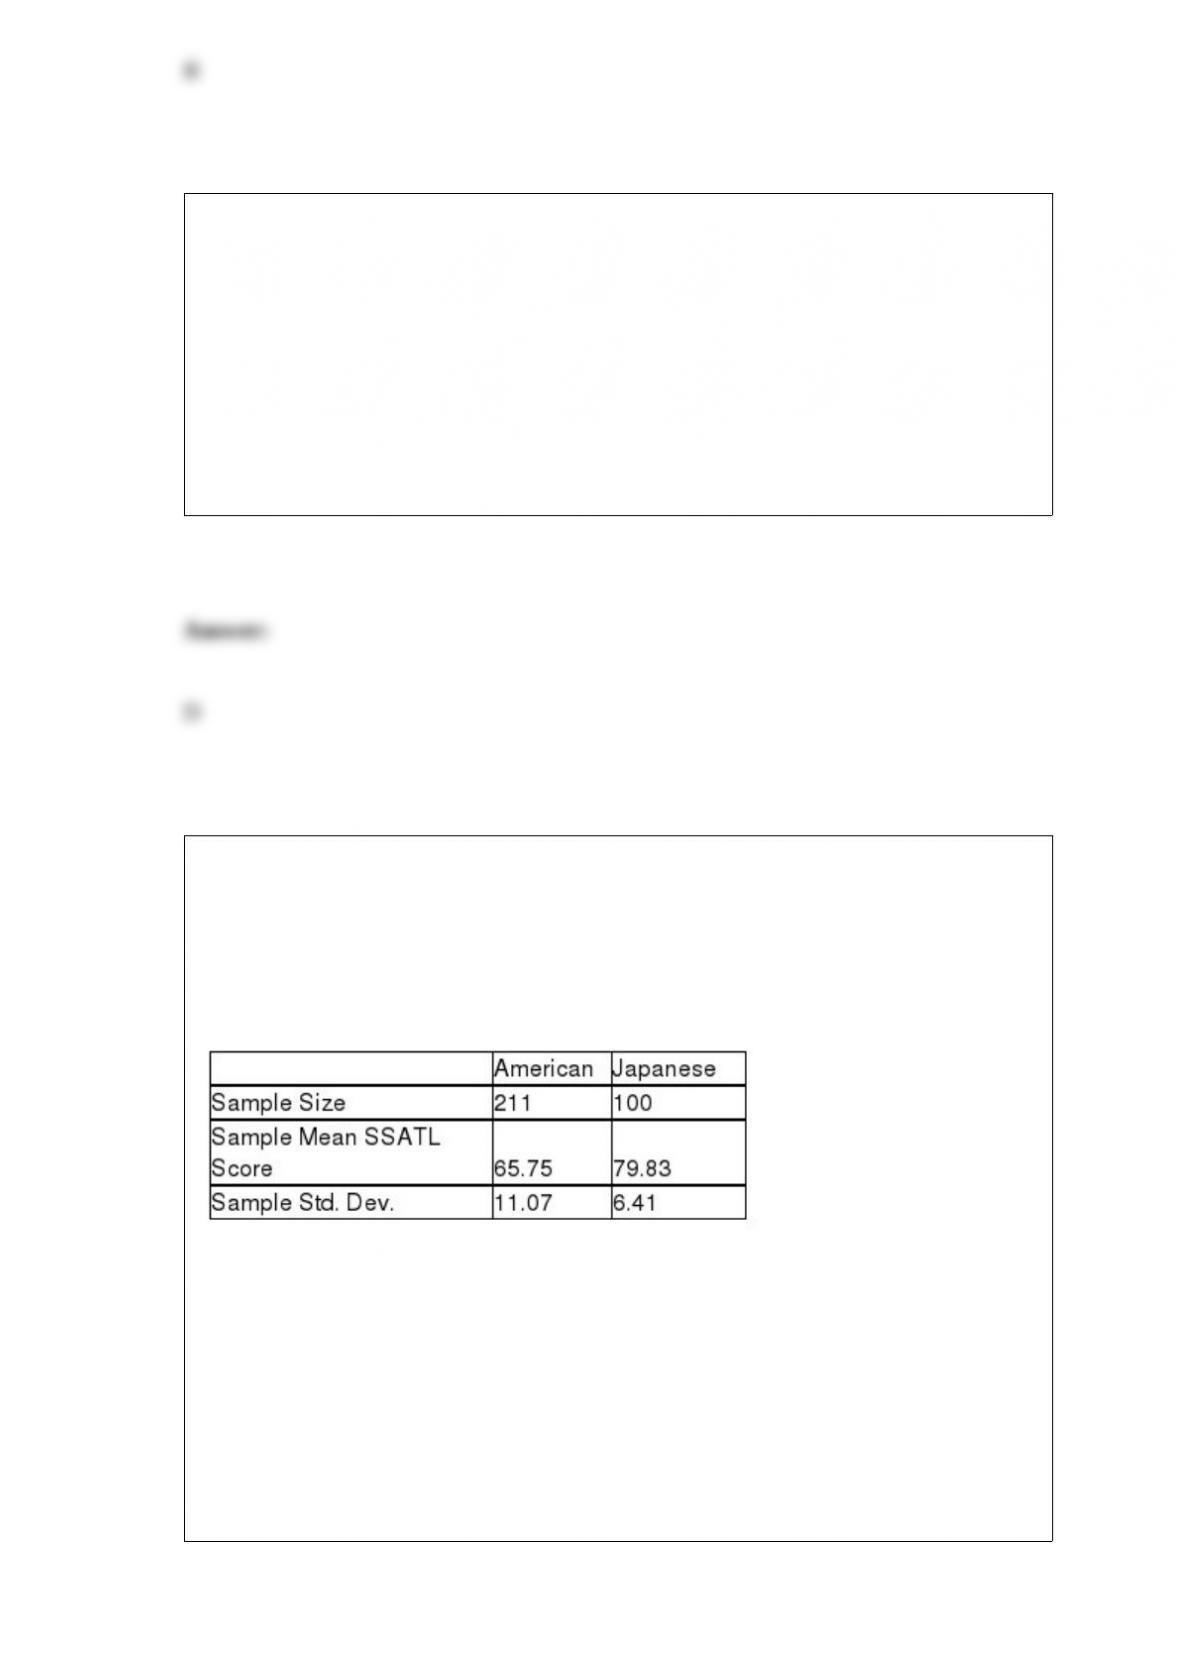
TABLE 10-1
Are Japanese managers more motivated than American managers? A randomly selected
group of each were administered the Sarnoff Survey of Attitudes Toward Life (SSATL),
which measures motivation for upward mobility. The SSATL scores are summarized
below.
Referring to Table 10-1, what is the value of the test statistic?
A) -14.08
B) -11.8092
C) -1.9677
D) 96.4471

A powerful women’s group has claimed that men and women differ in attitudes about
sexual discrimination. A group of 50 men (group 1) and 40 women (group 2) were
asked if they thought sexual discrimination is a problem in the United States. Of those
sampled, 11 of the men and 19 of the women did believe that sexual discrimination is a
problem. Which of the following tests will you use to find out if there is any difference
in attitudes about sexual discrimination?
A) Pooled-variance t test
B) Paired t test
C) Z test for difference in proportions
D) Wilcoxon rank sum test
A telemarketer set the company’s computerized dialing system to contact every 25th
person listed in the local telephone directory. What sampling method was used?
A) simple random sample
B) systematic sample
C) stratified sample
D) cluster sample
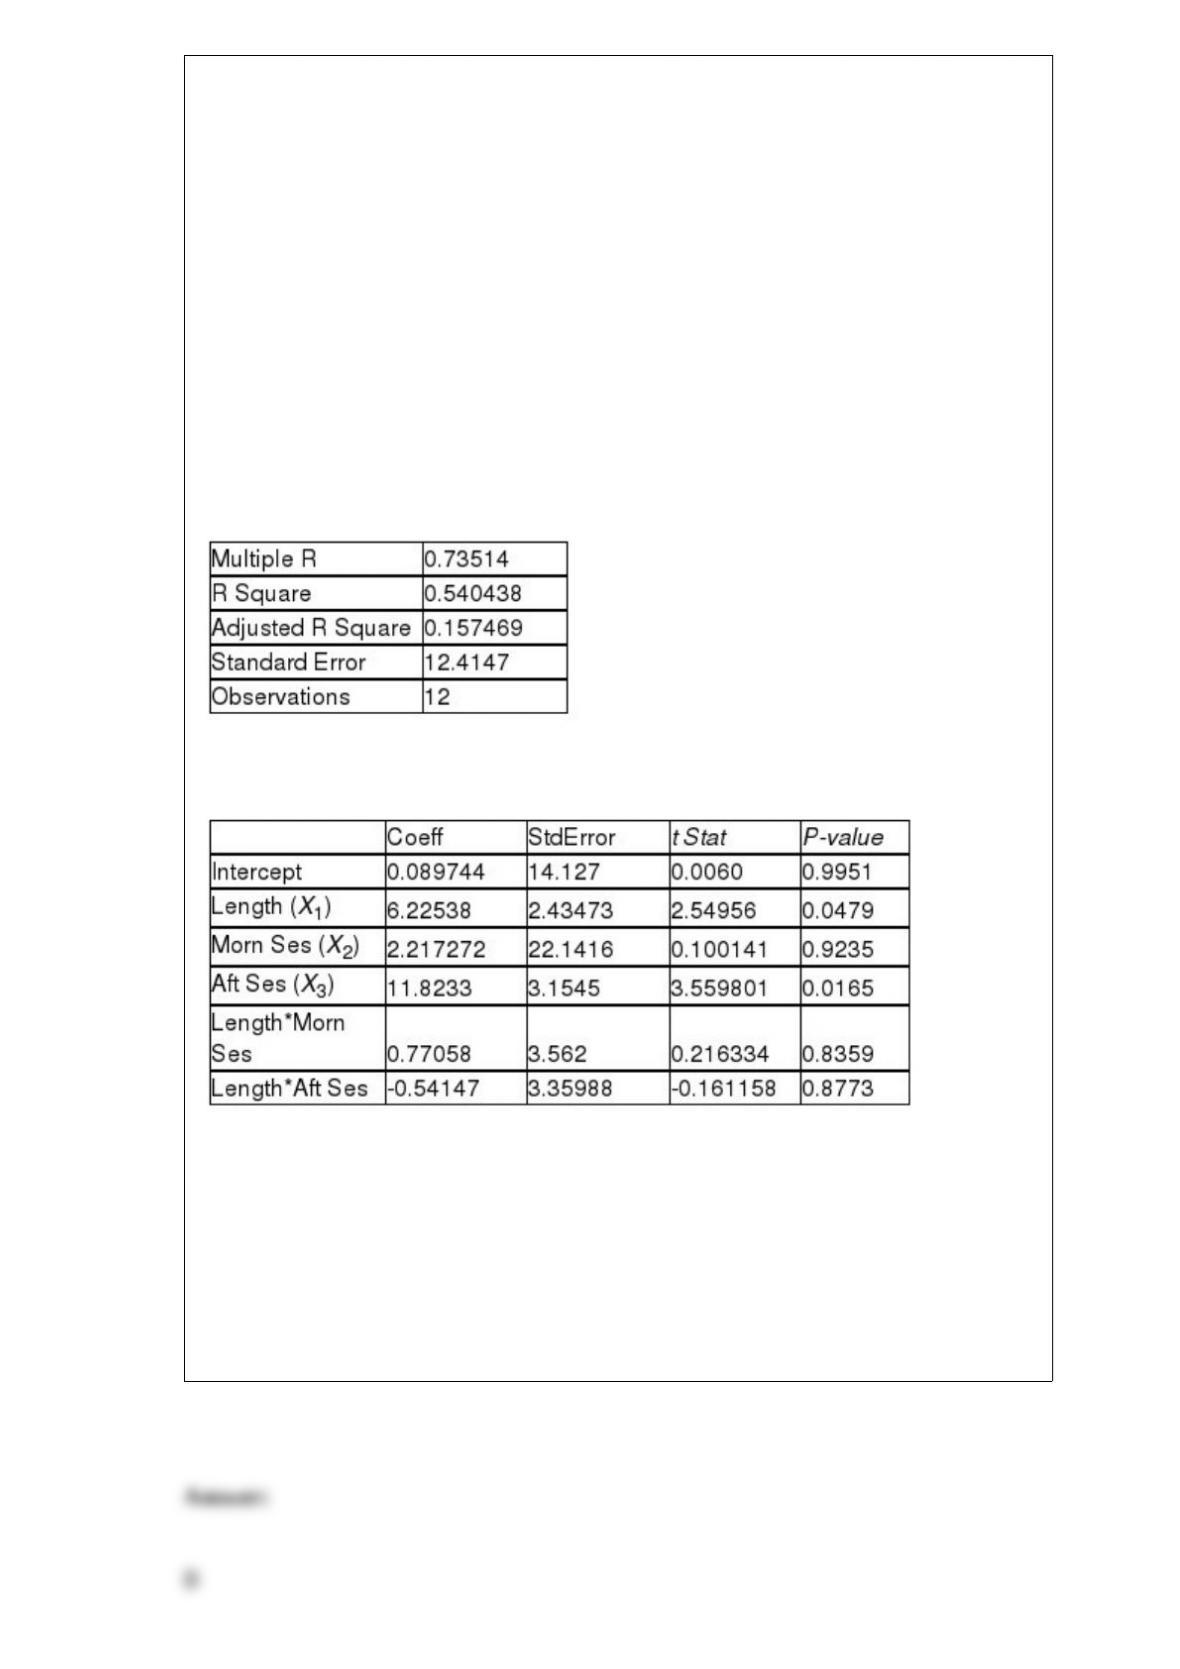
TABLE 17-6
A weight-loss clinic wants to use regression analysis to build a model for weight loss of
a client (measured in pounds). Two variables thought to affect weight loss are client’s
length of time on the weight-loss program and time of session. These variables are
described below:
Y = Weight loss (in pounds)
X1 = Length of time in weight-loss program (in months)
X2 = 1 if morning session, 0 if not
X3 = 1 if afternoon session, 0 if not (Base level = evening session)
Data for 12 clients on a weight-loss program at the clinic were collected and used to fit
the interaction model:
Y = β0 + β1X1 + β2X2 + β3X3 + β4X1X2 + β5X1X3 + ε
Partial output from Microsoft Excel follows:
Regression Statistics
ANOVA
F = 5.41118 Significance F = 0.040201
Referring to Table 17-6, in terms of the βs in the model, give the mean change in
weight loss (Y) for every 1-month increase in time in the program (X1) when attending
the afternoon session.
A) β1 + β4
B) β1 + β5
C) β1
D) β4 + β5
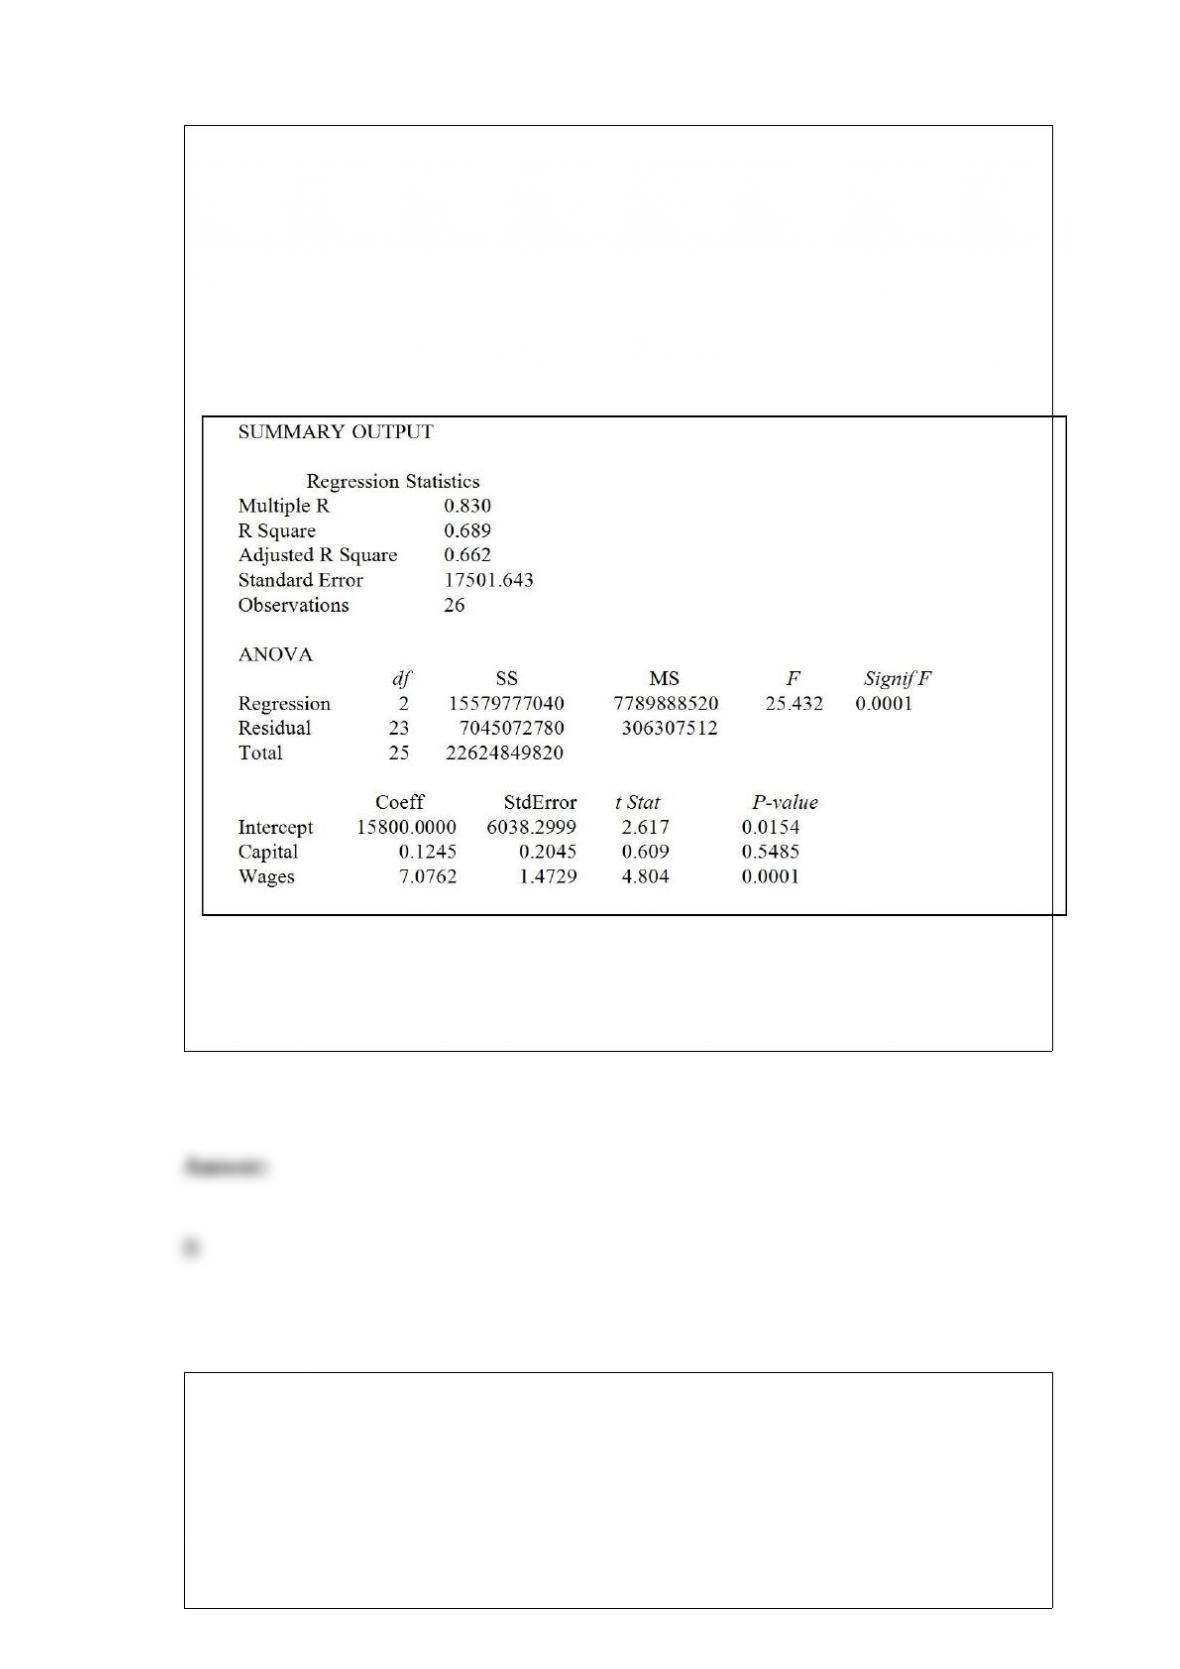
Referring to Table 14-5, one company in the sample had sales of $21.439 billion (Sales
= 21,439). This company spent $300 million on capital and $700 million on wages.
What is the residual (in millions of dollars) for this data point?
TABLE 14-5
A microeconomist wants to determine how corporate sales are influenced by capital and
wage spending by companies. She proceeds to randomly select 26 large corporations
and record information in millions of dollars. The Microsoft Excel output below shows
results of this multiple regression.
A) 790.69
B) 648.31
C) -648.31
D) -790.69
Referring to Table 14-10, the total degrees of freedom that are
missing in the ANOVA table should be ________.
TABLE 14-10
You worked as an intern at We Always Win Car Insurance Company
last summer. You notice that individual car insurance premiums

depend very much on the age of the individual and the number of
traffic tickets received by the individual. You performed a regression
analysis in EXCEL and obtained the following partial information:
TABLE 3-4
The ordered array below represents the number of cargo manifests approved by customs
inspectors of the Port of New York in a sample of 35 days:
16, 17, 18, 18, 19, 20, 20, 21, 21, 21, 22, 22, 22, 22, 23, 23, 23, 23, 24, 24, 24, 25, 25,
26, 26, 26, 27, 28, 28, 29, 29, 31, 31, 32, 32
Note: For this sample, the sum of the values is 838, and the sum of the squared
differences between each value and the mean is 619.89.
Referring to Table 3-4, the arithmetic mean of the customs data is ________.
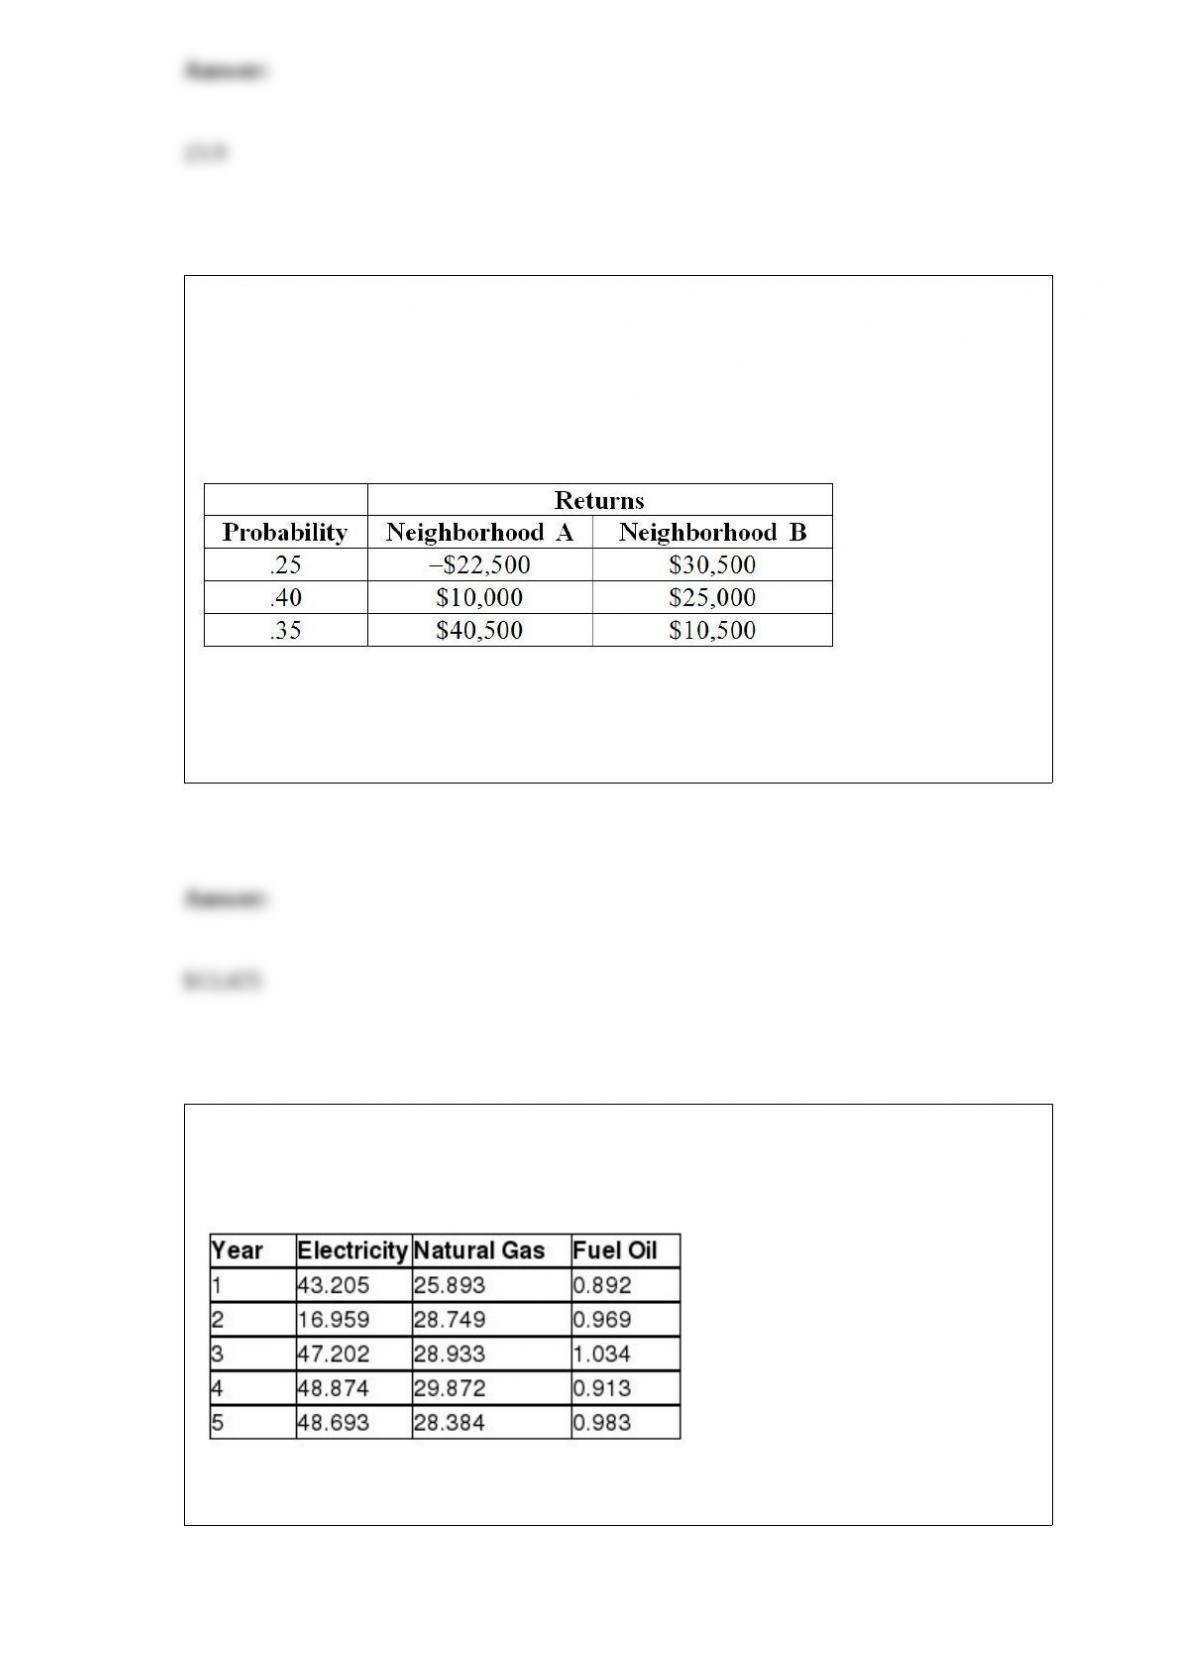
TABLE 5-7
There are two houses with almost identical characteristics available for investment in
two different neighborhoods with drastically different demographic composition. The
anticipated gain in value when the houses are sold in 10 years has the following
probability distribution:
Referring to Table 5-7, if you can invest 90% of your money on the house in
neighborhood A and the remaining on the house in neighborhood B, what is the
portfolio expected return of your investment?
TABLE 16-15
Given below are the average prices for three types of energy products for five
consecutive years.
Referring to Table 16-15, what are the simple price indices for electricity, natural gas
and fuel oil, respectively, in year 3 using year 5 as the base year?
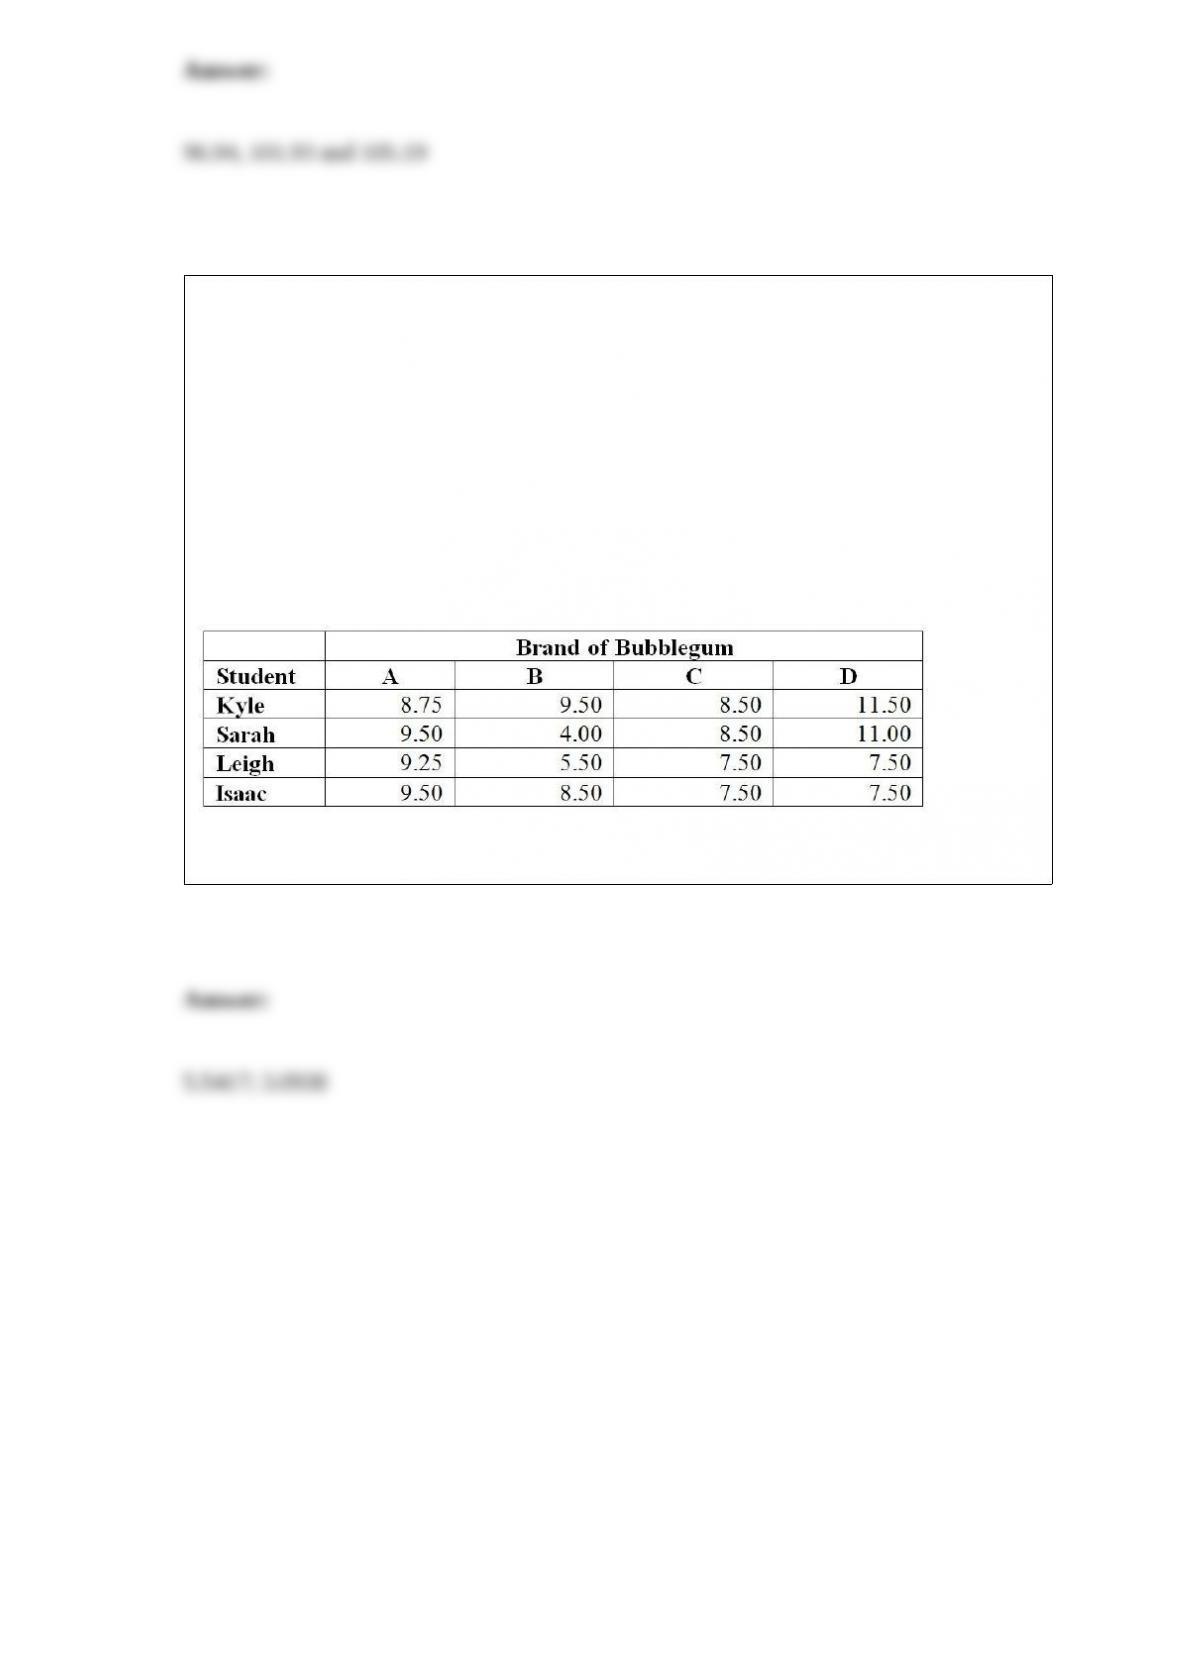
TABLE 11-11
A student team in a business statistics course designed an experiment to investigate
whether the brand of bubblegum used affected the size of bubbles they could blow. To
reduce the person-to-person variability, the students decided to use a randomized block
design using themselves as blocks.
Four brands of bubblegum were tested. A student chewed two pieces of a brand of gum
and then blew a bubble, attempting to make it as big as possible. Another student
measured the diameter of the bubble at its biggest point. The following table gives the
diameters of the bubbles (in inches) for the 16 observations.
Referring to Table 11-11, the value of MSA is ________, while MSBL is ________.