True or False: TABLE 17-10
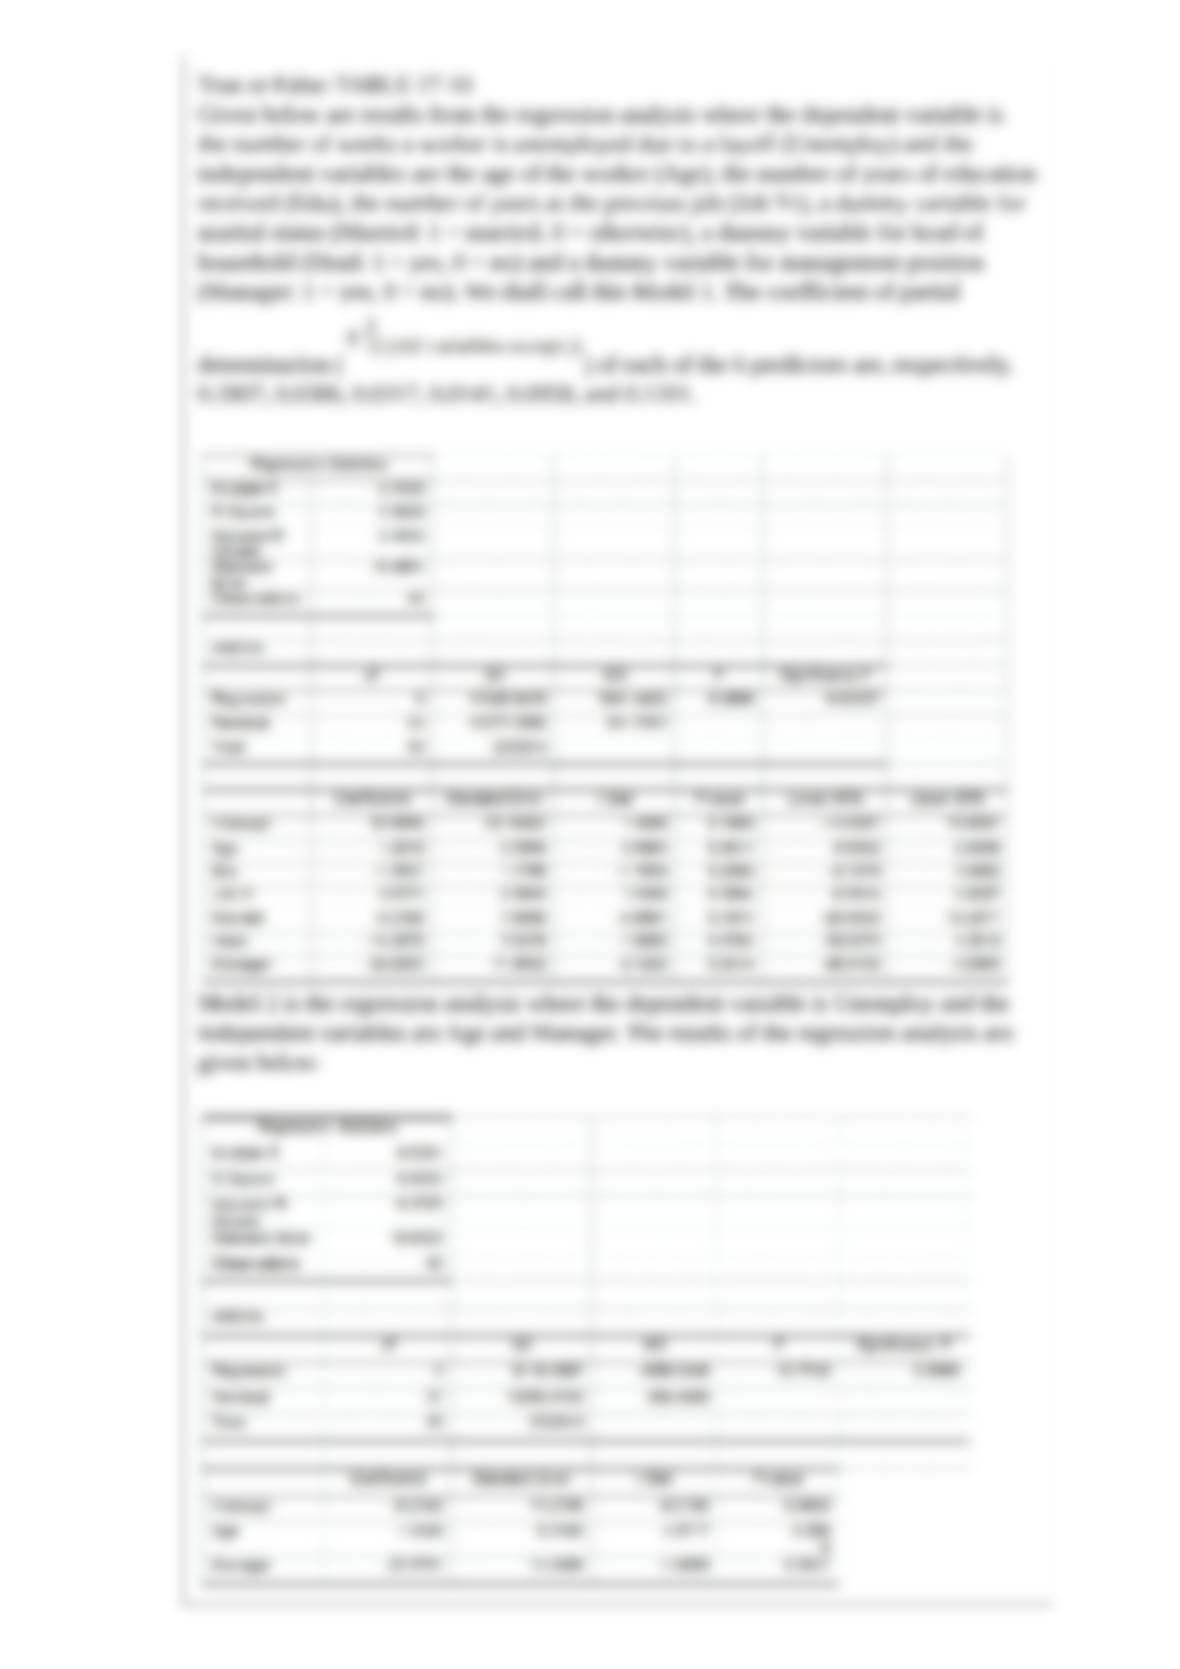
Given below are results from the regression analysis where the dependent variable is
the number of weeks a worker is unemployed due to a layoff (Unemploy) and the
independent variables are the age of the worker (Age), the number of years of education
received (Edu), the number of years at the previous job (Job Yr), a dummy variable for
marital status (Married: 1 = married, 0 = otherwise), a dummy variable for head of
household (Head: 1 = yes, 0 = no) and a dummy variable for management position
(Manager: 1 = yes, 0 = no). We shall call this Model 1. The coefficient of partial
determination ( ) of each of the 6 predictors are, respectively,
0.2807, 0.0386, 0.0317, 0.0141, 0.0958, and 0.1201.
Model 2 is the regression analysis where the dependent variable is Unemploy and the
independent variables are Age and Manager. The results of the regression analysis are
given below:
Referring to Table 17-10, Model 1, the null hypothesis should be rejected at a 10% level
of significance when testing whether being married or not makes a difference in the
mean number of weeks a worker is unemployed due to a layoff while holding constant
the effect of all the other independent variables.
TABLE 15-6
Given below are results from the regression analysis on 40 observations where the
dependent variable is the number of weeks a worker is unemployed due to a layoff (Y)
and the independent variables are the age of the worker (X1), the number of years of
education received (X2), the number of years at the previous job (X3), a dummy variable
for marital status (X4: 1 = married, 0 = otherwise), a dummy variable for head of
household (X5: 1 = yes, 0 = no) and a dummy variable for management position (X6: 1
= yes, 0 = no).
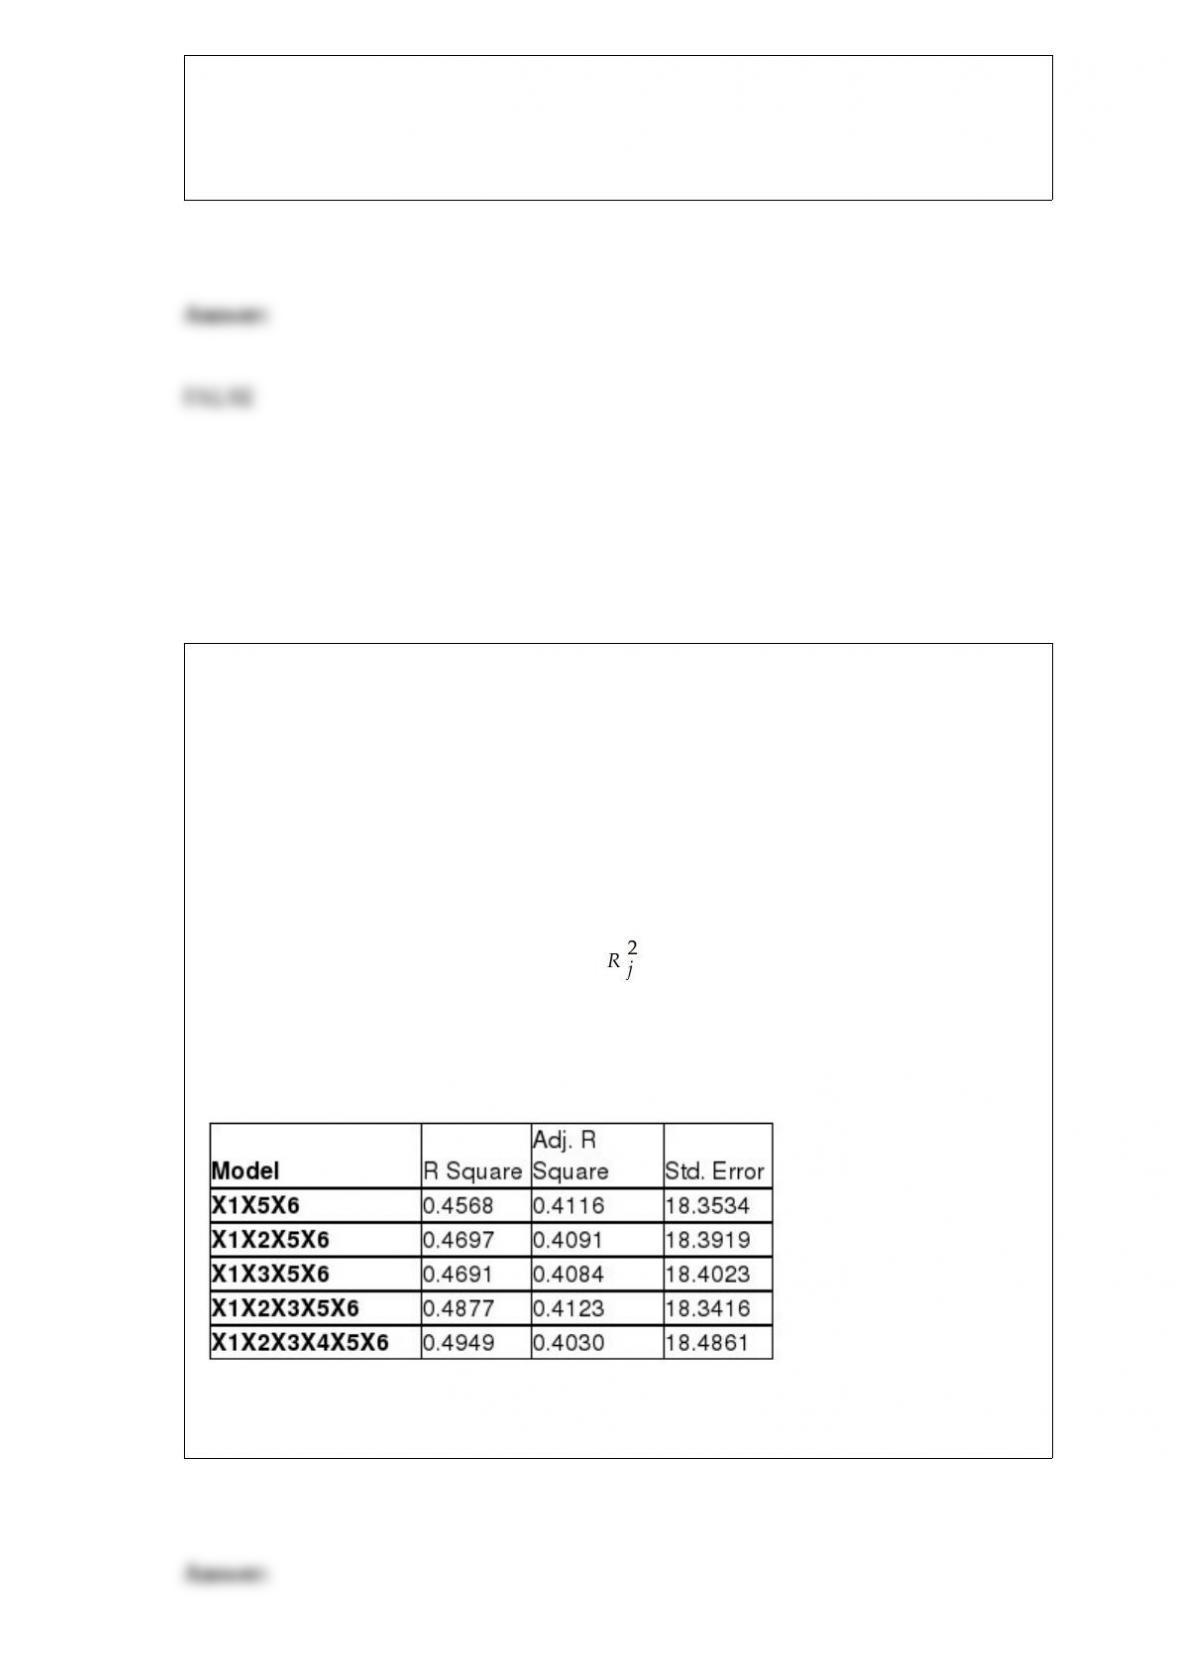
The coefficient of multiple determination ( ) for the regression model using each of
the 6 variables Xj as the dependent variable and all other X variables as independent
variables are, respectively, 0.2628, 0.1240, 0.2404, 0.3510, 0.3342 and 0.0993.
The partial results from best-subset regression are given below:
True or False: Referring to Table 15-6, the model that includes X1, X5 and X6 should be
selected using the adjusted r2 statistic.
True or False: A sample of 200 students at a Big-Ten university was taken after the
midterm to ask whether they went bar hopping the weekend before the midterm or
spent the weekend studying, and whether they did well or poorly on the midterm. You
can use a contingency table to present this information.
True or False: When a dummy variable is included in a multiple regression model, the
interpretation of the estimated slope coefficient does not make any sense anymore.
True or False: Cpk > 1 indicates that the process average is exactly 3 standard deviations
away from the closest specification limit.
True or False: Collinearity is present if the dependent variable is linearly related to one
of the explanatory variables.
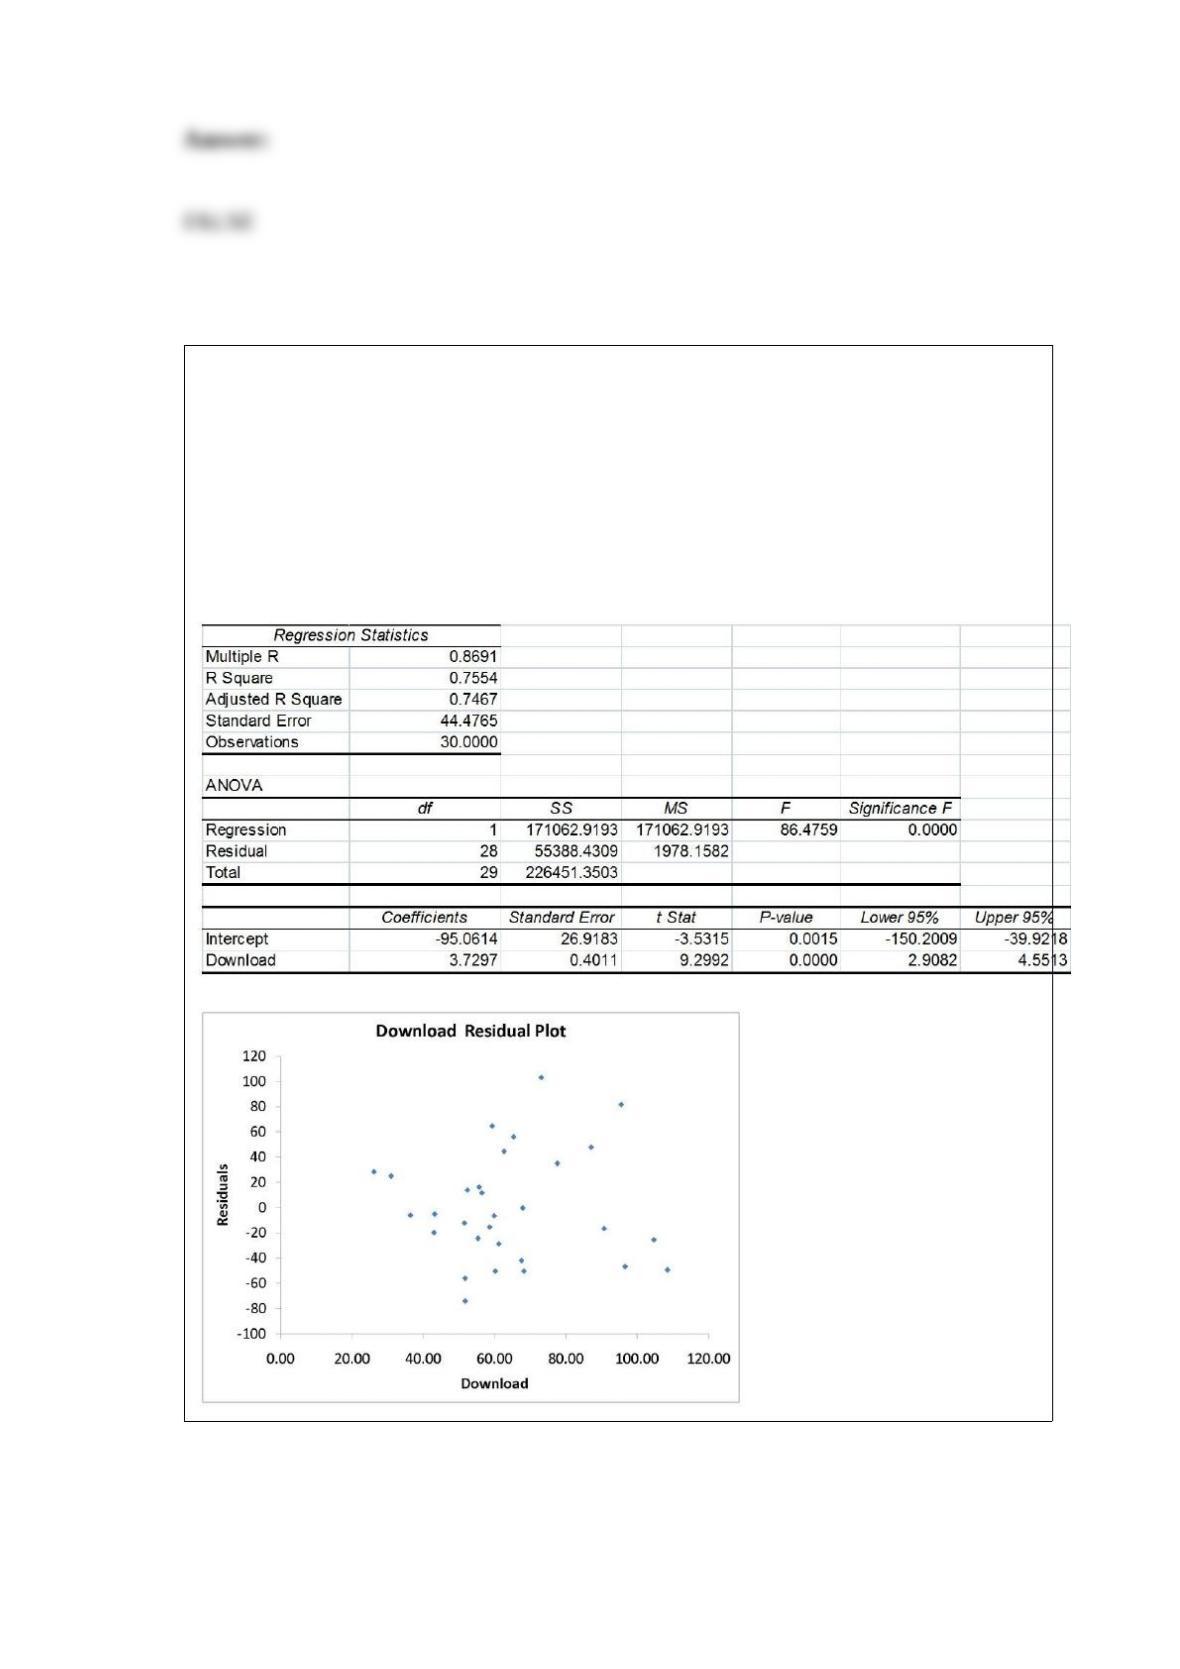
TABLE 13-11
A computer software developer would like to use the number of downloads (in
thousands) for the trial version of his new shareware to predict the amount of revenue
(in thousands of dollars) he can make on the full version of the new shareware.
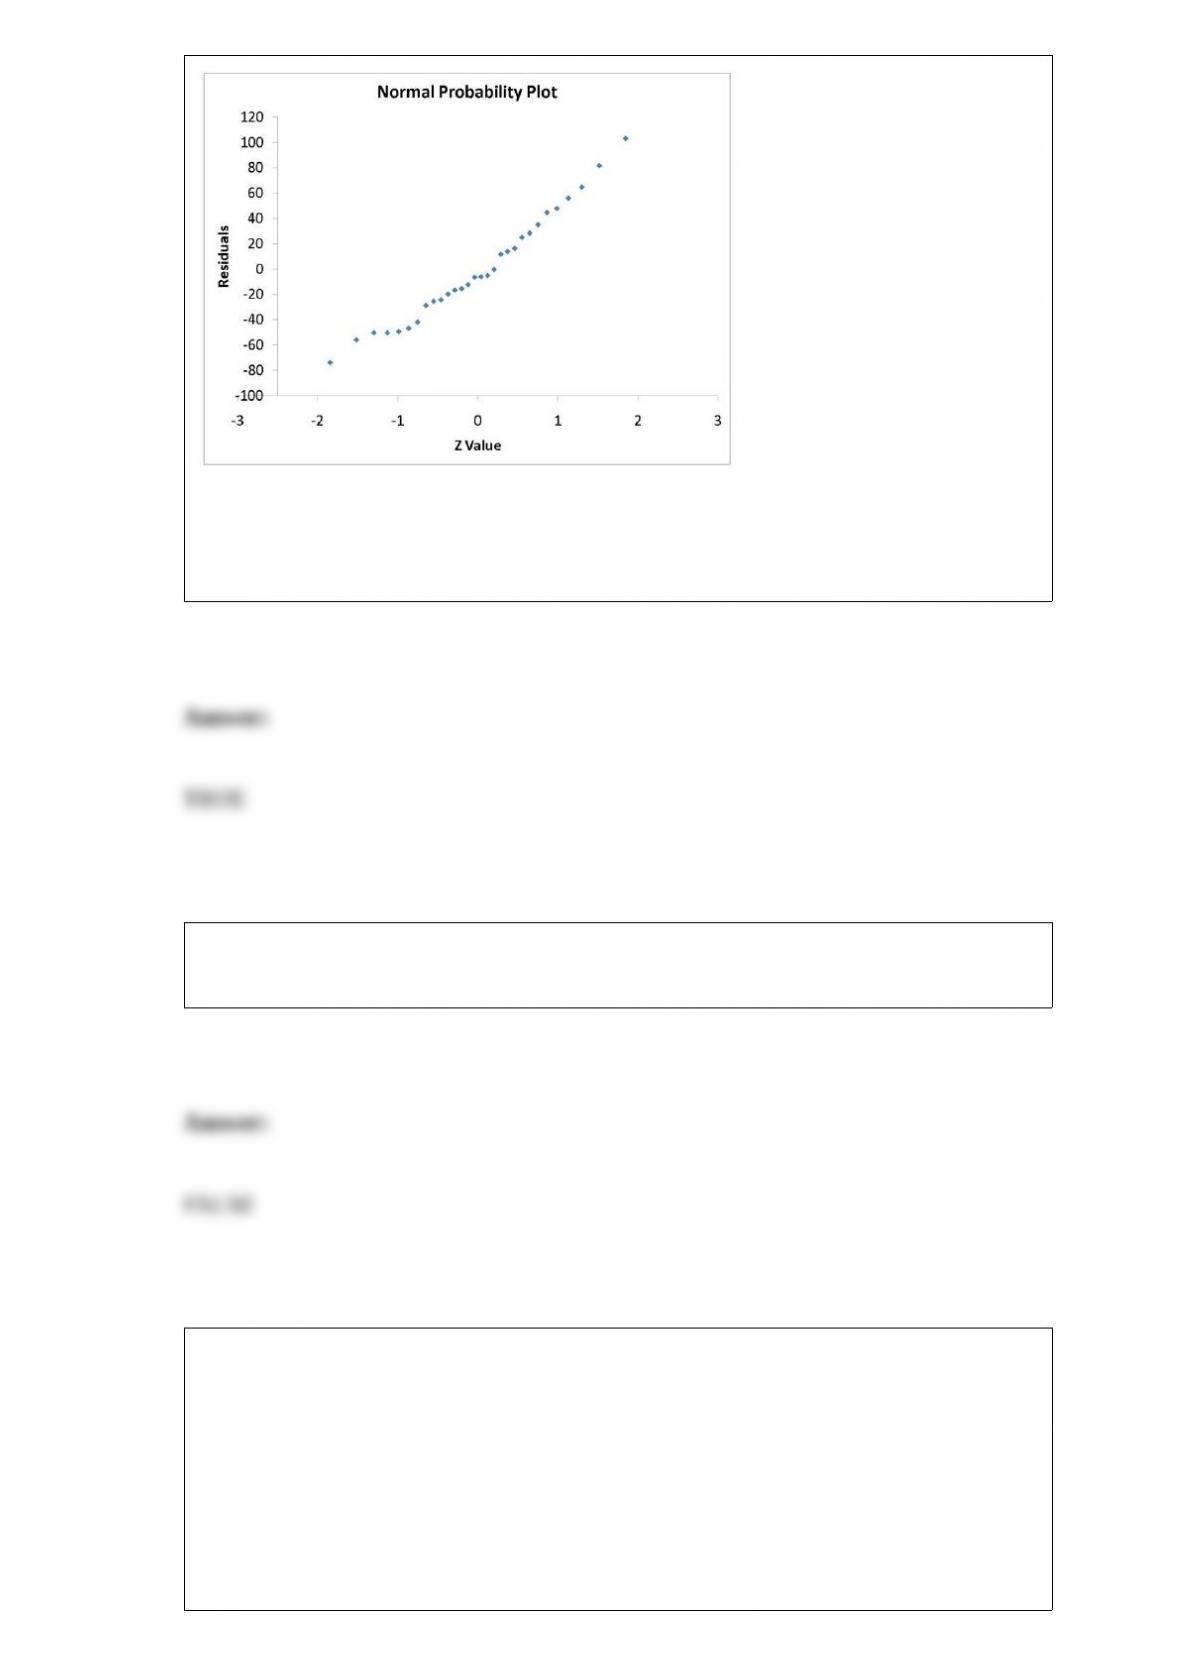
Following is the output from a simple linear regression along with the residual plot and
normal probability plot obtained from a data set of 30 different sharewares that he has
developed:
True or False: Referring to Table 13-11, the null hypothesis for testing whether there is
a linear relationship between revenue and the number of downloads is, “There is no
linear relationship between revenue and the number of downloads.”
True or False: A test for whether one proportion is higher than the other can be
performed using the chi-square distribution.
TABLE 14-16
What are the factors that determine the acceleration time (in sec.)
from 0 to 60 miles per hour of a car? Data on the following variables
for 30 different vehicle models were collected:
Y (Accel Time): Acceleration time in sec.
X1 (Engine Size): c.c.
X2 (Sedan): 1 if the vehicle model is a sedan and 0 otherwise

The regression results using acceleration time as the dependent
variable and the remaining variables as the independent variables are
presented below.
The various residual plots are as shown below.
The coe,cient of partial determinations and are 0.3301,
and 0.0594, respectively.
The coe,cient of determination for the regression model using each
of the 2 independent variables as the dependent variable and the
other independent variable as independent variables ( ) are,
respectively 0.0077, and 0.0077.
True or False: Referring to Table 14-16, there is enough evidence to
conclude that being a sedan or not makes a signiticant contribution to
the regression model in the presence of the other independent
variable at a 5% level of signiticance.
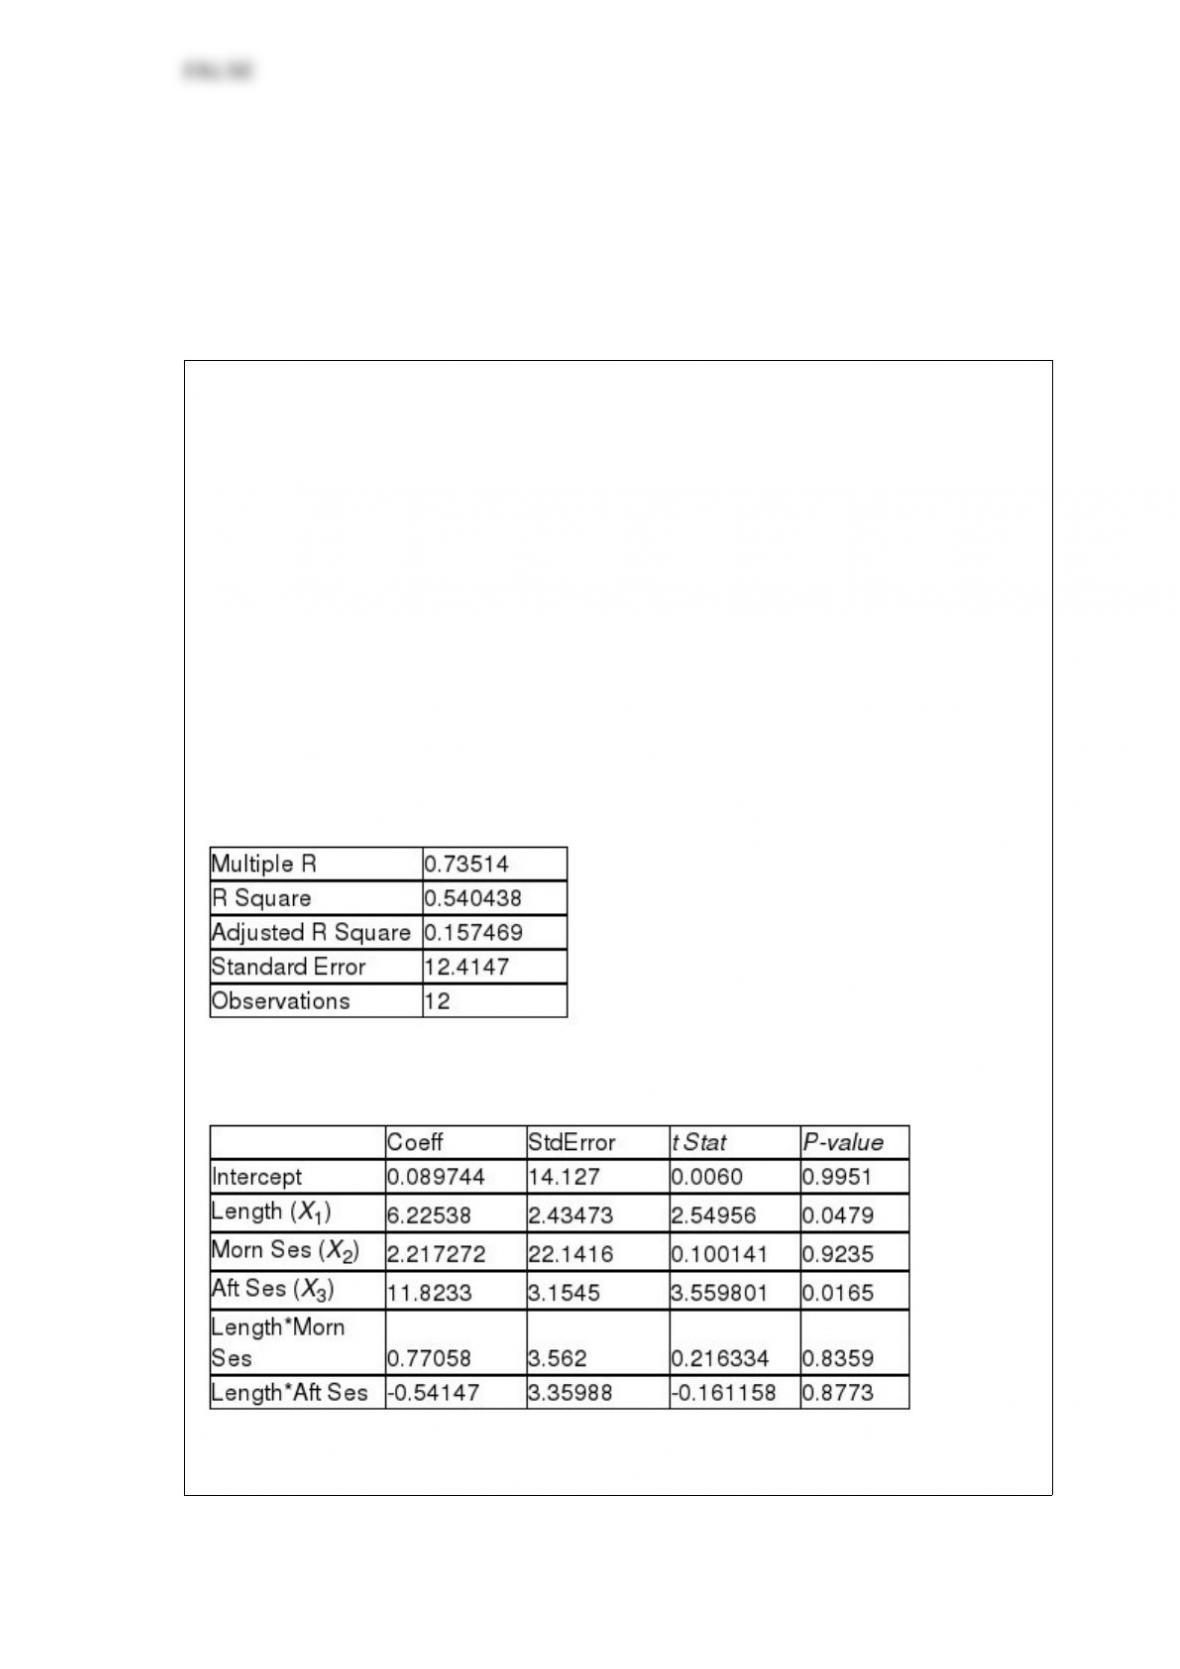
True or False: TABLE 17-6
A weight-loss clinic wants to use regression analysis to build a model for weight loss of
a client (measured in pounds). Two variables thought to affect weight loss are client’s
length of time on the weight-loss program and time of session. These variables are
described below:
Y = Weight loss (in pounds)
X1 = Length of time in weight-loss program (in months)
X2 = 1 if morning session, 0 if not
X3 = 1 if afternoon session, 0 if not (Base level = evening session)
Data for 12 clients on a weight-loss program at the clinic were collected and used to fit
the interaction model:
Y = β0 + β1X1 + β2X2 + β3X3 + β4X1X2 + β5X1X3 + ε
Partial output from Microsoft Excel follows:
Regression Statistics
ANOVA
F = 5.41118 Significance F = 0.040201
Referring to Table 17-6, the overall model for predicting weight loss (Y) is statistically
significant at the 0.05 level.
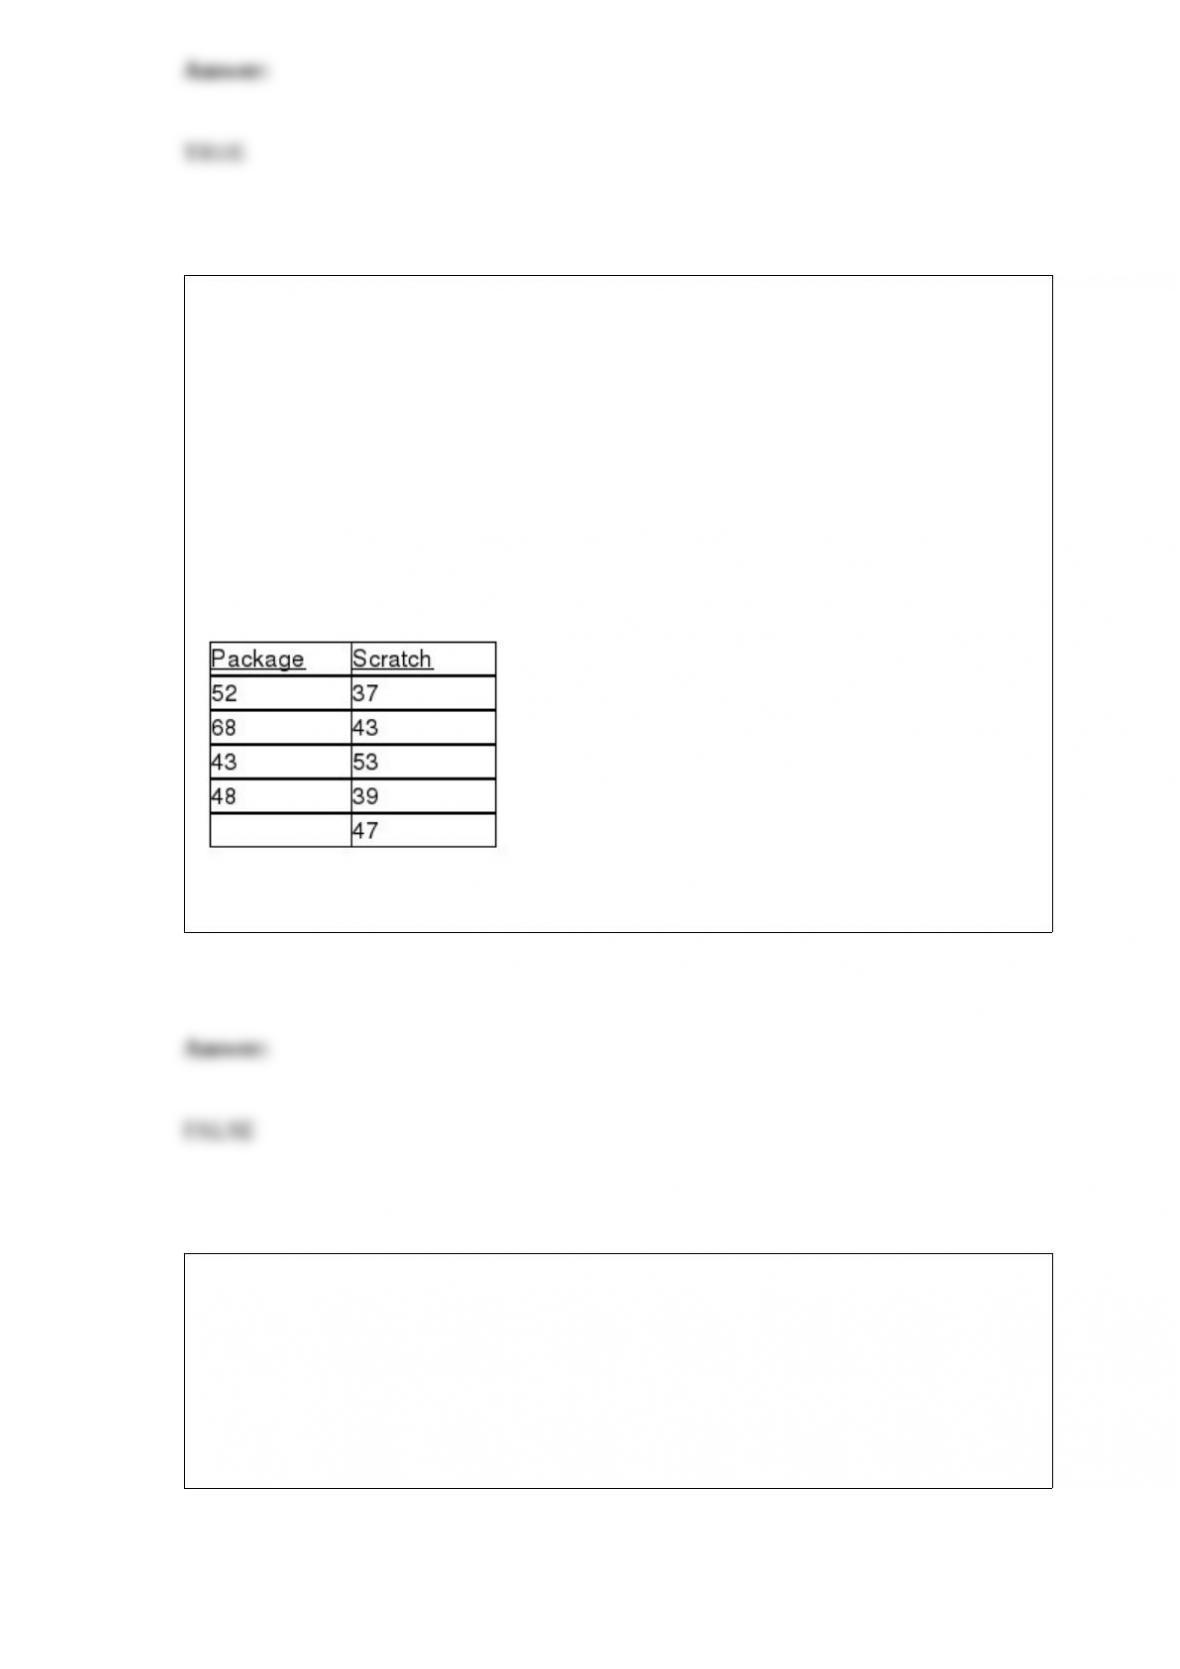
TABLE 12-14
A perfume manufacturer is trying to choose between 2 magazine advertising layouts.
An expensive layout would include a small package of the perfume. A cheaper layout
would include a ‘scratch-and-sniff” sample of the product. The manufacturer would use
the more expensive layout only if there is evidence that it would lead to a higher
approval rate. The manufacturer presents the more expensive layout to 4 groups and
determines the approval rating for each group. He presents the ‘scratch-and-sniff” layout
to 5 groups and again determines the approval rating of the perfume for each group. The
data are given below. Use this to test the appropriate hypotheses with the Wilcoxon
Rank Sum Test with a level of significance of 0.05.
True or False: Referring to Table 12-14, the null hypothesis should be rejected.
TABLE 14-10
You worked as an intern at We Always Win Car Insurance Company
last summer. You notice that individual car insurance premiums
depend very much on the age of the individual and the number of
tra,c tickets received by the individual. You performed a regression
analysis in EXCEL and obtained the following partial information:
True or False: Referring to Table 14-10, the multiple regression model
is signiticant at a 10% level of signiticance.
True or False: Collinearity will result in excessively low standard errors of the
parameter estimates reported in the regression output.
Suppose the probability of a power outage at a nuclear power plant on a single day is
the same every day of the year. Also the probability of having a power outage on a
single day does not increase or decrease the probability of a power outage on another
day. Which of the following distributions would you use to determine the probability
that a power outage will occur next Monday?
A) Binomial distribution
B) Poisson distribution
C) Normal distribution
D) Hypergeometric distribution
The closing price of a company’s stock tomorrow can be lower, higher or the same as
today’s closing price. After evaluating all the information available on the company’s
fundamentals and the economic environment, an analyst has determined that the
probability that tomorrow’s closing price will be higher than today’s is determined to be
25%. This is an example of using which of the following probability approaches?
A) a priori probability
B) empirical probability
C) subjective probability
D) conditional probability
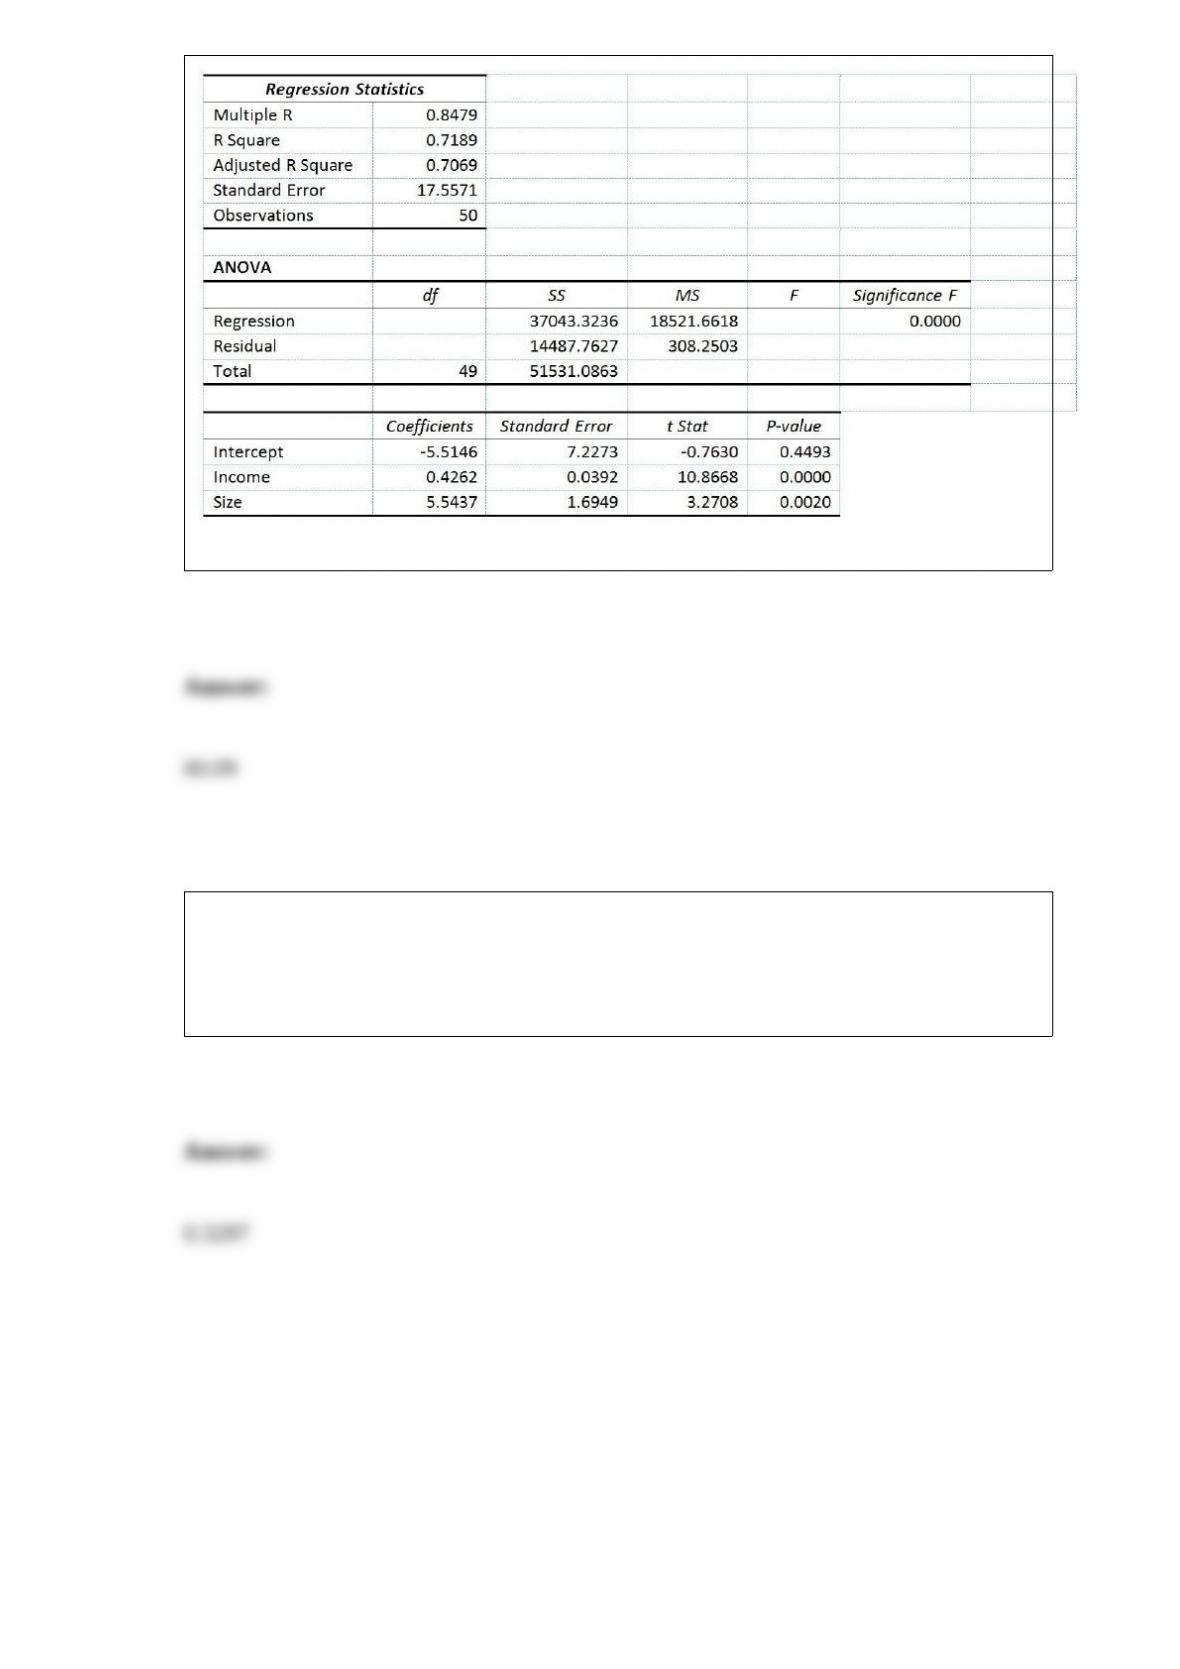
Referring to Table 14-4, what are the regression degrees of freedom that are missing
from the output?
TABLE 14-4
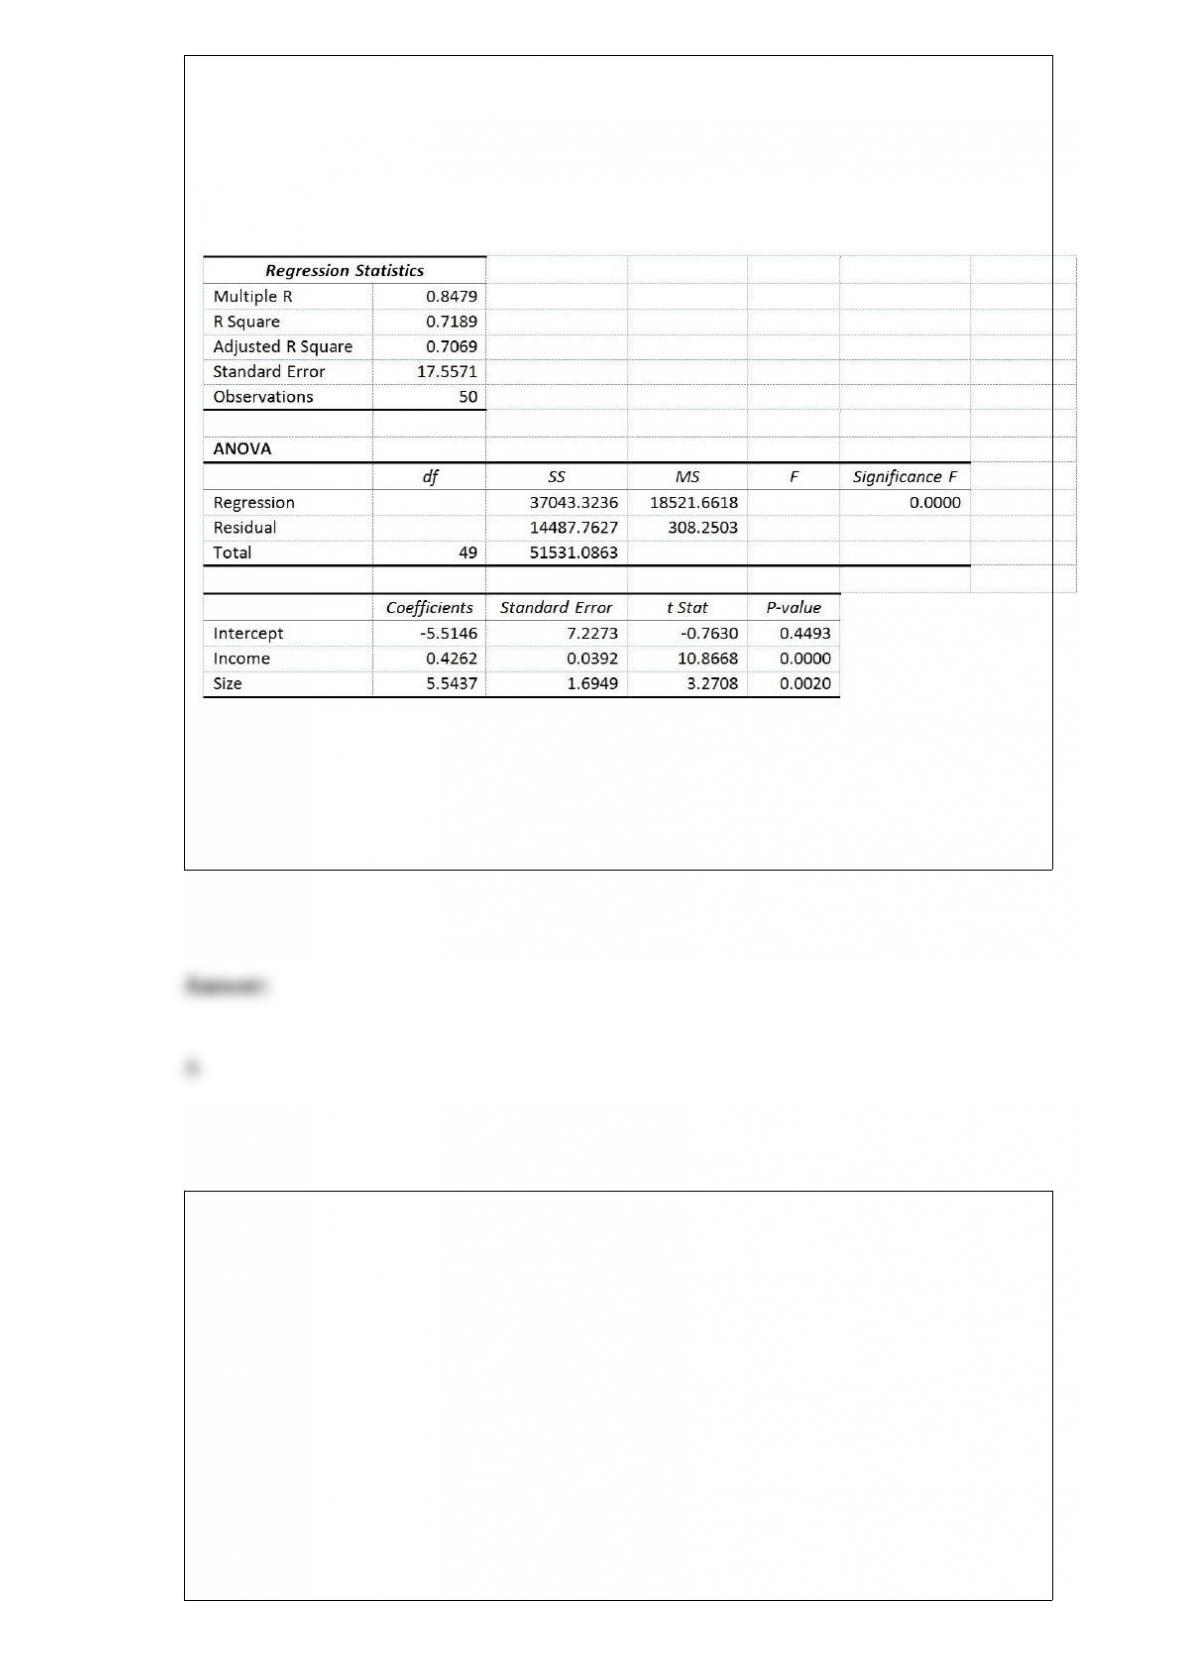
A real estate builder wishes to determine how house size (House) is influenced by
family income (Income) and family size (Size). House size is measured in hundreds of
square feet and income is measured in thousands of dollars. The builder randomly
selected 50 families and ran the multiple regression. Partial Microsoft Excel output is
provided below:
Also SSR (X1∣ X2) = 36400.6326 and SSR (X2∣ X1) = 3297.7917
A) 2
B) 47
C) 49
D) 50
Most analysts focus on the cost of tuition as the way to measure the cost of a college
education. But incidentals, such as textbook costs, are rarely considered. A researcher at
Drummand University wishes to estimate the textbook costs of first-year students at
Drummand. To do so, she monitored the textbook cost of 250 first-year students and
found that their average textbook cost was $600 per semester. Identify the sample in the
study.
A) all Drummand University students
B) all college students
C) all first-year Drummand University students
D) the 250 students that were monitored
Major league baseball salaries averaged $3.26 million with a standard deviation of $1.2
million in a recent year. Suppose a sample of 100 major league players was taken. Find
the approximate probability that the mean salary of the 100 players was less than $2.5
million.
A) approximately 0
B) 0.0151
C) 0.9849
D) approximately 1
A major Blu-ray rental chain is considering opening a new store in an area that
currently does not have any such stores. The chain will open if there is evidence that
more than 5,000 of the 20,000 households in the area are equipped with Blu-ray
players. It conducts a telephone poll of 300 randomly selected households in the area
and finds that 96 have Blu-ray players. State the test of hypothesis that is of interest to
the rental chain.
A) H0 : 0.32 versus H1 : > 0.32
B) H0 : 0.25 versus H1 : > 0.25
C) H0 : 5,000 versus H1 : > 5,000
D) H0 : 5,000 versus H1 : > 5,000
If the expected value of a sample statistic is equal to the parameter it is estimating, then
we call that sample statistic
A) unbiased.
B) minimum variance.
C) biased.
D) random.
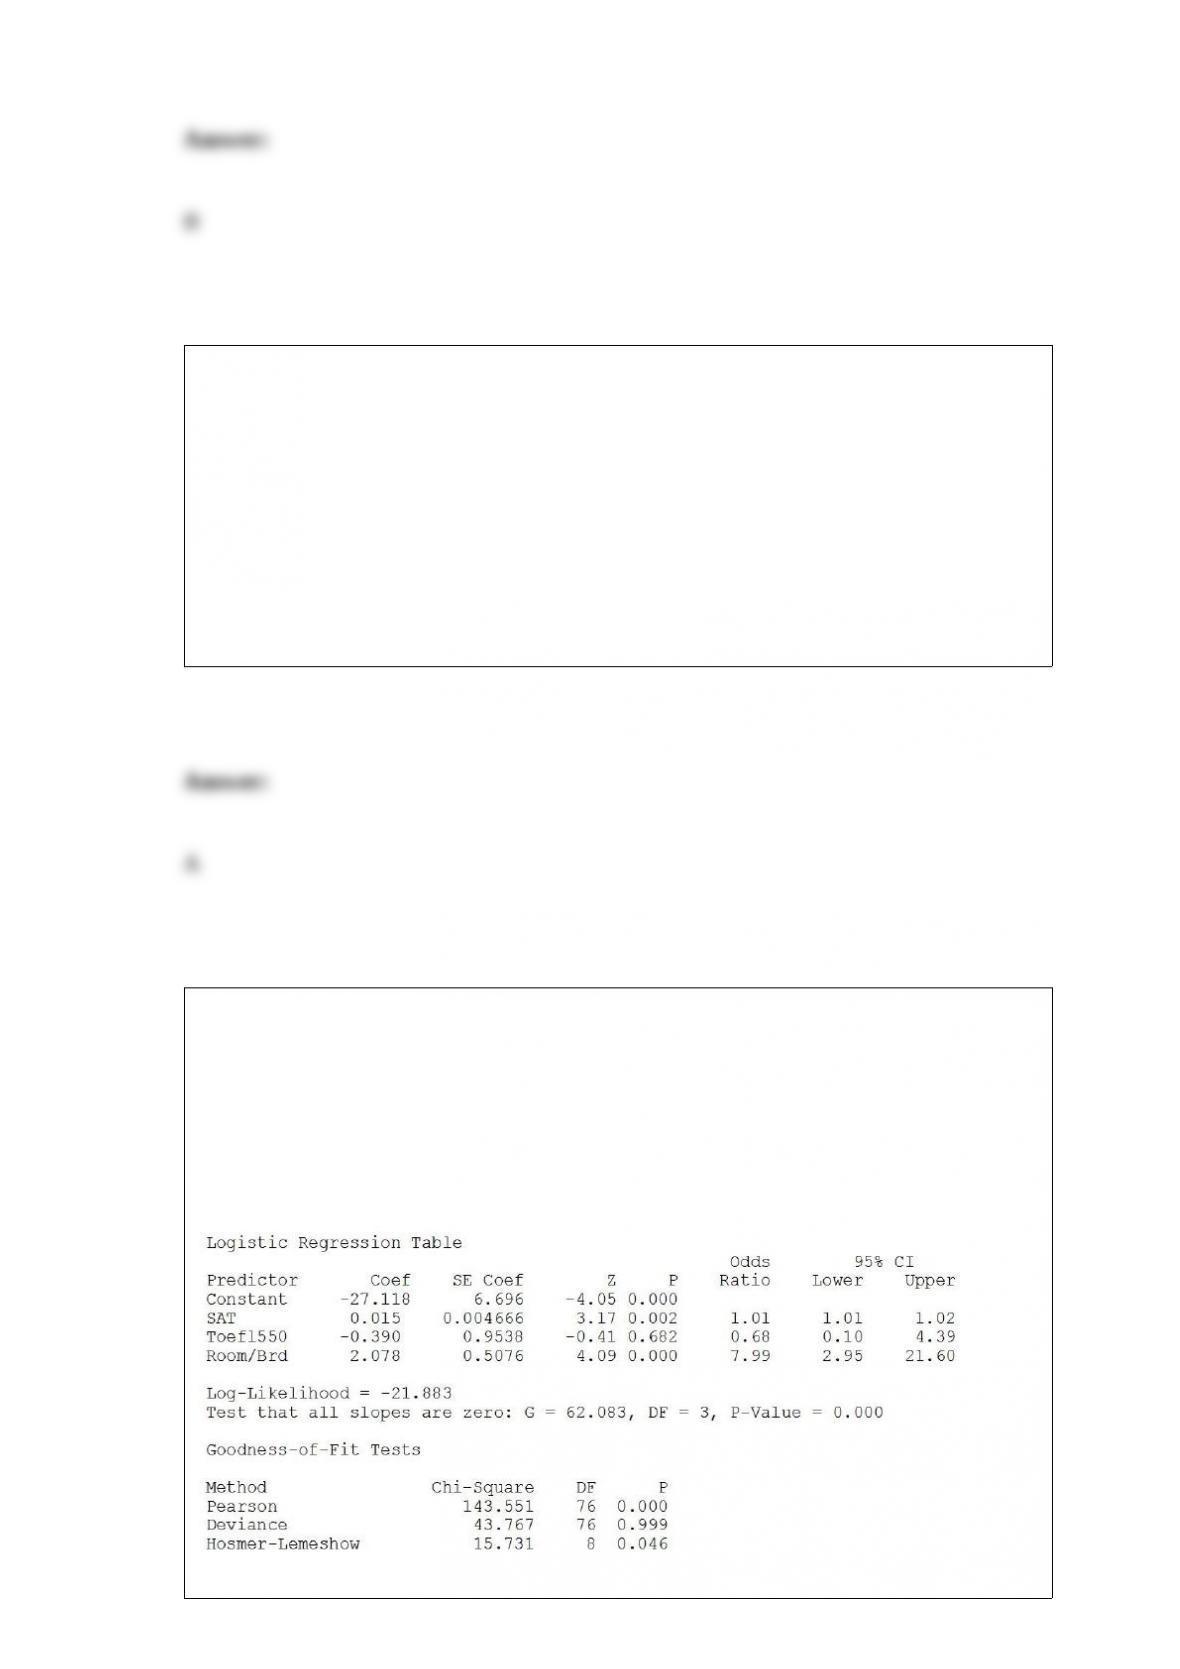
TABLE 17-11
A logistic regression model was estimated in order to predict the probability that a
randomly chosen university or college would be a private university using information
on mean total Scholastic Aptitude Test score (SAT) at the university or college, the
room and board expense measured in thousands of dollars (Room/Brd), and whether the
TOEFL criterion is at least 550 (Toefl550 = 1 if yes, 0 otherwise.) The dependent
variable, Y, is school type (Type = 1 if private and 0 otherwise).
Referring to Table 17-11, which of the following is the correct interpretation for the

Tofel500 slope coefficient?
A) Holding constant the effect of the other variables, the estimated mean value of
school type is 0.39 lower when the school has a TOEFL criterion that is at least 550.
B) Holding constant the effect of the other variables, the estimated school type
decreases by 0.39 when the school has a TOEFL criterion that is at least 550.
C) Holding constant the effect of the other variables, the estimated natural logarithm of
the odds ratio of the school being a private school is 0.39 lower for a school that has a
TOEFL criterion that is at least 550 than one that does not.
D) Holding constant the effect of the other variables, the estimated probability of the
school being a private school is 0.39 lower for a school that has a TOEFL criterion that
is at least 550 than one that does not.
A study is under way in Yosemite National Forest to determine the adult height of
American pine trees. Specifically, the study is attempting to determine what factors aid
a tree in reaching heights greater than 60 feet tall. It is estimated that the forest contains
25,000 adult American pines. The study involves collecting heights from 250 randomly
selected adult American pine trees and analyzing the results. Identify the variable of
interest in the study.
A) The age of an American pine tree in Yosemite National Forest
B) The height of an American pine tree in Yosemite National Forest
C) The number of American pine trees in Yosemite National Forest
D) The species of trees in Yosemite National Forest
According to a survey of American households, the probability that the residents own 2
cars if annual household income is over $50,000 is 80%. Of the households surveyed,
60% had incomes over $50,000 and 70% had 2 cars. The probability that annual

household income is over $50,000 if the residents of a household own 2 cars is
A) 0.42.
B) 0.48.
C) 0.50.
D) 0.69.
An agronomist wants to compare the crop yield of 3 varieties of chickpea seeds. She
plants all 3 varieties of the seeds on each of 5 different patches of fields. She then
measures the crop yield in bushels per acre. She has found out that the different
varieties do have an impact on crop yield. Which of the following tests will be the most
appropriate to find out which variety will produce the highest yield?
A) One-way ANOVA F test for differences among more than two means
B) McNemar test
C) Tukey-Kramer multiple comparisons procedure for one-way ANOVA
D) Tukey multiple comparisons procedure for randomized block designs
Which of the arithmetic mean, median, mode, and geometric mean are resistant
measures of central tendency?
A) the arithmetic mean and median only
B) the median and mode only
C) the mode and geometric mean only
D) the arithmetic mean and mode only
A company has 2 machines that produce widgets. An older machine produces 23%
defective widgets, while the new machine produces only 8% defective widgets. In
addition, the new machine produces 3 times as many widgets as the older machine
does. Given that a randomly chosen widget was tested and was found to be defective,
what is the probability that it was produced by the new machine?
A) 0.08
B) 0.15
C) 0.489
D) 0.511
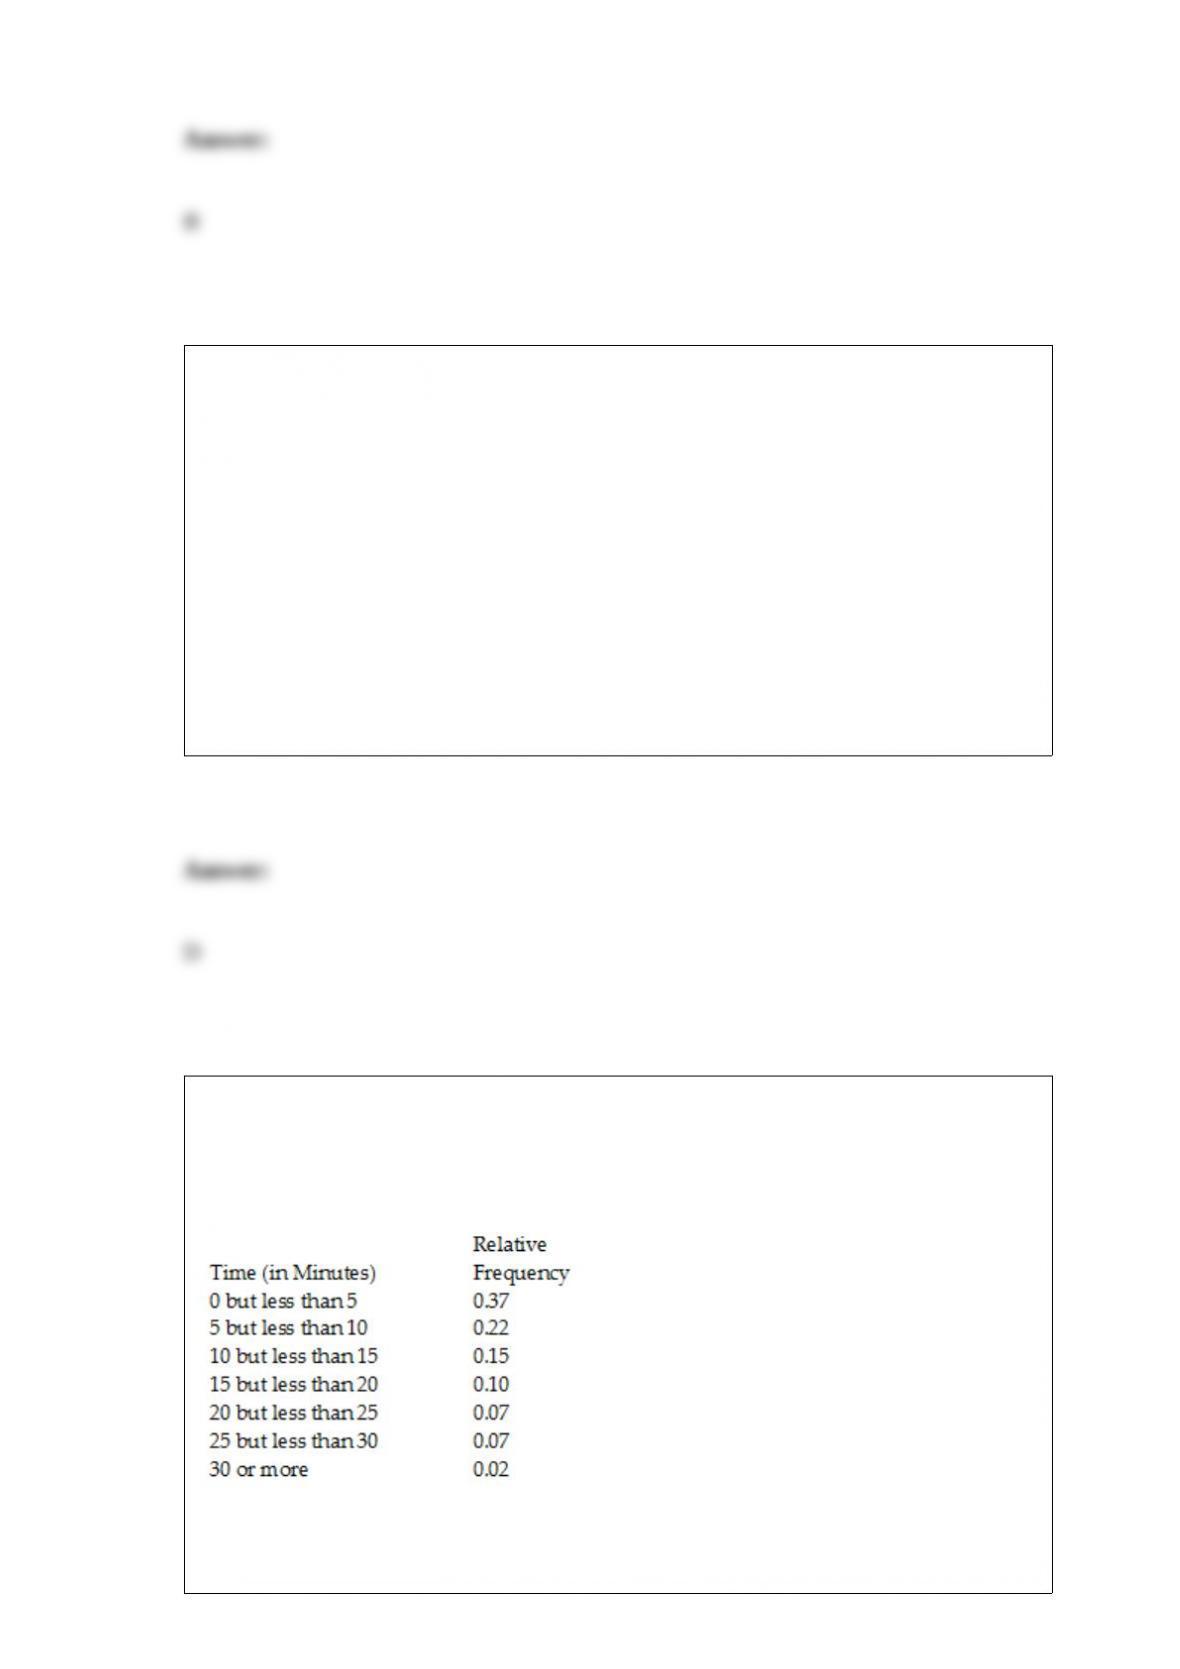
TABLE 2-5
The following are the duration in minutes of a sample of long-distance phone calls
made within the continental United States reported by one long-distance carrier.
Referring to Table 2-5, if 100 calls were randomly sampled, how many calls lasted 15
minutes or longer?

A) 10
B) 14
C) 26
D) 74
A study attempted to estimate the proportion of Florida residents who were willing to
spend more tax dollars on protecting the beaches from environmental disasters.
Twenty-five hundred Florida residents were surveyed. What type of data collection
procedure was most likely used to collect the data for this study?
A) a designed experiment
B) a published source
C) a random sample
D) observational data
An entrepreneur is considering the purchase of a coin-operated laundry. The current
owner claims that over the past 5 years, the mean daily revenue was $675 with a
population standard deviation of $75. A sample of 30 days reveals a daily mean revenue
of $625. If you were to test the null hypothesis that the daily mean revenue was $675,
which test would you use?
A) Z test of a population mean
B) Z test of a population proportion
C) t test of population mean
D) t test of a population proportion
Which of the following statistics is not a measure of central tendency?
A) arithmetic mean.
B) median
C) mode
D) Q3
Which of the following is not an element of descriptive statistical problems?
A) An inference made about the population based on the sample
B) The population or sample of interest
C) Tables, graphs, or numerical summary tools
D) Identification of patterns in the data
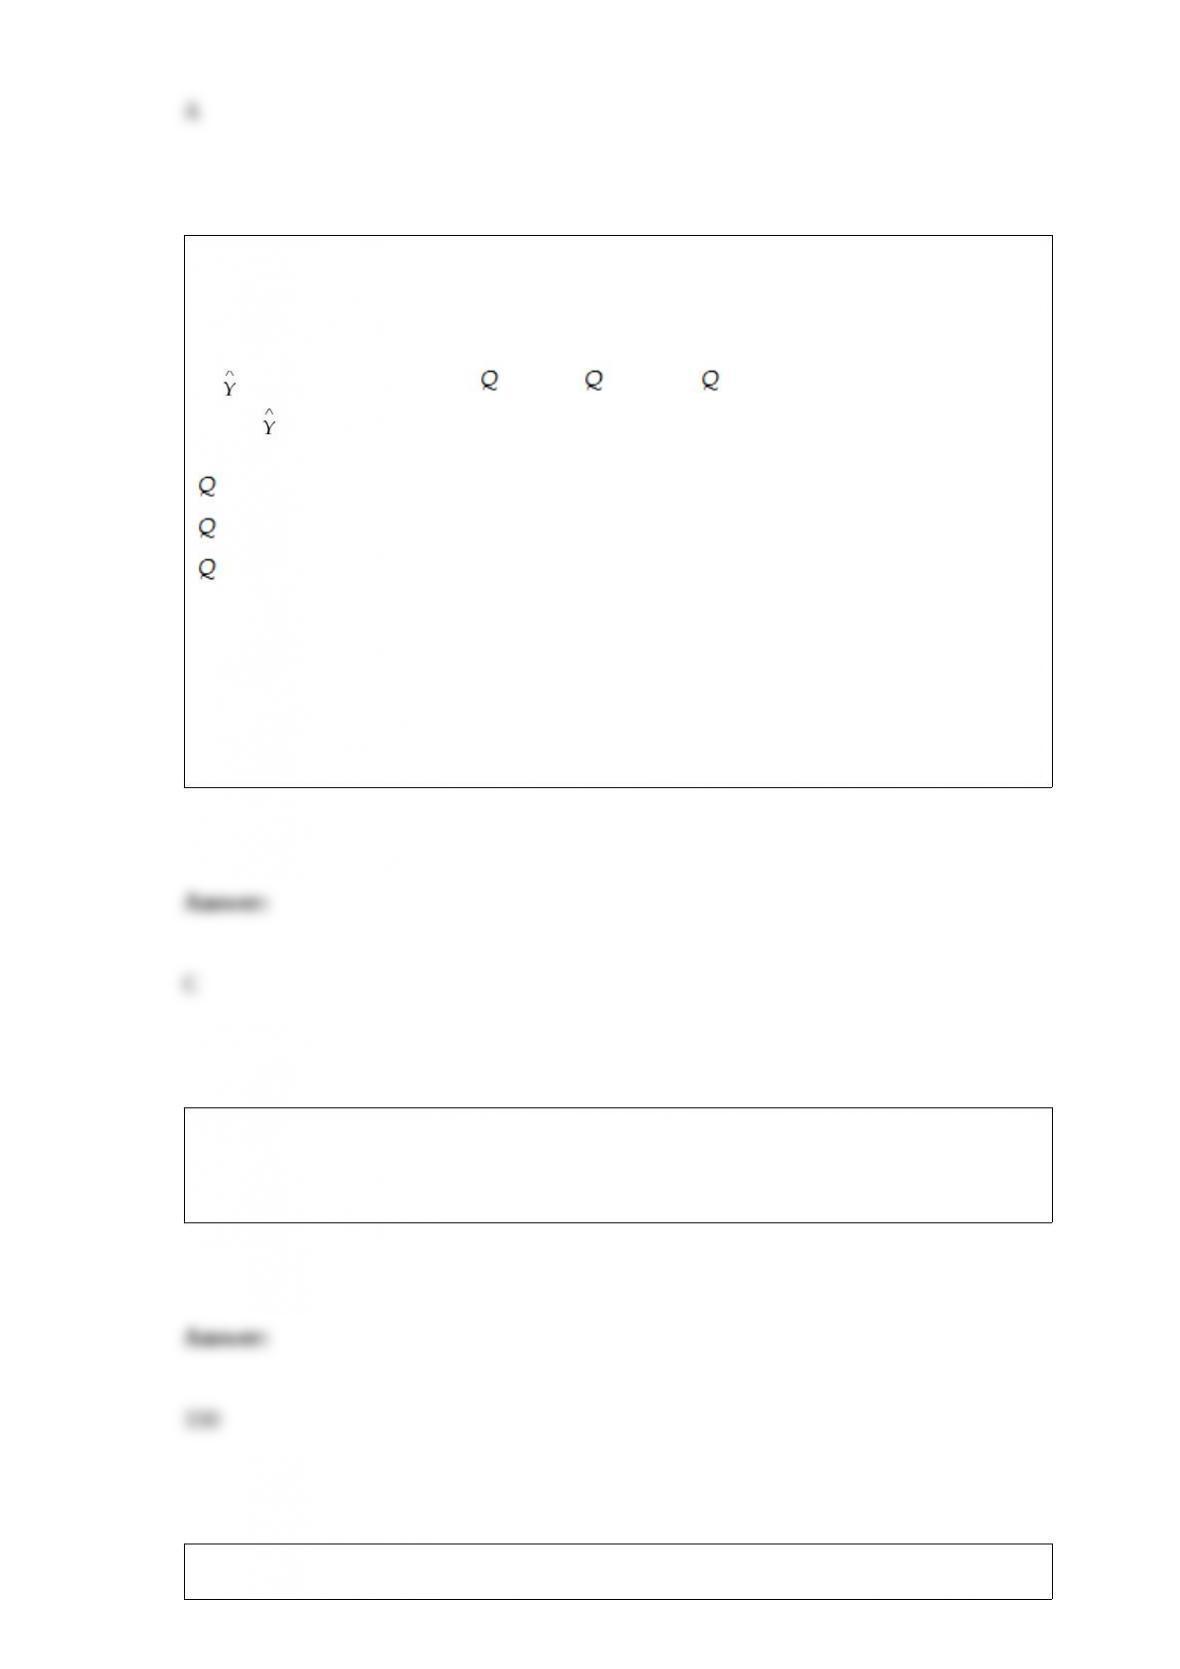
TABLE 16-14
A contractor developed a multiplicative time-series model to forecast the number of
contracts in future quarters, using quarterly data on number of contracts during the
3-year period from 2010 to 2012. The following is the resulting regression equation:
ln = 3.37 + 0.117 X – 0.083 1 + 1.28 2 + 0.617 3
where is the estimated number of contracts in a quarter
X is the coded quarterly value with X = 0 in the first quarter of 2010
1 is a dummy variable equal to 1 in the first quarter of a year and 0 otherwise
2 is a dummy variable equal to 1 in the second quarter of a year and 0 otherwise
3 is a dummy variable equal to 1 in the third quarter of a year and 0 otherwise
Referring to Table 16-14, using the regression equation, which of the following values
is the best forecast for the number of contracts in the third quarter of 2013?
A) 49,091
B) 133,352
C) 421,697
D) 1,482,518
Four freshmen are to be assigned to eleven empty rooms in a student dormitory. All the
rooms are considered as homogenous so that it does not matter who is being assigned to
which room. How many different ways can those 4 freshmen be assigned?
TABLE 16-16
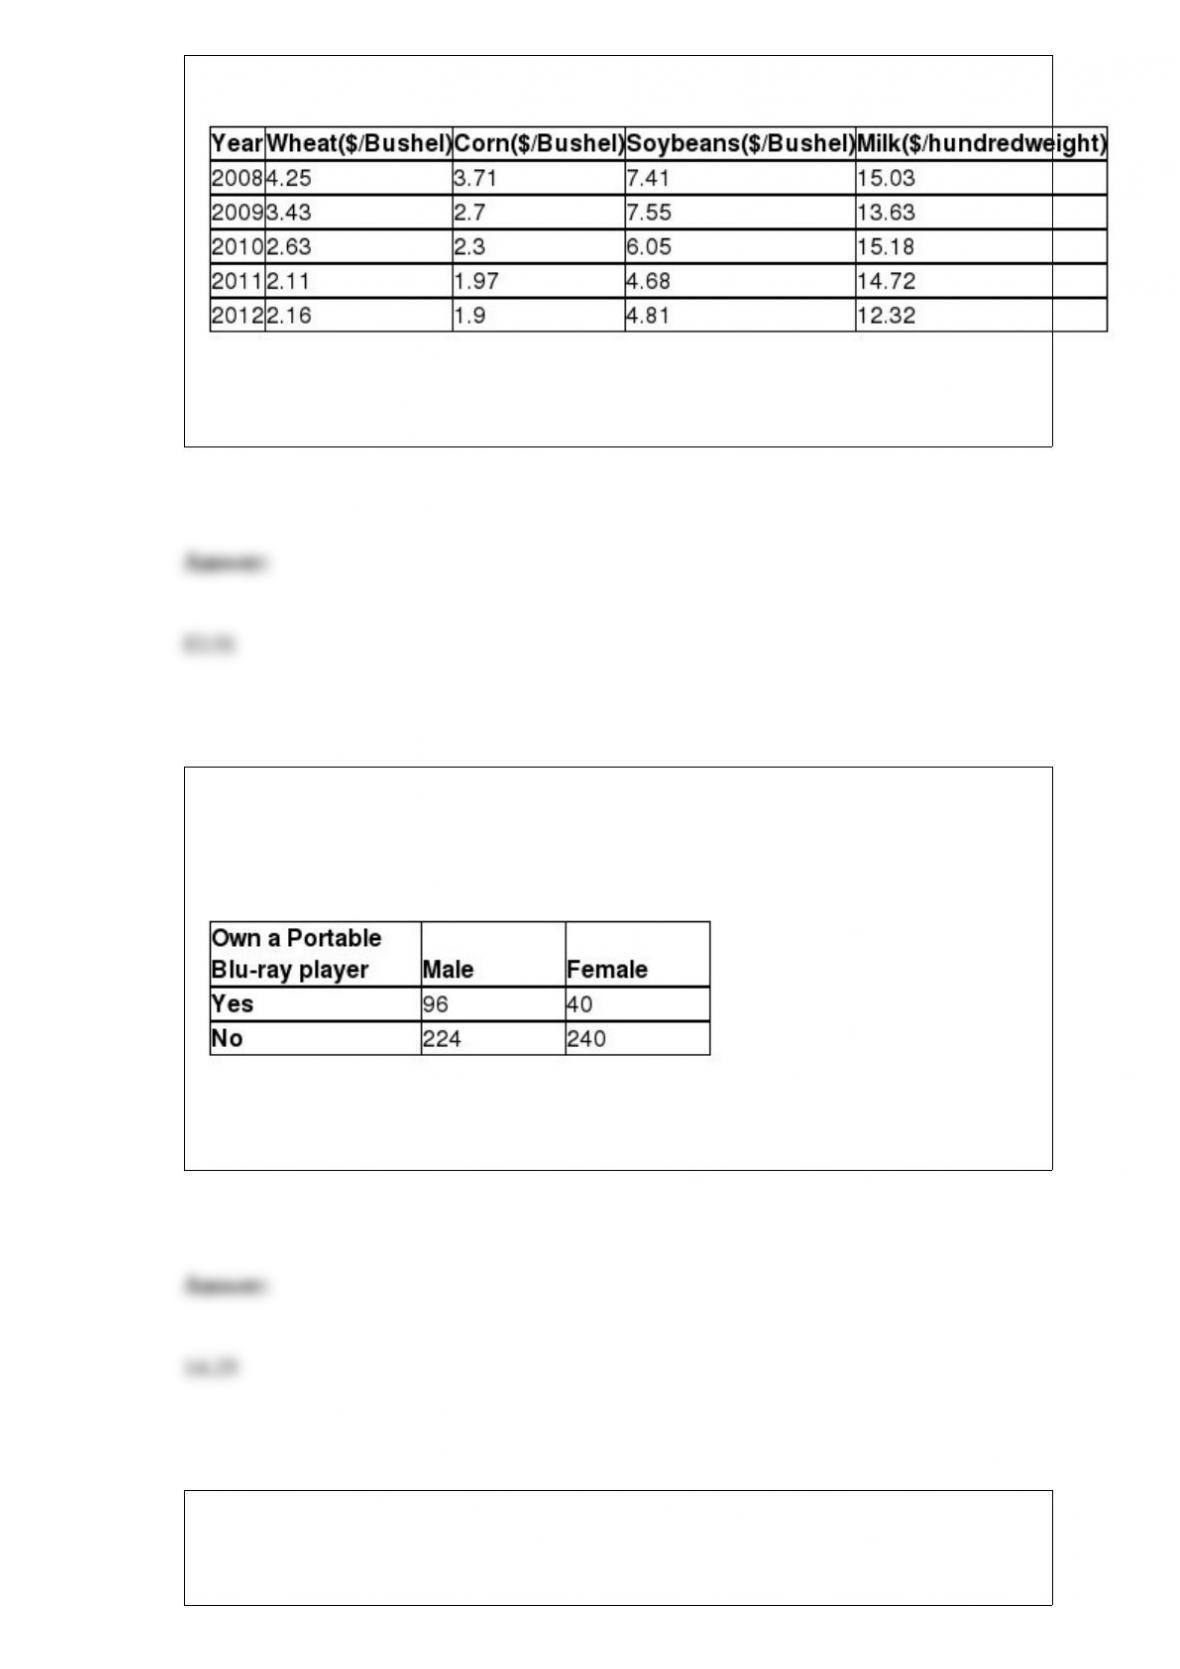
Given below are the prices of a basket of four food items from 2008 to 2012.
Referring to Table 16-16, what is the Laspeyres price index for the basket of four food
items in 2011 that consisted of 50 bushels of wheat, 30 bushels of corn, 40 bushels of
soybeans and 80 hundredweight of milk in 2008 using 2008 as the base year?
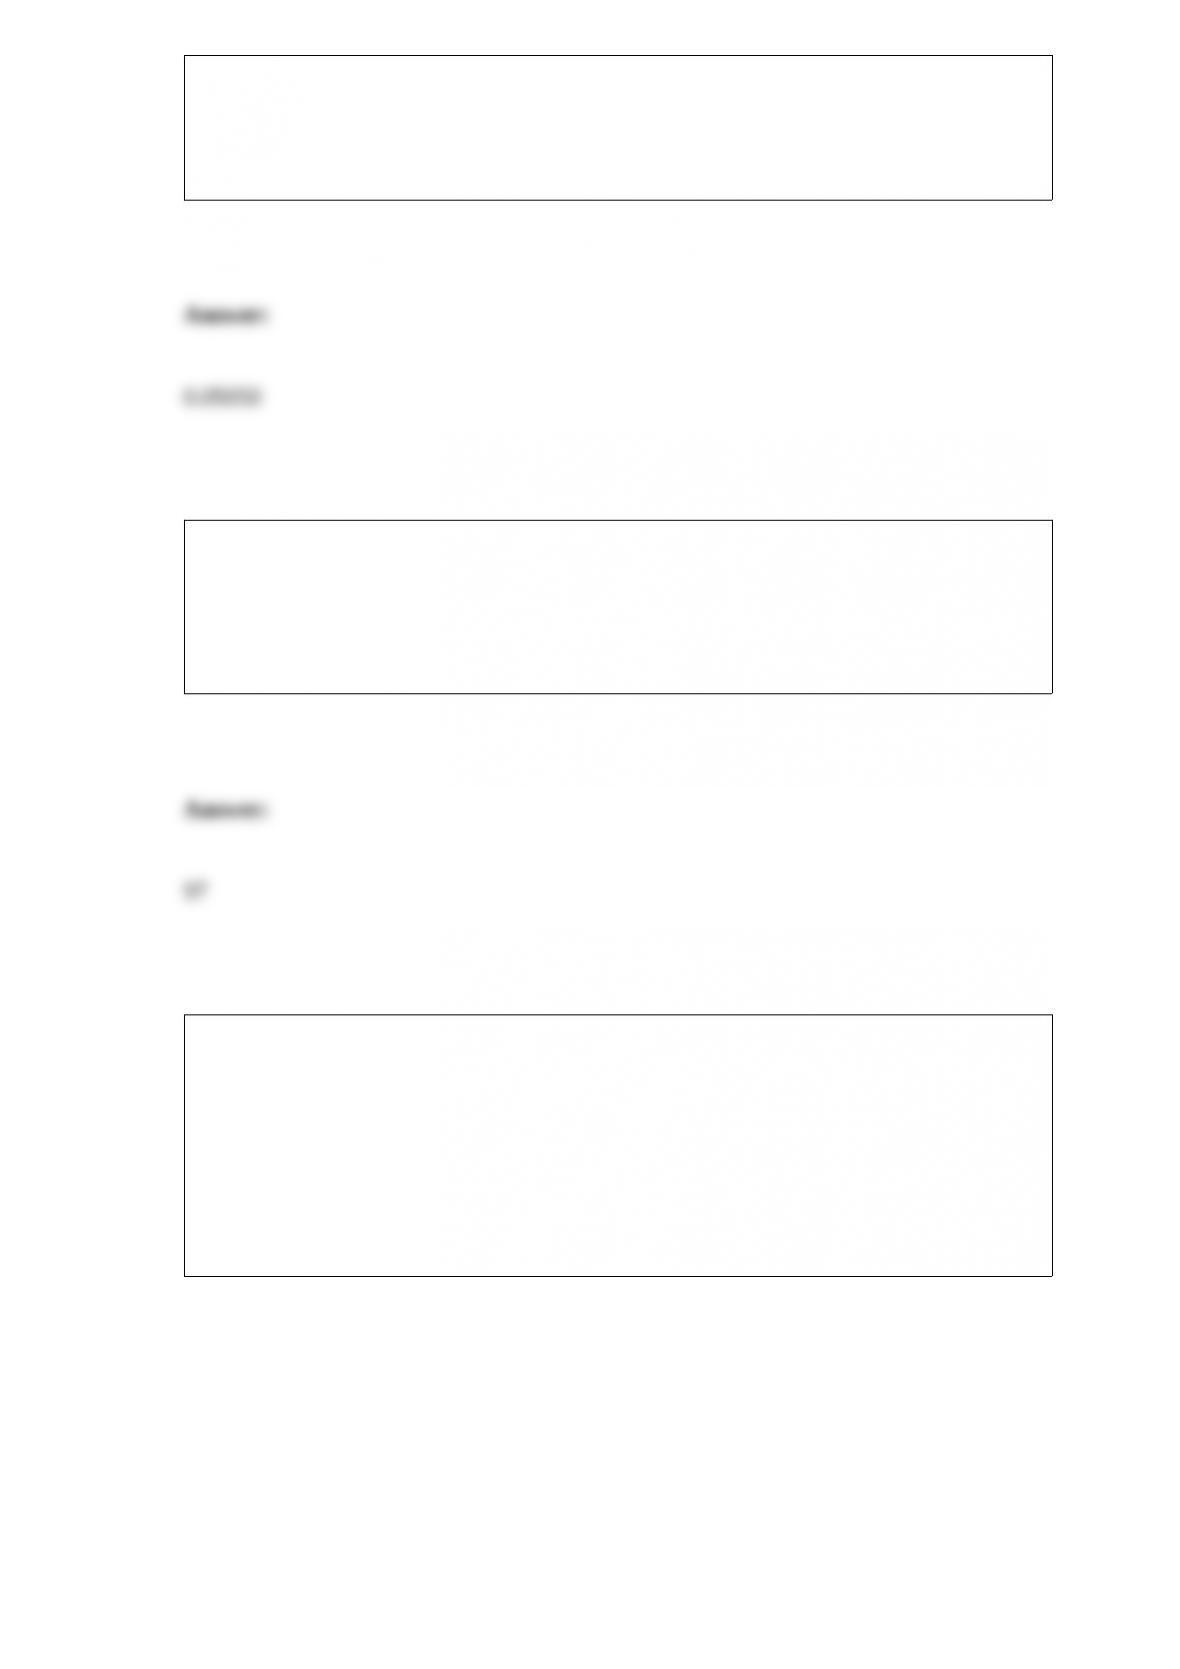
TABLE 2-14
The table below contains the number of people who own a portable Blu-ray player in a
sample of 600 broken down by gender.
Referring to Table 2-14, of the females in the sample, ________ percent owned a
portable Blu-ray player.
TABLE 7-4
According to a survey, only 15% of customers who visited the website of a major retail
store made a purchase. Random sample sizes of 50 are selected.
Referring to Table 7-4, the standard deviation of all the sample proportions of
customers who will make a purchase after visiting the website is ________.
The head of a computer science department is interested in estimating the proportion of
students entering the department who will choose the new computer engineering option.
Suppose there is no information about the proportion of students who might choose the
option. What size sample should the department head take if she wants to be 95%
confident that the estimate is within 0.10 of the true proportion?
Referring to Table 14-4, what is the value of the calculated F test statistic that is
missing from the output for testing whether the whole regression model is significant?
TABLE 14-4
A real estate builder wishes to determine how house size (House) is influenced by
family income (Income) and family size (Size). House size is measured in hundreds of
square feet and income is measured in thousands of dollars. The builder randomly
selected 50 families and ran the multiple regression. Partial Microsoft Excel output is
provided below:
Also SSR (X1∣ X2) = 36400.6326 and SSR (X2∣ X1) = 3297.7917
A debate team of 4 members for a high school will be chosen randomly from a potential
group of 15 students. Ten of the 15 students have no prior competition experience while
the others have some degree of experience. What is the probability that exactly half of
the members chosen for the team have some prior competition experience?