
True or False: Percentage polygons are plotted at the boundaries of the class groupings.
True or False: When participants are allowed to self-select into the sample, you have a
nonprobability sample.
True or False: In trying to construct a model to estimate grades on a
statistics test, a professor wanted to include, among other factors,
whether the person had taken the course previously. To do this, the
professor included a dummy variable in her regression model that
was equal to 1 if the person had previously taken the course, and 0
otherwise. The interpretation of the coe!cient associated with this
dummy variable would be the mean amount the repeat students
tended to be above or below non-repeaters, with all other factors the
same.
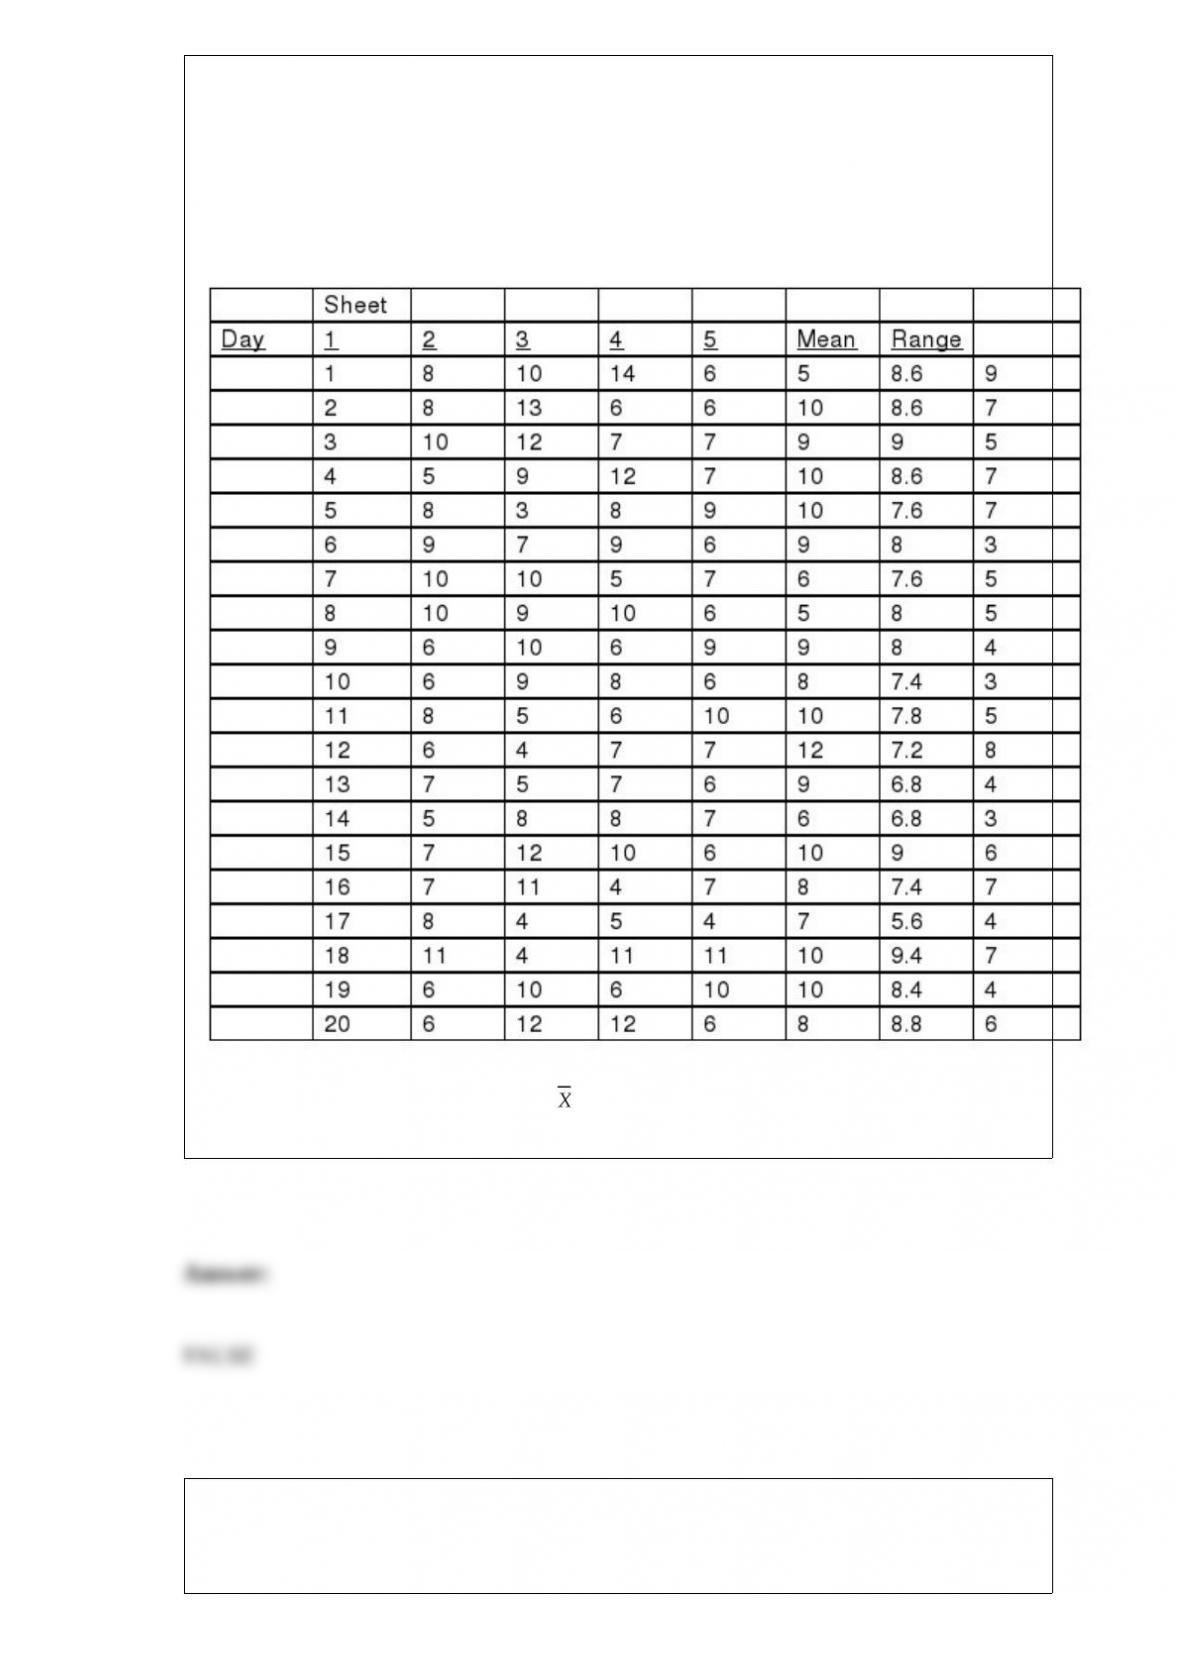
True or False: TABLE 18-7
A supplier of silicone sheets for producers of computer chips wants to evaluate her
manufacturing process. She takes sample sizes of 5 from each day’s output and counts
the number of blemishes on each silicone sheet. The results from 20 days of such
evaluations are presented below.
She also decides that the upper specification limit is 10 blemishes.
Referring to Table 18-7, based on the chart for the number of blemishes, it appears
that the process is out of control.
True or False: TABLE 17-8
The superintendent of a school district wanted to predict the percentage of students
passing a sixth-grade proficiency test. She obtained the data on percentage of students
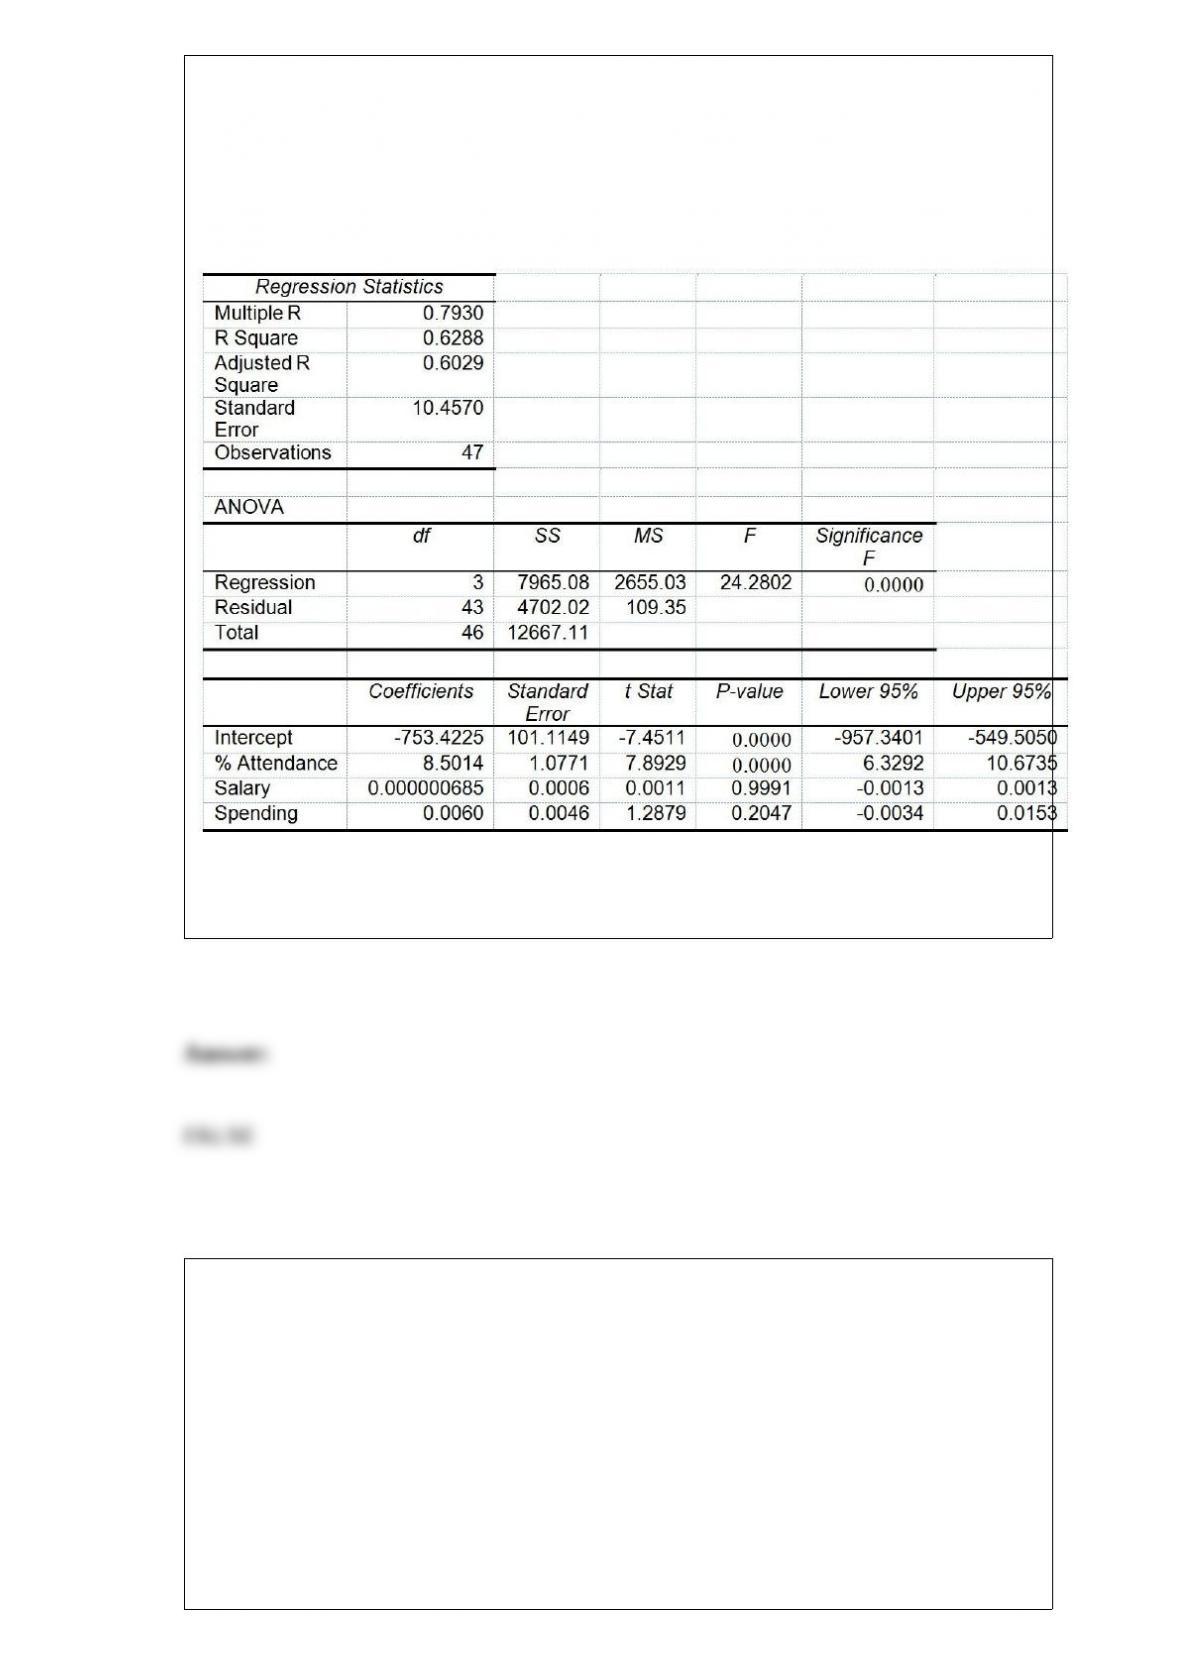
passing the proficiency test (% Passing), daily mean of the percentage of students
attending class (% Attendance), mean teacher salary in dollars (Salaries), and
instructional spending per pupil in dollars (Spending) of 47 schools in the state.
Following is the multiple regression output with Y = % Passing as the dependent
variable, X1 = % Attendance, X2 = Salaries and X3 = Spending:
Referring to Table 17-8, there is sufficient evidence that the percentage of students
passing the proficiency test depends on all of the explanatory variables at a 5% level of
significance.
True or False: TABLE 17-12
The marketing manager for a nationally franchised lawn service company would like to
study the characteristics that differentiate home owners who do and do not have a lawn
service. A random sample of 30 home owners located in a suburban area near a large
city was selected; 15 did not have a lawn service (code 0) and 15 had a lawn service
(code 1). Additional information available concerning these 30 home owners includes
family income (Income, in thousands of dollars), lawn size (Lawn Size, in thousands of
square feet), attitude toward outdoor recreational activities (Attitude 0 = unfavorable, 1
= favorable), number of teenagers in the household (Teenager), and age of the head of
the household (Age).
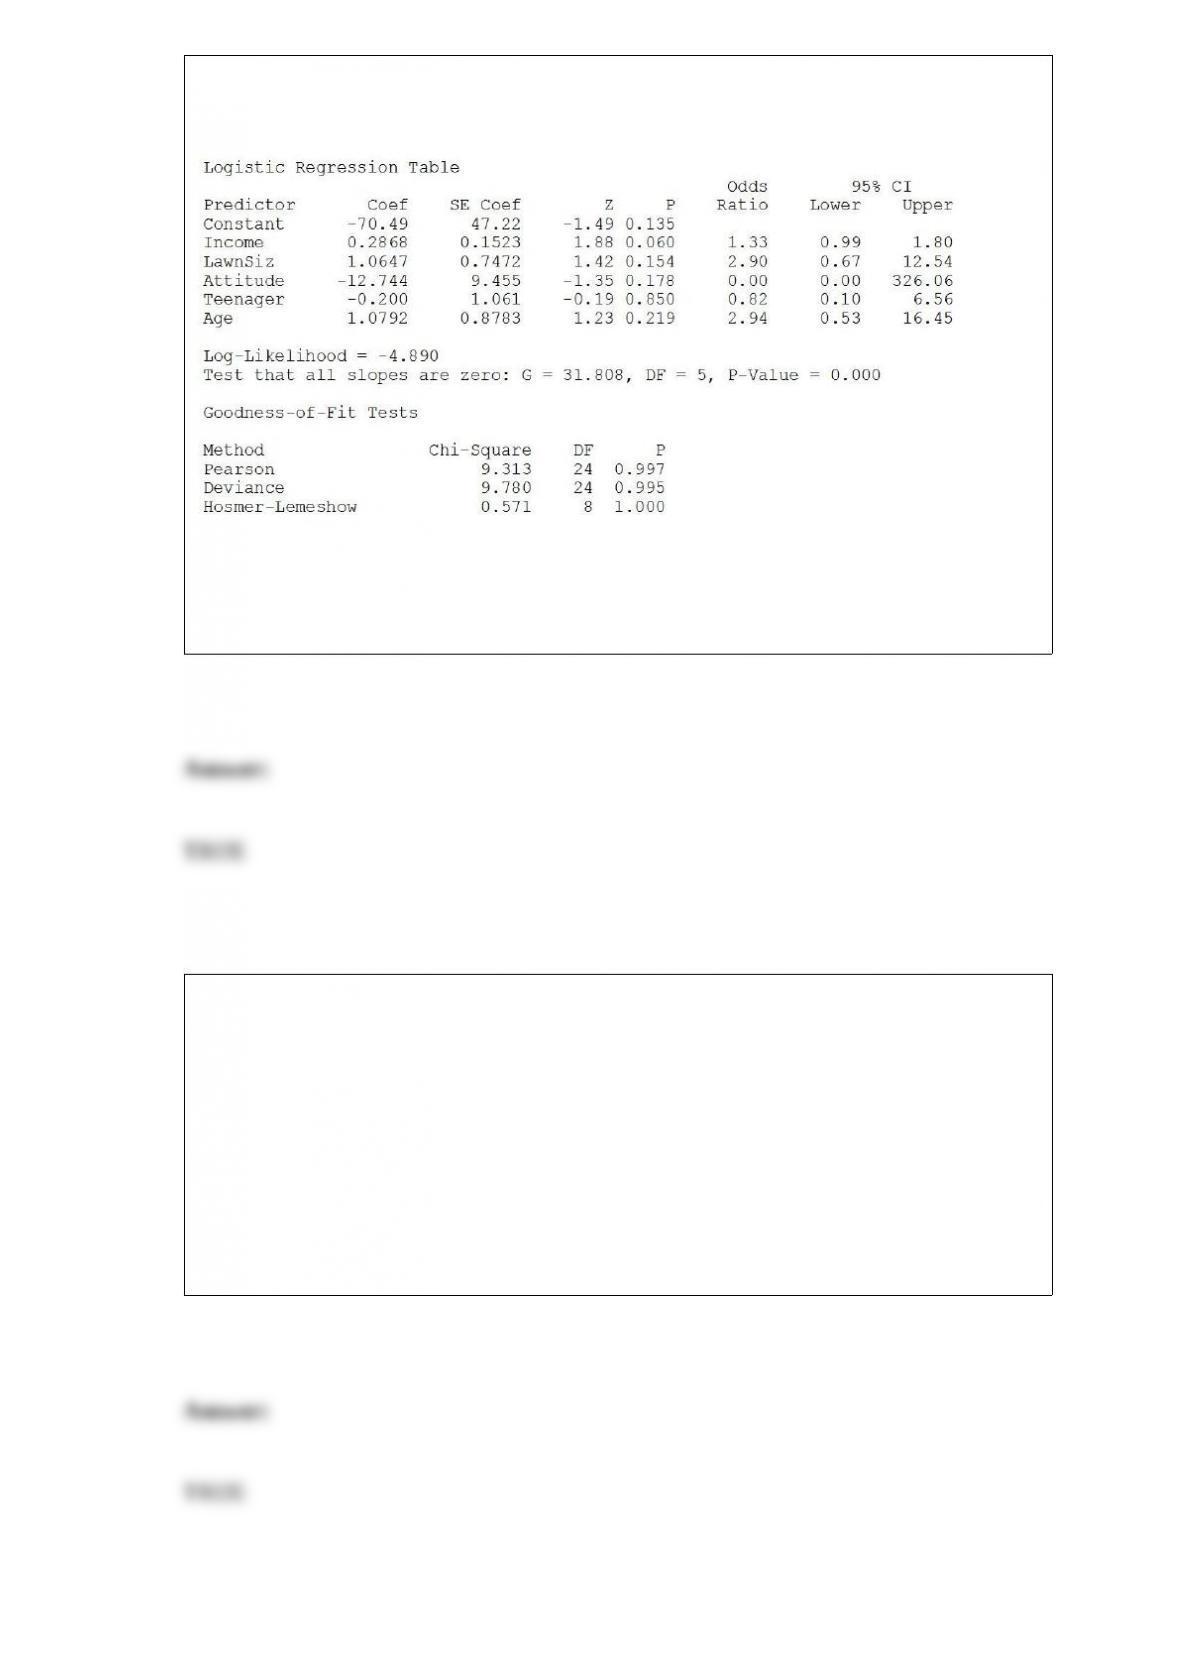
The Minitab output is given below:
Referring to Table 17-12, there is not enough evidence to conclude that Income makes
a significant contribution to the model in the presence of the other independent
variables at a 0.05 level of significance.
TABLE 8-7
A hotel chain wants to estimate the mean number of rooms rented daily in a given
month. The population of rooms rented daily is assumed to be normally distributed for
each month with a standard deviation of 240 rooms. During February, a sample of 25
days has a sample mean of 370 rooms.
True or False: Referring to Table 8-7, it is possible that the 99% confidence interval
calculated from the data will not contain the population mean number of rooms rented
daily in a given month.
True or False: The grade level (K-12) of a student is an example of a numerical
variable.
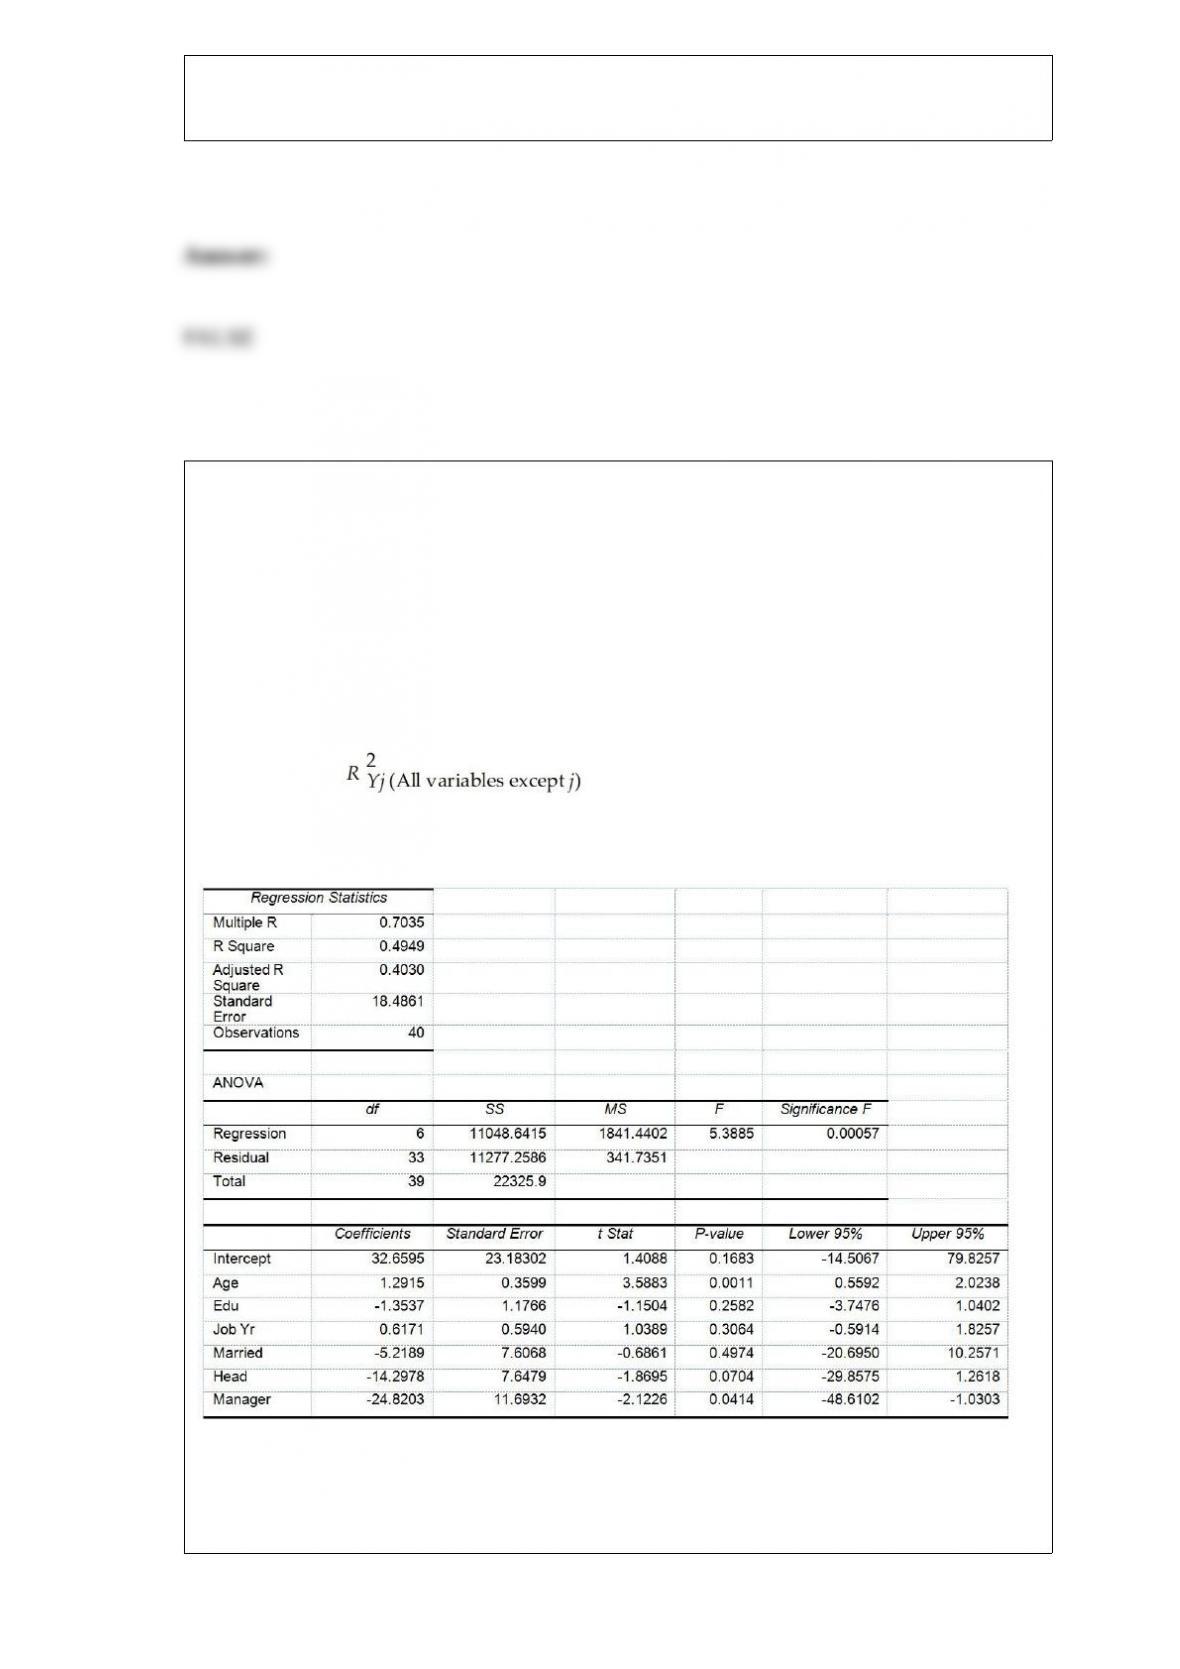
True or False: TABLE 17-10
Given below are results from the regression analysis where the dependent variable is
the number of weeks a worker is unemployed due to a layoff (Unemploy) and the
independent variables are the age of the worker (Age), the number of years of education
received (Edu), the number of years at the previous job (Job Yr), a dummy variable for
marital status (Married: 1 = married, 0 = otherwise), a dummy variable for head of
household (Head: 1 = yes, 0 = no) and a dummy variable for management position
(Manager: 1 = yes, 0 = no). We shall call this Model 1. The coefficient of partial
determination ( ) of each of the 6 predictors are, respectively,
0.2807, 0.0386, 0.0317, 0.0141, 0.0958, and 0.1201.
Model 2 is the regression analysis where the dependent variable is Unemploy and the
independent variables are Age and Manager. The results of the regression analysis are
given below:
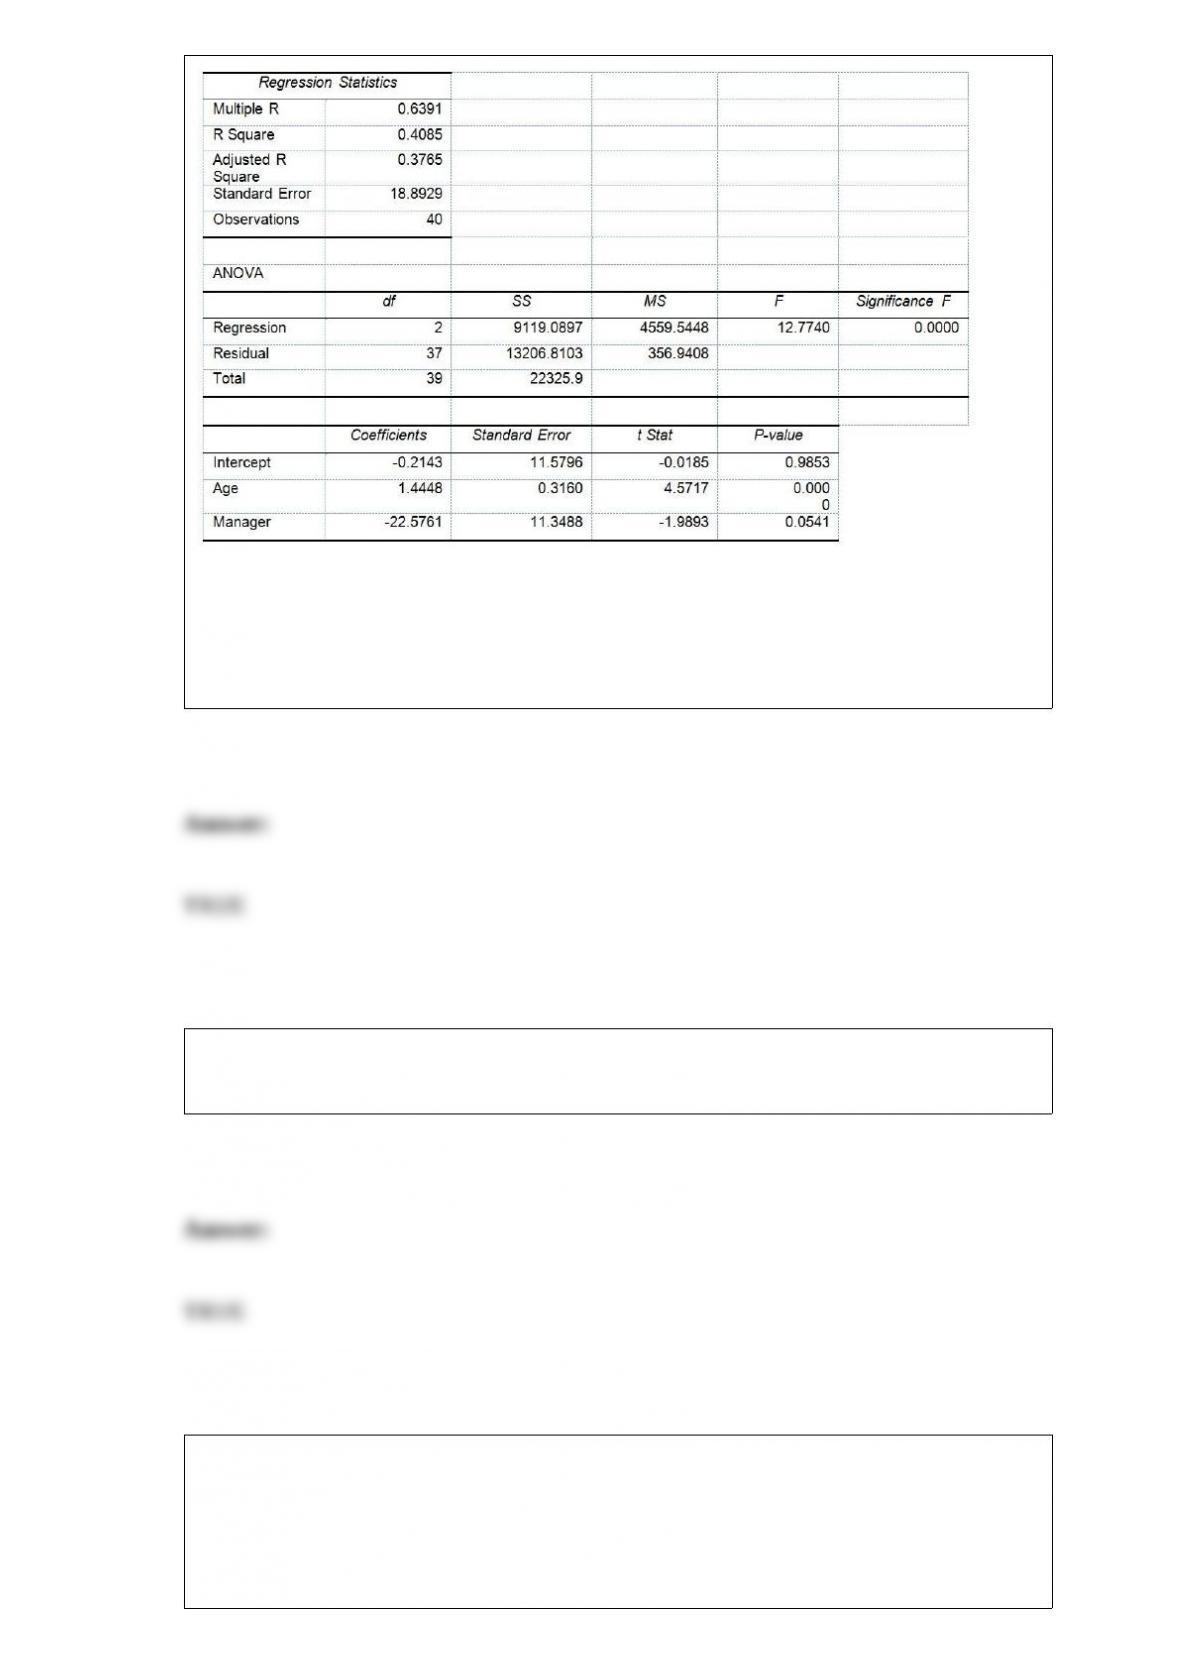
Referring to Table 17-10 and using both Model 1 and Model 2, there is insufficient
evidence to conclude that the independent variables that are not significant individually
are significant as a group in explaining the variation in the dependent variable at a 5%
level of significance.
True or False: The geometric mean is useful in measuring the rate of change of a
variable over time.
TABLE 11-3
As part of an evaluation program, a sporting goods retailer wanted to compare the
downhill coasting speeds of 4 brands of bicycles. She took 3 of each brand and
determined their maximum downhill speeds. The results are presented in miles per hour
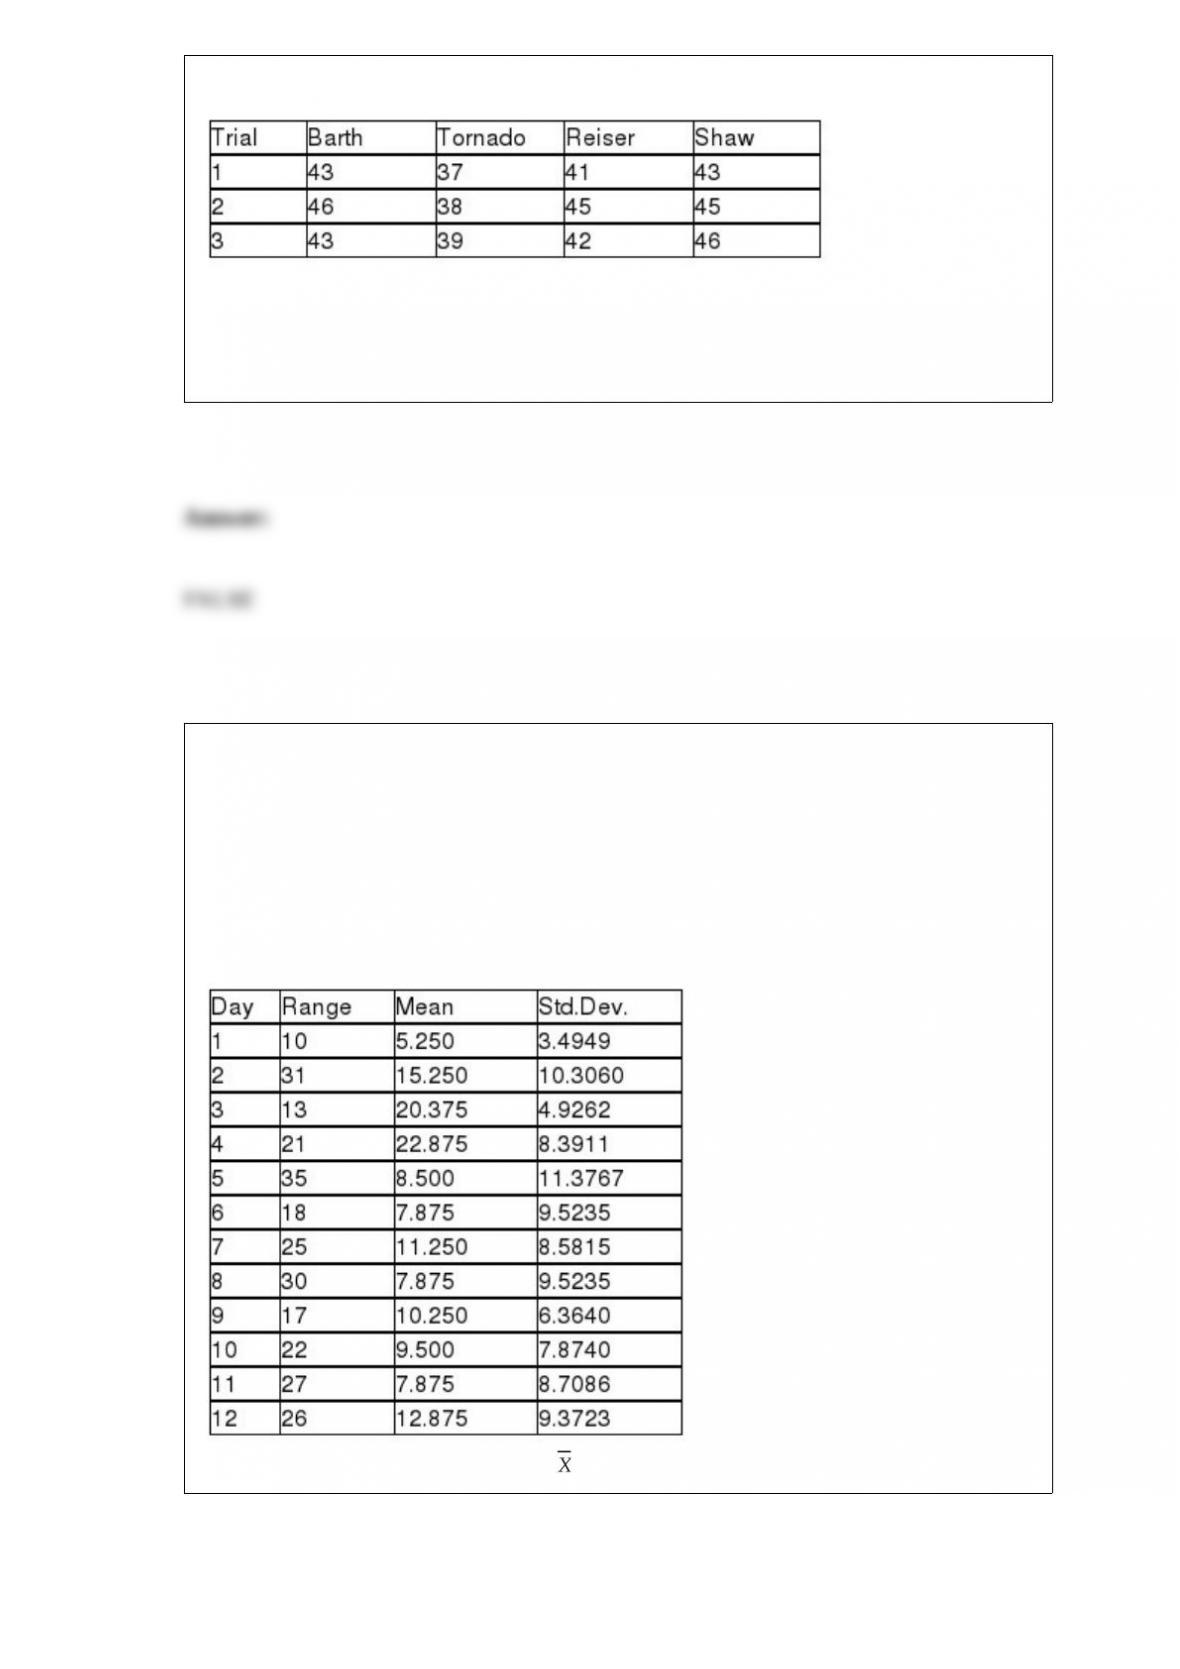
in the table below.
True or False: Referring to Table 11-3, based on the Tukey-Kramer procedure with an
overall level of significance of 0.05, the retailer would decide that there is no significant
difference between any pair of mean speeds.
True or False: TABLE 18-8
Recently, a university switched to a new type of computer-based registration. The
registrar is concerned with the amount of time students are spending on the computer
registering under the new system. She decides to randomly select 8 students on each of
the 12 days of the registration and determine the time each spends on the computer
registering. The range, mean, and standard deviation of the times required to register are
in the table that follows.
Referring to Table 18-8, based on the chart, it appears that the process is in control.

TABLE 8-10
A sales and marketing management magazine conducted a survey on salespeople
cheating on their expense reports and other unethical conduct. In the survey on 200
managers, 58% of the managers have caught salespeople cheating on an expense report,
50% have caught salespeople working a second job on company time, 22% have caught
salespeople listing a ‘strip bar” as a restaurant on an expense report, and 19% have
caught salespeople giving a kickback to a customer.
True or False: Referring to Table 8-10, we are 95% confident that between 51.16% and
64.84% of managers in the population have caught salespeople cheating on an expense
report.
The use of preservatives by food processors has become a controversial issue. Suppose
2 preservatives are extensively tested and determined safe for use in meats. A processor
wants to compare the preservatives for their effects on retarding spoilage. They will
choose to use the preservative that can keep the meat fresh for the longest amount of
time. Suppose 15 cuts of fresh meat are treated with preservative I and 15 are treated
with preservative II, and the number of hours until spoilage begins is recorded for each
of the 30 cuts of meat. Suppose the variability of the number of hours until spoilage is
the same for meat treated by both preservatives but the normal probability plots reveal
that the number of hours until spoilage is right-skewed for the 15 cuts treated by
preservative I and left-skewed for the 15 cuts treated with preservative II. Which of the
following tests will be the most appropriate?
A) Pooled-variance t test
B) Paired t test
C) Wilcoxon rank sum test
D) Levene’s test

When determining the sample size for a proportion for a given level of confidence and
sampling error, the closer to 0.50 that is estimated to be, the sample size required
A) is smaller.
B) is larger.
C) is not affected.
D) can be smaller, larger or unaffected.
Data on the number of credit hours of 20,000 students at a public university enrolled in
a spring semester were collected. Which of the following is the best for presenting the
information?
A) a pie chart
B) a Pareto chart
C) a stem-and-leaf display
D) a contingency table
Referring to Table 14-3, what is the predicted consumption level for an economy with
GDP equal to $4 billion and an aggregate price index of 150?
A) $1.39 billion
B) $2.89 billion
C) $4.75 billion
D) $9.45 billion
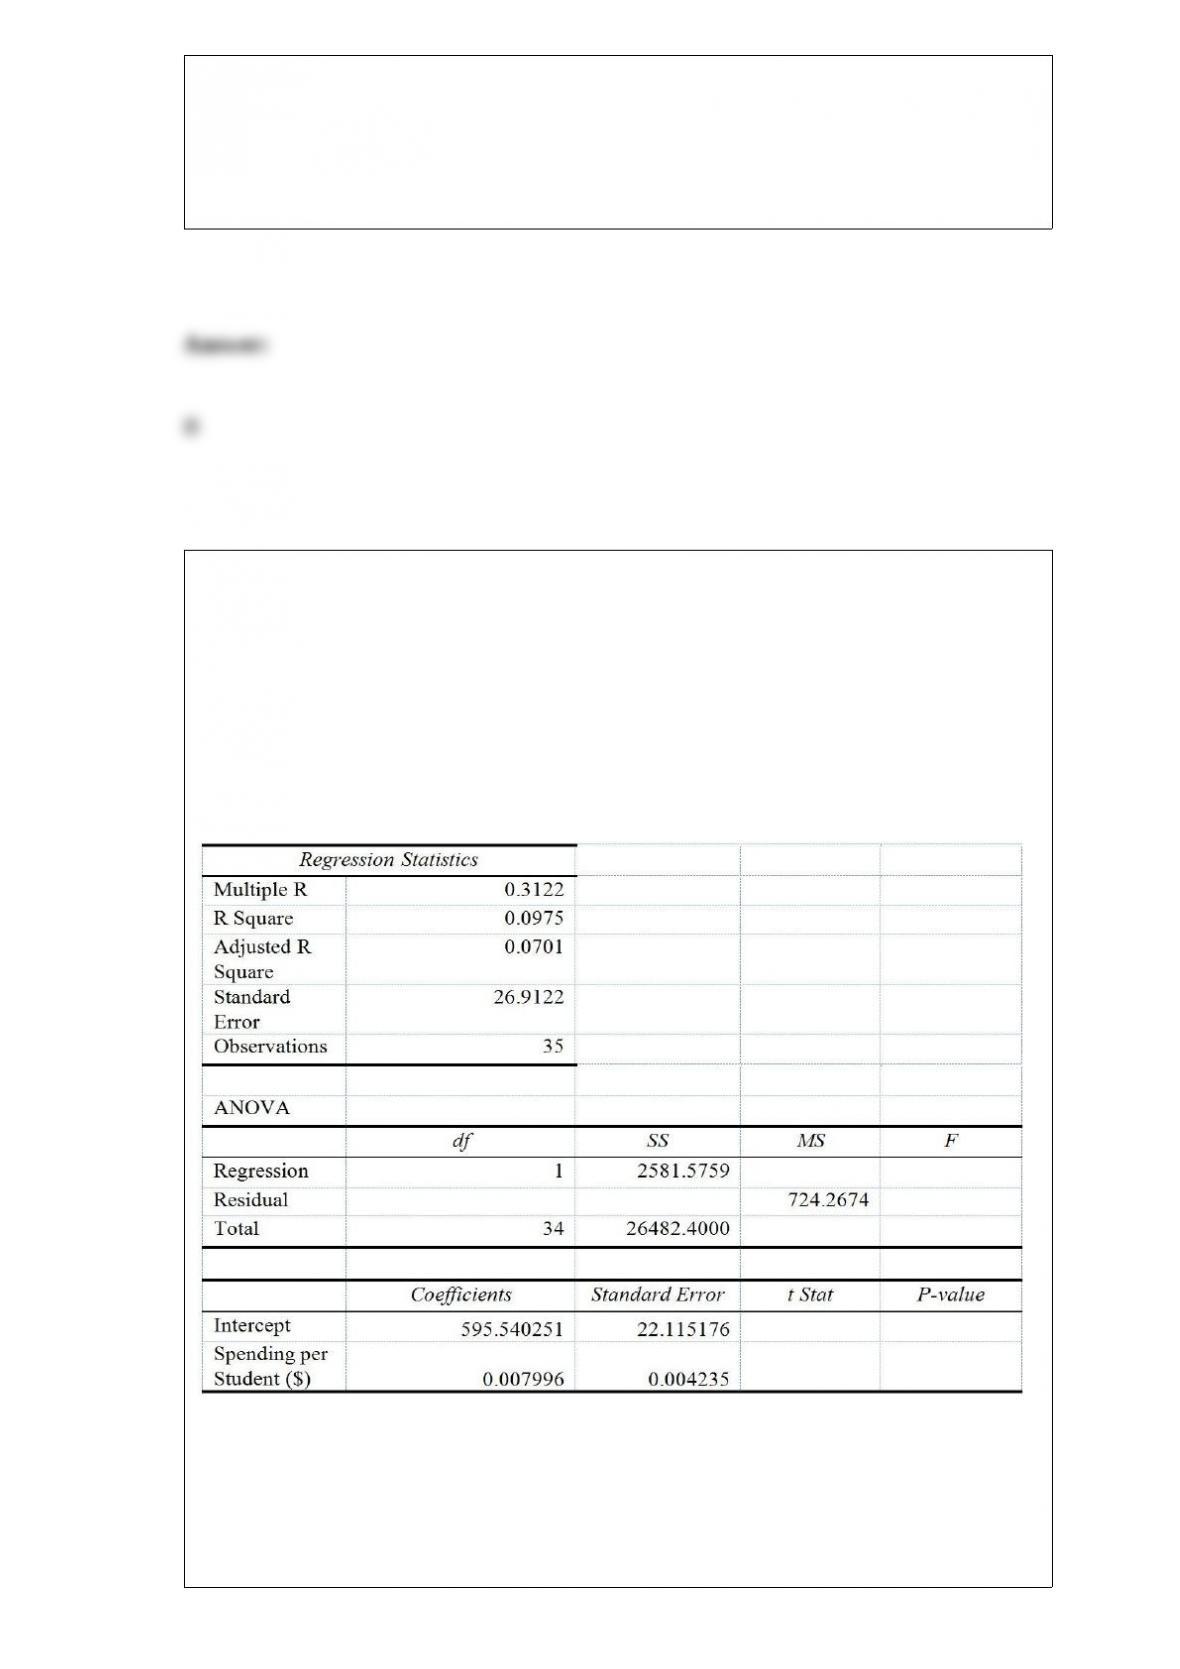
TABLE 13-13
In this era of tough economic conditions, voters increasingly ask the question: “Is the
educational achievement level of students dependent on the amount of money the state
in which they reside spends on education?” The partial computer output below is the
result of using spending per student ($) as the independent variable and composite score
which is the sum of the math, science and reading scores as the dependent variable on
35 states that participated in a study. The table includes only partial results.
Referring to Table 13-13, the conclusion on the test of whether composite score
depends linearly on spending per student using a 10% level of significance is that
A) there is not enough evidence that composite score does not depend linearly on
spending per student.
B) there is enough evidence that composite score does not depend linearly on spending
per student.
C) there is not enough evidence that composite score depends linearly on spending per
student.
D) there is enough evidence that composite score depends linearly on spending per
student.
Blossom’s Flowers purchases roses for sale for Valentine’s Day. The roses are purchased
for $10 a dozen and are sold for $20 a dozen. Any roses not sold on Valentine’s Day can
be sold for $5 per dozen. The owner will purchase 1 of 3 amounts of roses for
Valentine’s Day: 100, 200, or 400 dozen roses. Given 0.2, 0.4, and 0.6 are the
probabilities for the sale of 100, 200, or 400 dozen roses, respectively, then the EOL for
buying 200 dozen roses is
A) $700.
B) $900.
C) $1,500.
D) $1,600.
TABLE 10-3
A real estate company is interested in testing whether the mean time that families in
Gotham have been living in their current homes is less than families in Metropolis.
Assume that the two population variances are equal. A random sample of 100 families
from Gotham and a random sample of 150 families in Metropolis yield the following
data on length of residence in current homes.
Gotham: G = 35 months, = 900 Metropolis: M = 50 months, = 1050

Referring to Table 10-3, suppose = 0.10. Which of the following represents the result
of the relevant hypothesis test?
A) The alternative hypothesis is rejected.
B) The null hypothesis is rejected.
C) The null hypothesis is not rejected.
D) Insufficient information exists on which to make a decision.
The width of each bar in a histogram corresponds to the
A) differences between the boundaries of the class.
B) number of observations in each class.
C) midpoint of each class.
D) percentage of observations in each class.
TABLE 13-8
It is believed that GPA (grade point average, based on a four point scale) should have a
positive linear relationship with ACT scores. Given below is the Excel output for
predicting GPA using ACT scores based on a data set of 8 randomly chosen students
from a Big-Ten university.
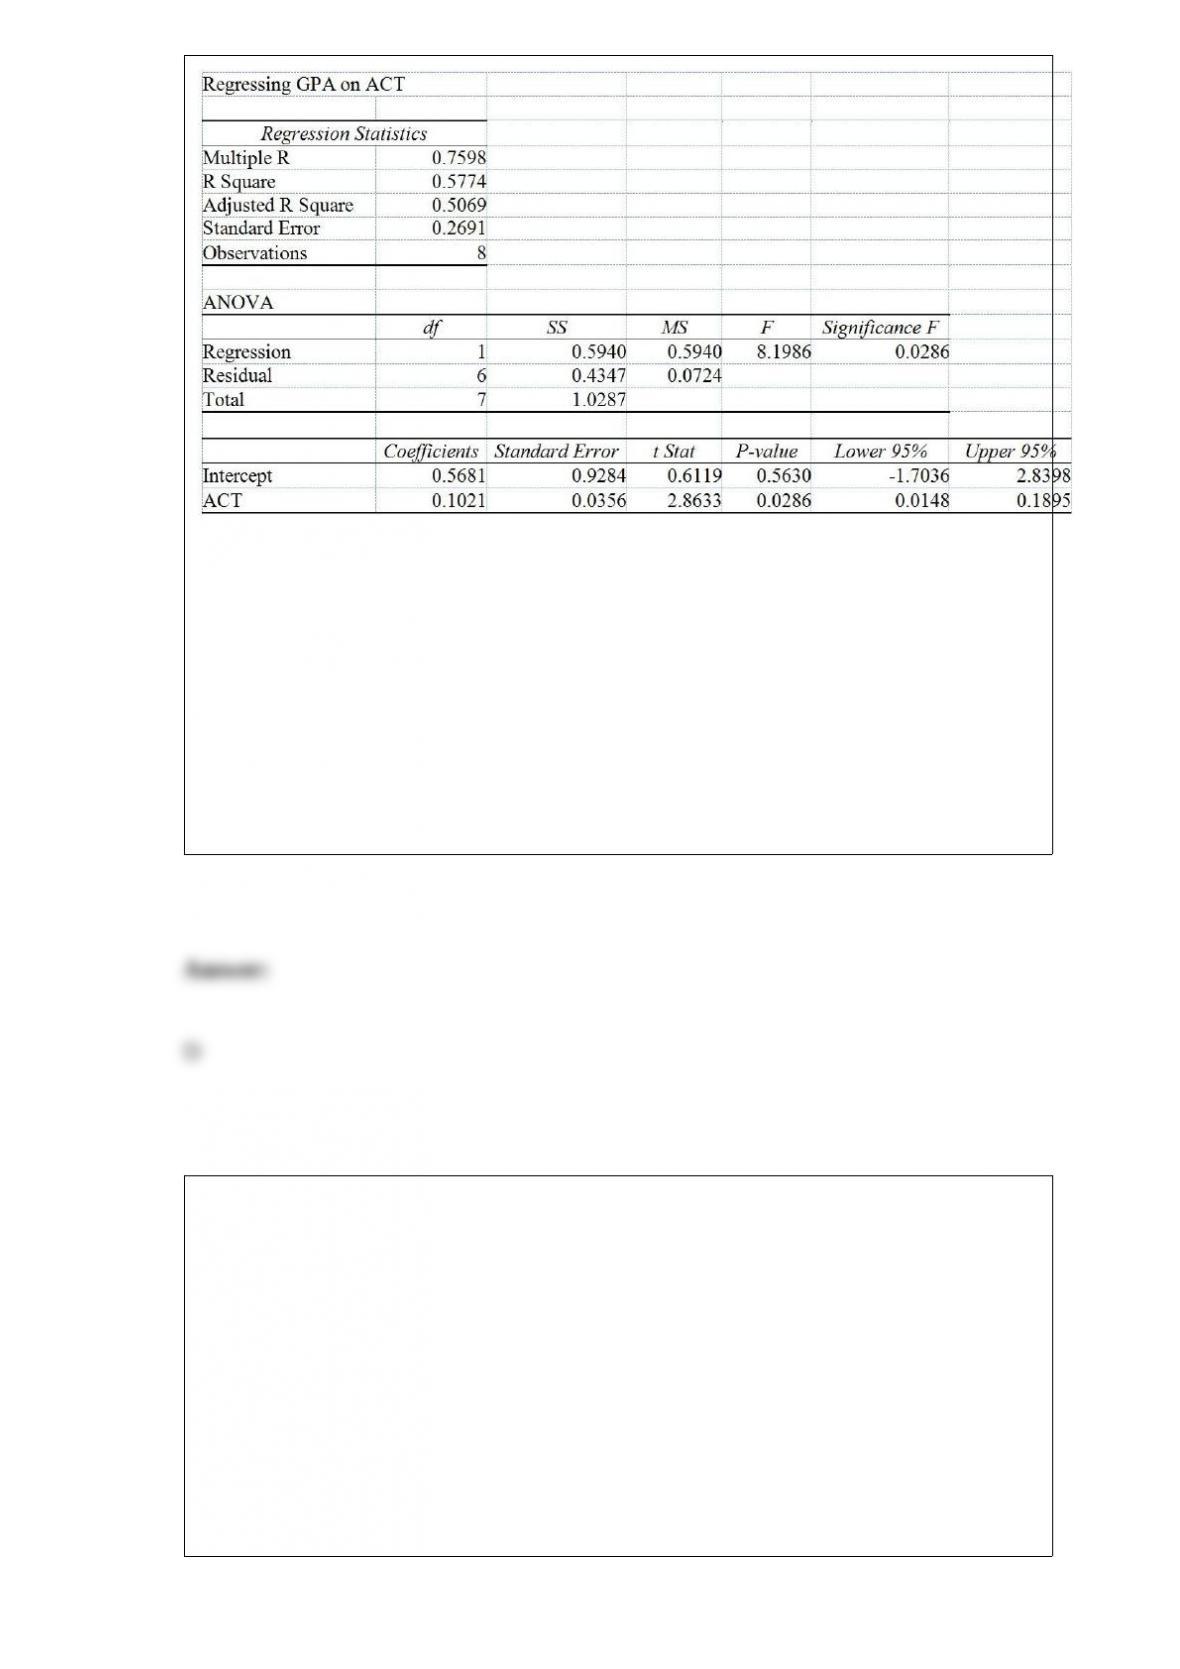
Referring to Table 13-8, the value of the measured test statistic to test whether there is
any linear relationship between GPA and ACT is
A) 0.0356.
B) 0.1021.
C) 0.7598.
D) 2.8633.
To monitor campus security, the campus police office is taking a survey of the number
of students in a parking lot each 30 minutes of a 24-hour period with the goal of
determining when patrols of the lot would serve the most students. If X is the number of
students in the lot each period of time, then X is an example of
A) a categorical variable.
B) a discrete variable.
C) a continuous variable.
D) a statistic.

The Kruskal-Wallis Rank Test for differences in more than two medians is a
nonparametric alternative to
A) ANOVA F test for completely randomized experiments.
B) Student’s t test for related samples.
C) Student’s t test for independent samples.
D) Wilcoxon’s Rank Sum Test for differences in two medians.
If two events are independent, what is the probability that they both occur?
A) 0
B) 0.50
C) 1.00
D) Cannot be determined from the information given.
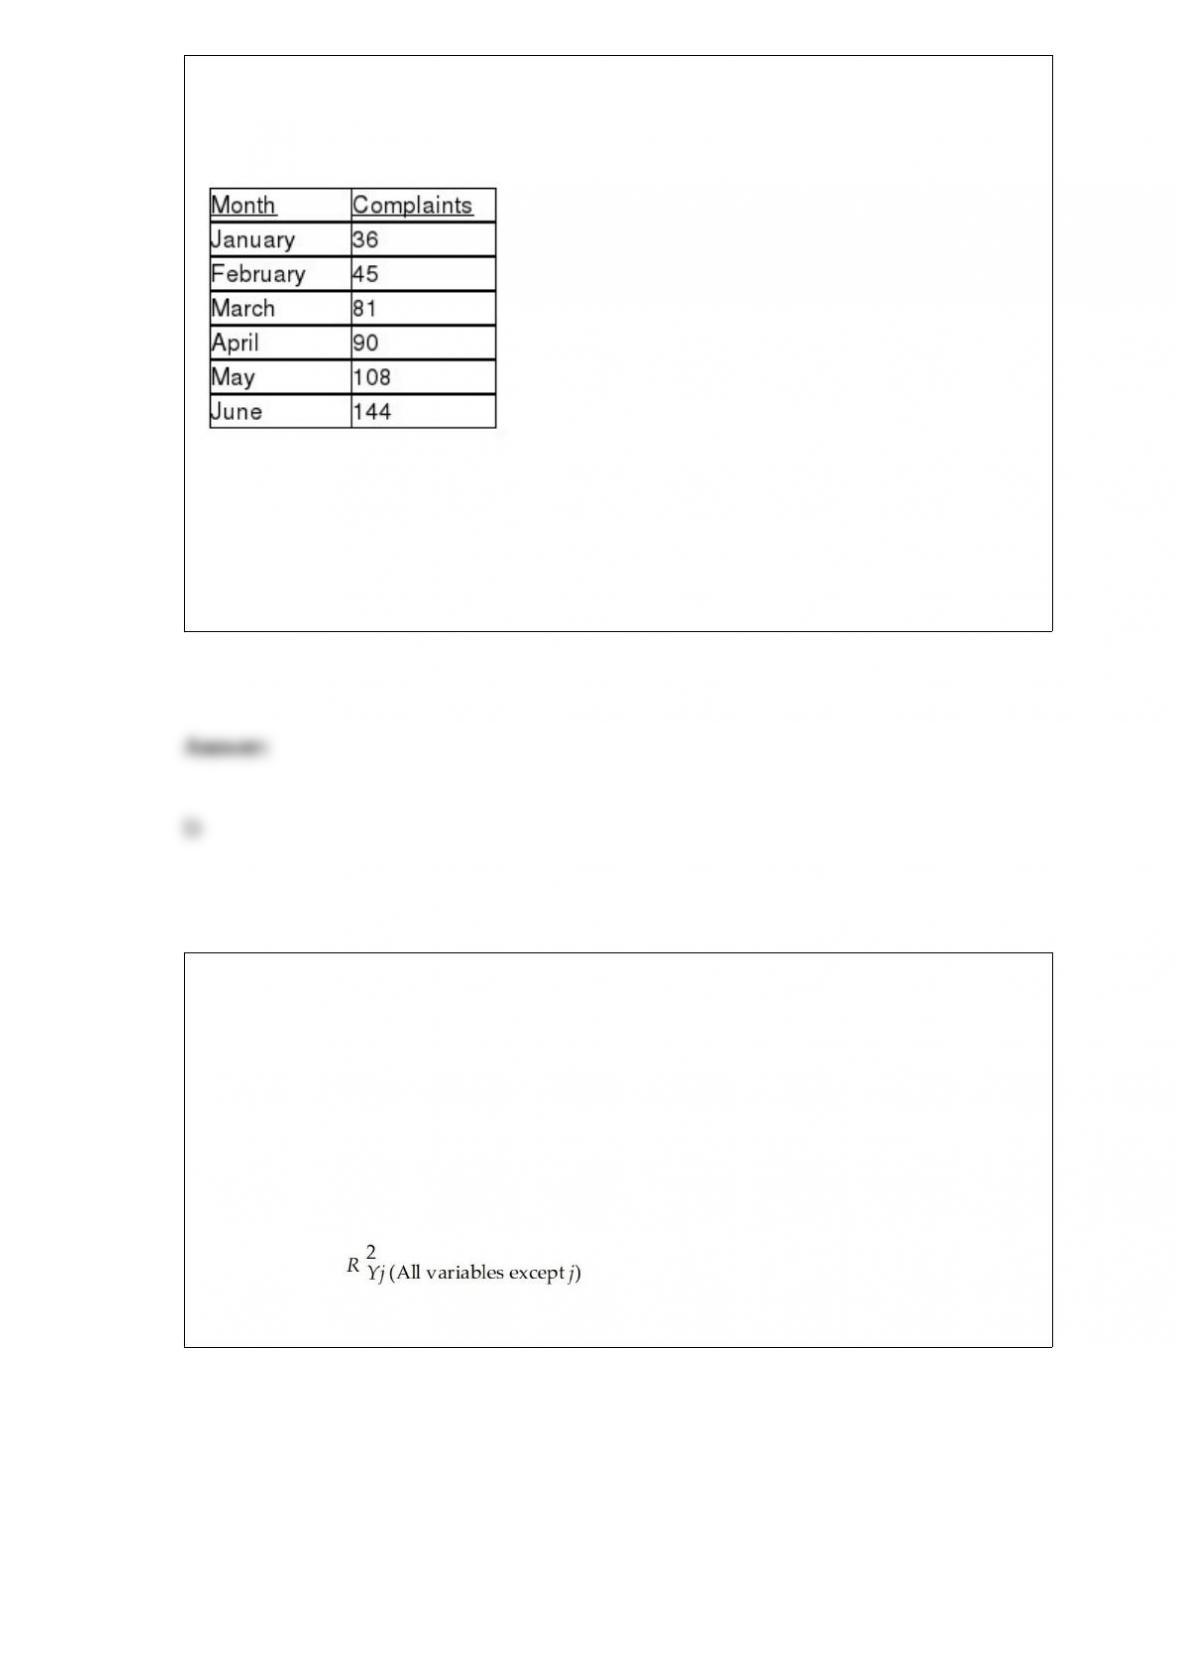
TABLE 16-3
The following table contains the number of complaints received in a department store
for the first 6 months of last year.
Referring to Table 16-3, suppose the last two smoothed values are 81 and 96 (Note:
they are not). What would you forecast as the value of the time series for July?
A) 81
B) 86
C) 91
D) 96
TABLE 17-10
Given below are results from the regression analysis where the dependent variable is
the number of weeks a worker is unemployed due to a layoff (Unemploy) and the
independent variables are the age of the worker (Age), the number of years of education
received (Edu), the number of years at the previous job (Job Yr), a dummy variable for
marital status (Married: 1 = married, 0 = otherwise), a dummy variable for head of
household (Head: 1 = yes, 0 = no) and a dummy variable for management position
(Manager: 1 = yes, 0 = no). We shall call this Model 1. The coefficient of partial
determination ( ) of each of the 6 predictors are, respectively,
0.2807, 0.0386, 0.0317, 0.0141, 0.0958, and 0.1201.
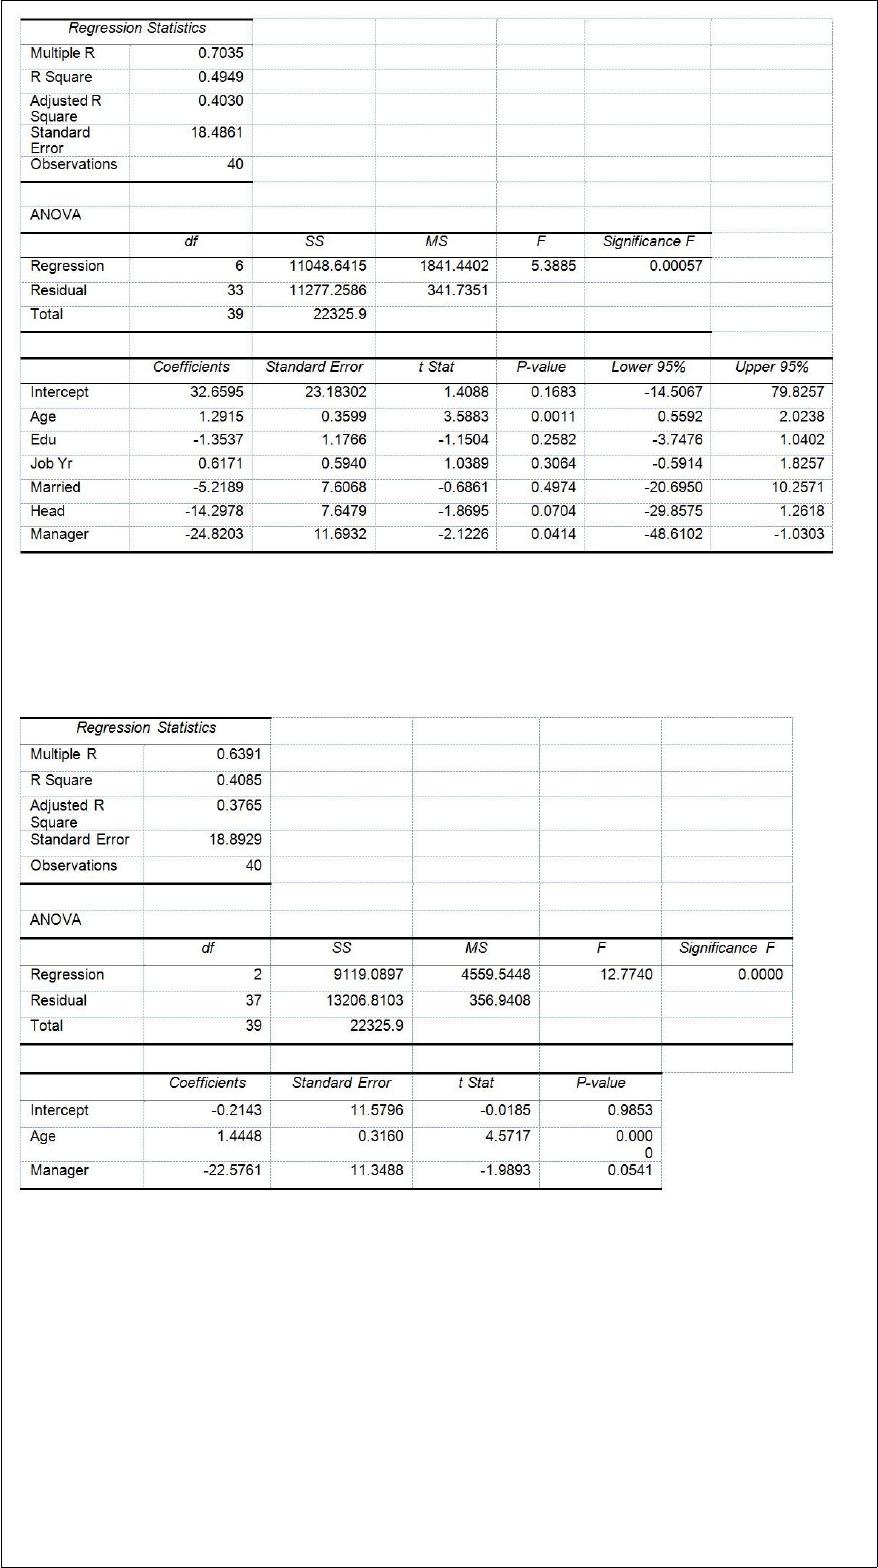
Model 2 is the regression analysis where the dependent variable is Unemploy and the
independent variables are Age and Manager. The results of the regression analysis are
given below:
Referring to Table 17-10, Model 1, which of the following is a correct statement?
A) 49.49% of the total variation in the number of weeks a worker is unemployed due to
a layoff can be explained by the age of the worker, the number of years of education
received, the number of years at the previous job, marital status, whether the worker is
the head of household and whether the worker is a manager.
B) 49.49% of the total variation in the number of weeks a worker is unemployed due to
a layoff can be explained by the age of the worker, the number of years of education
received, the number of years at the previous job, marital status, whether the worker is
the head of household and whether the worker is a manager after adjusting for the

number of predictors and sample size.
C) 49.49% of the total variation in the number of weeks a worker is unemployed due to
a layoff can be explained by the age of the worker, the number of years of education
received, the number of years at the previous job, marital status, whether the worker is
the head of household and whether the worker is a manager after adjusting for the level
of significance.
D) 49.49% of the total variation in the number of weeks a worker is unemployed due to
a layoff can be explained by the age of the worker, the number of years of education
received, the number of years at the previous job, marital status, whether the worker is
the head of household and whether the worker is a manager holding constant the effect
of all the independent variables.
An airline wants to select a computer software package for its reservation system. Four
software packages (1, 2, 3, and 4) are commercially available. The airline will choose
the package that bumps as few passengers, on the average, as possible during a month.
An experiment is set up in which each package is used to make reservations for 5
randomly selected weeks. (A total of 20 weeks was included in the experiment.) Which
of the following tests will be the most appropriate?
A) Paired t test
B) Wilcoxon rank sum test
C) McNemar test
D) Tukey-Kramer multiple comparisons procedure for one-way ANOVA
TABLE 1-2
A Wall Street Journal poll asked 2,150 adults in the United States a series of questions
to find out their view on the U.S. economy.

Referring to Table 1-2, the possible responses to the question “On the scale of 1 to 100
with 1 being extremely anxious and 100 being totally not anxious, rate your level of
anxiety in this U.S. economy” are values from a
A) discrete numerical variable.
B) continuous numerical variable.
C) categorical variable.
D) table of random numbers.
Suppose there is interest in comparing the median response time for three independent
groups learning a specific task. The appropriate nonparametric procedure is
A) Wilcoxon Rank Sums Test.
B) McNemar Test.
C) Kruskal-Wallis Rank Test.
D) X2 test.
TABLE 13-4
The managers of a brokerage firm are interested in finding out if the number of new
clients a broker brings into the firm affects the sales generated by the broker. They
sample 12 brokers and determine the number of new clients they have enrolled in the
last year and their sales amounts in thousands of dollars. These data are presented in the
table that follows.
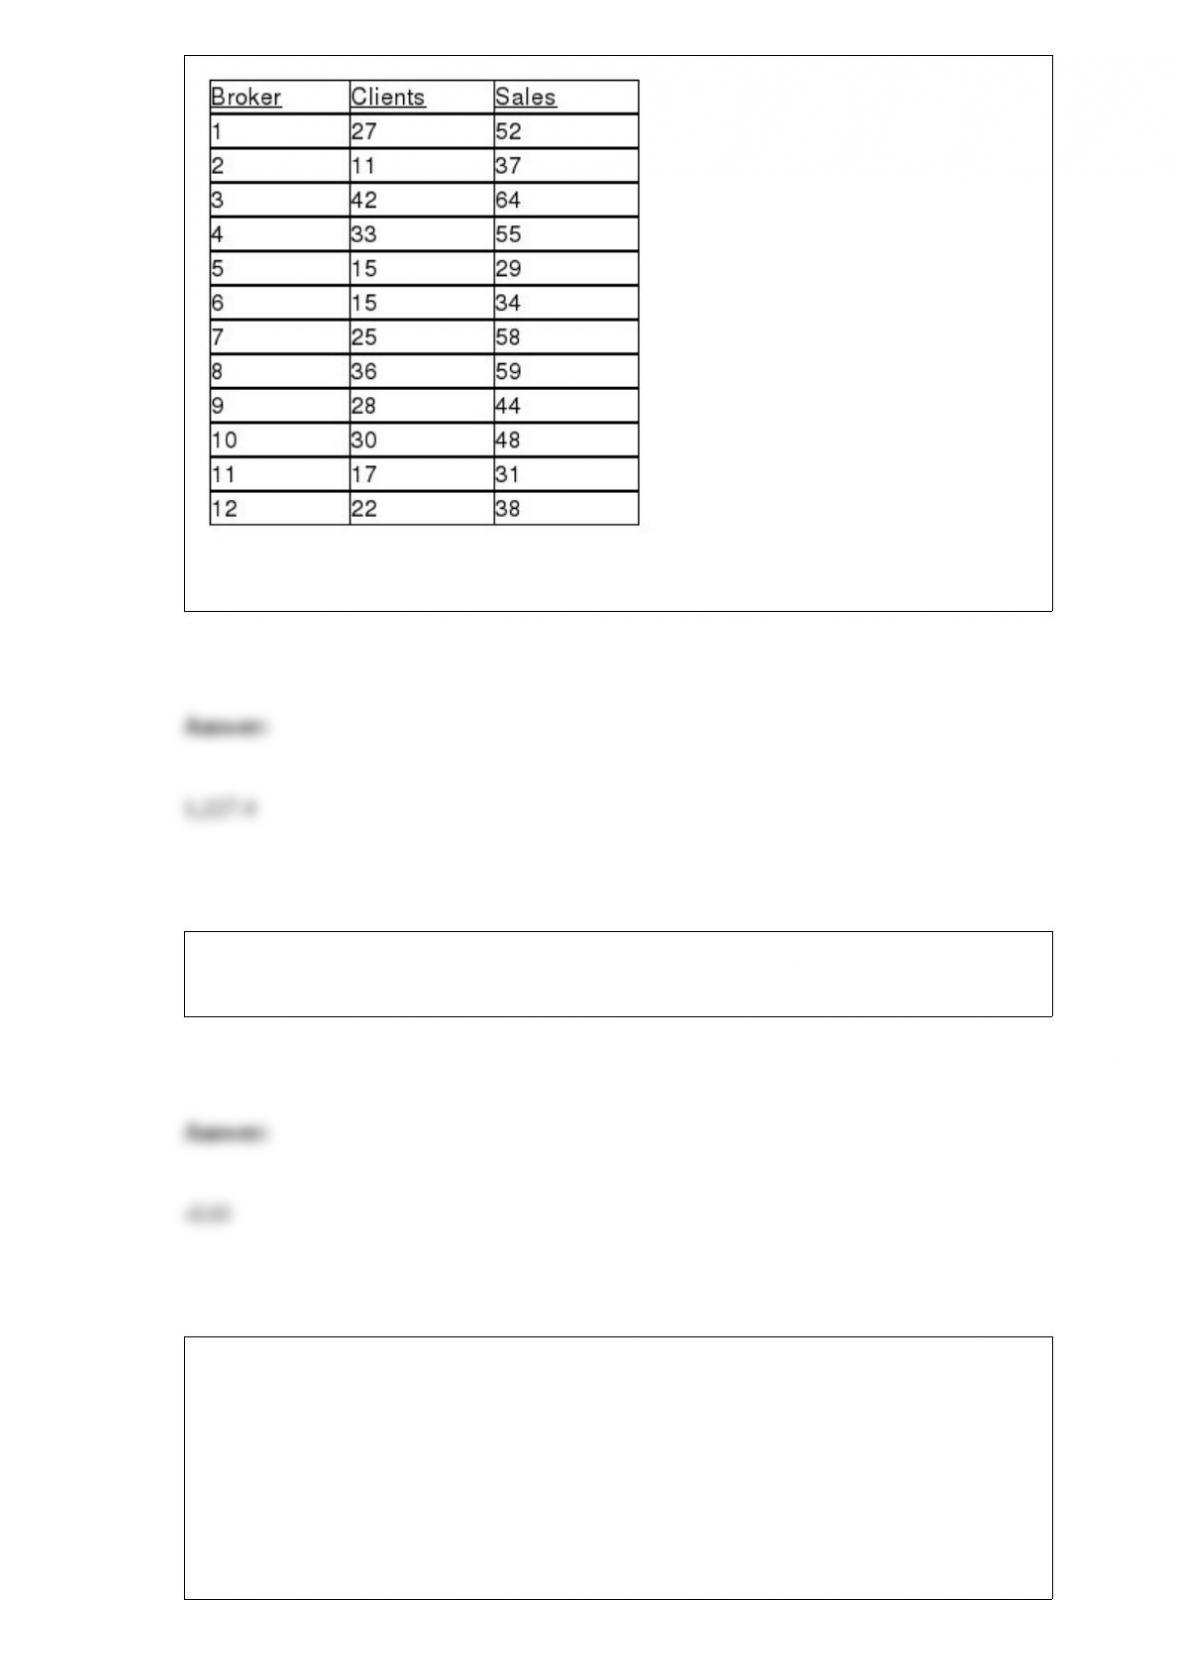
Referring to Table 13-4, the regression sum of squares (SSR) is ________.
Suppose Z has a standard normal distribution with a mean of 0 and standard deviation
of 1. So, 27% of the possible Z values are smaller than ________.
TABLE 5-6
The quality control manager of Green Bulbs Inc. is inspecting a batch of energy saving
compact fluorescent light bulbs. When the production process is in control, the average
number of bad bulbs per shift is 6.0.
Referring to Table 5-6, what is the probability that any particular shift being inspected
has produced fewer than 5.0 bad bulbs?
An insurance company evaluates many numerical variables about a person before
deciding on an appropriate rate for automobile insurance. A person’s age is an example
of a ________ numerical variable.
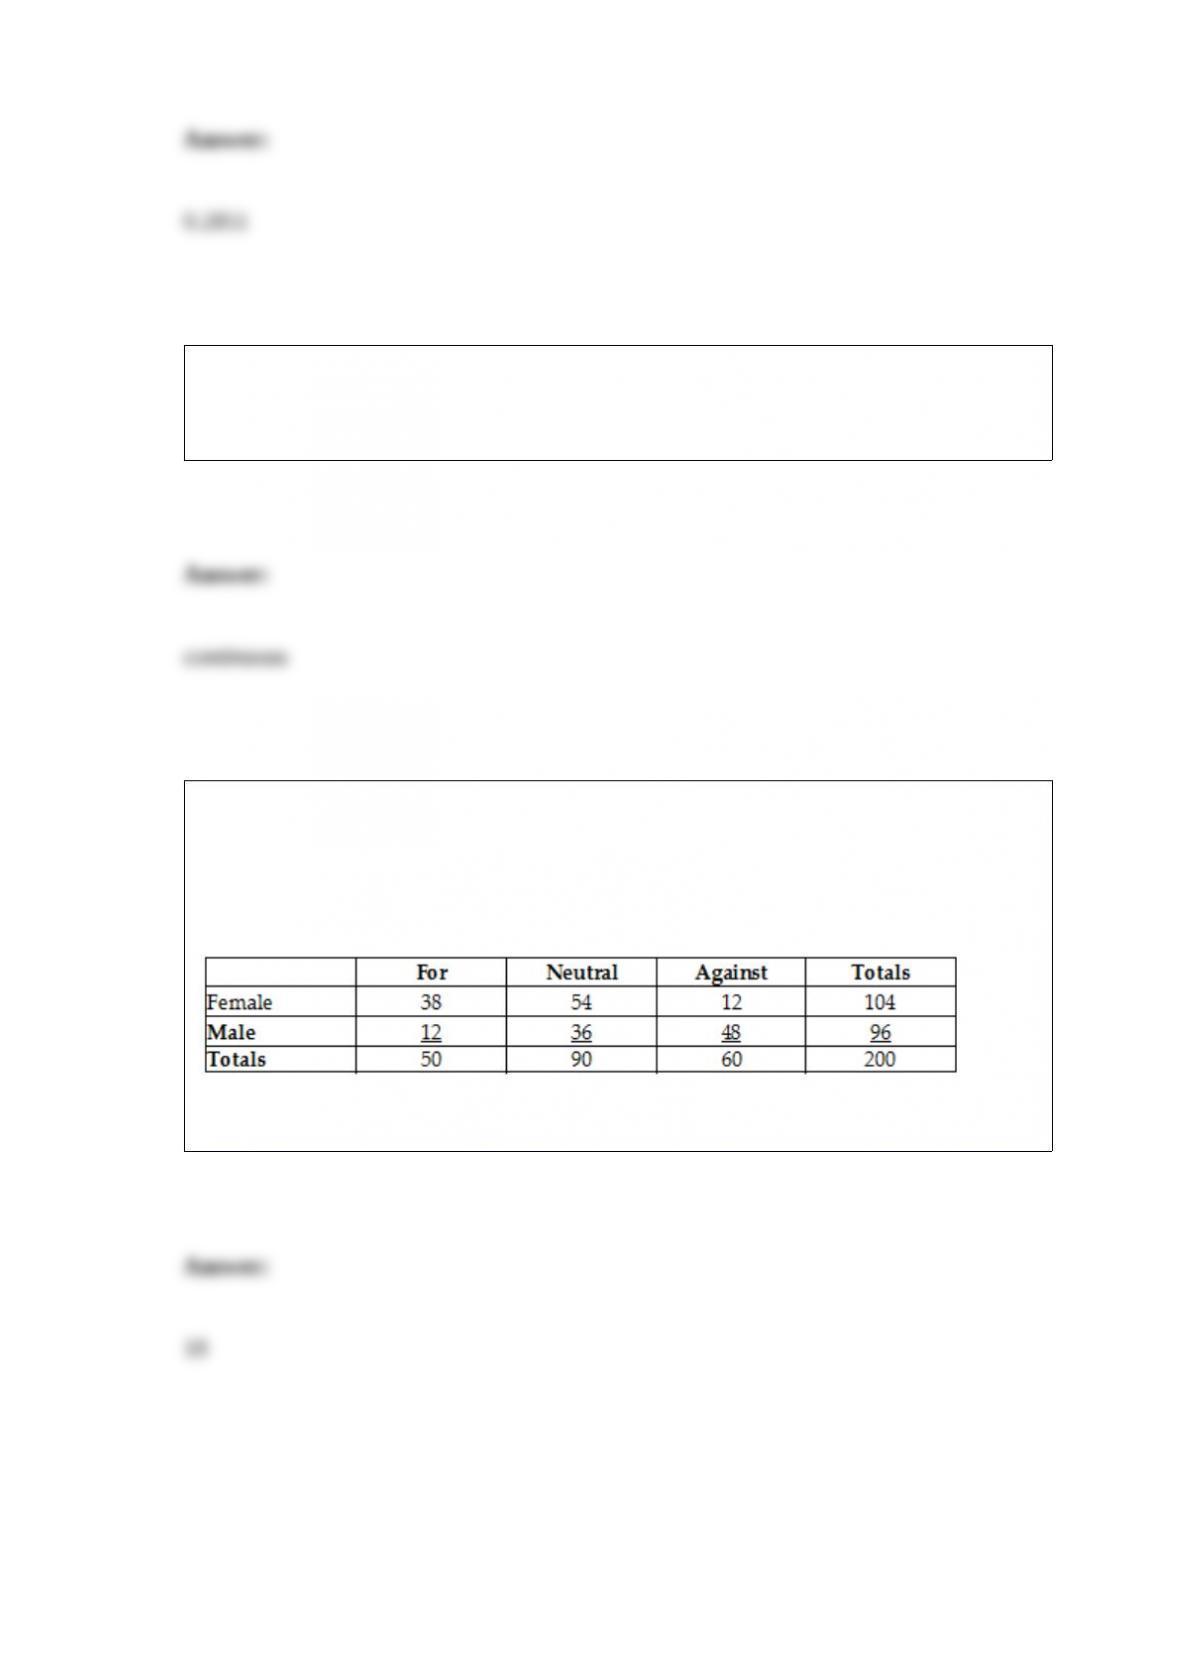
TABLE 2-12
The table below contains the opinions of a sample of 200 people broken down by
gender about the latest congressional plan to eliminate anti-trust exemptions for
professional baseball.
Referring to Table 2-12, ________ percent of the 200 were males who were neutral.