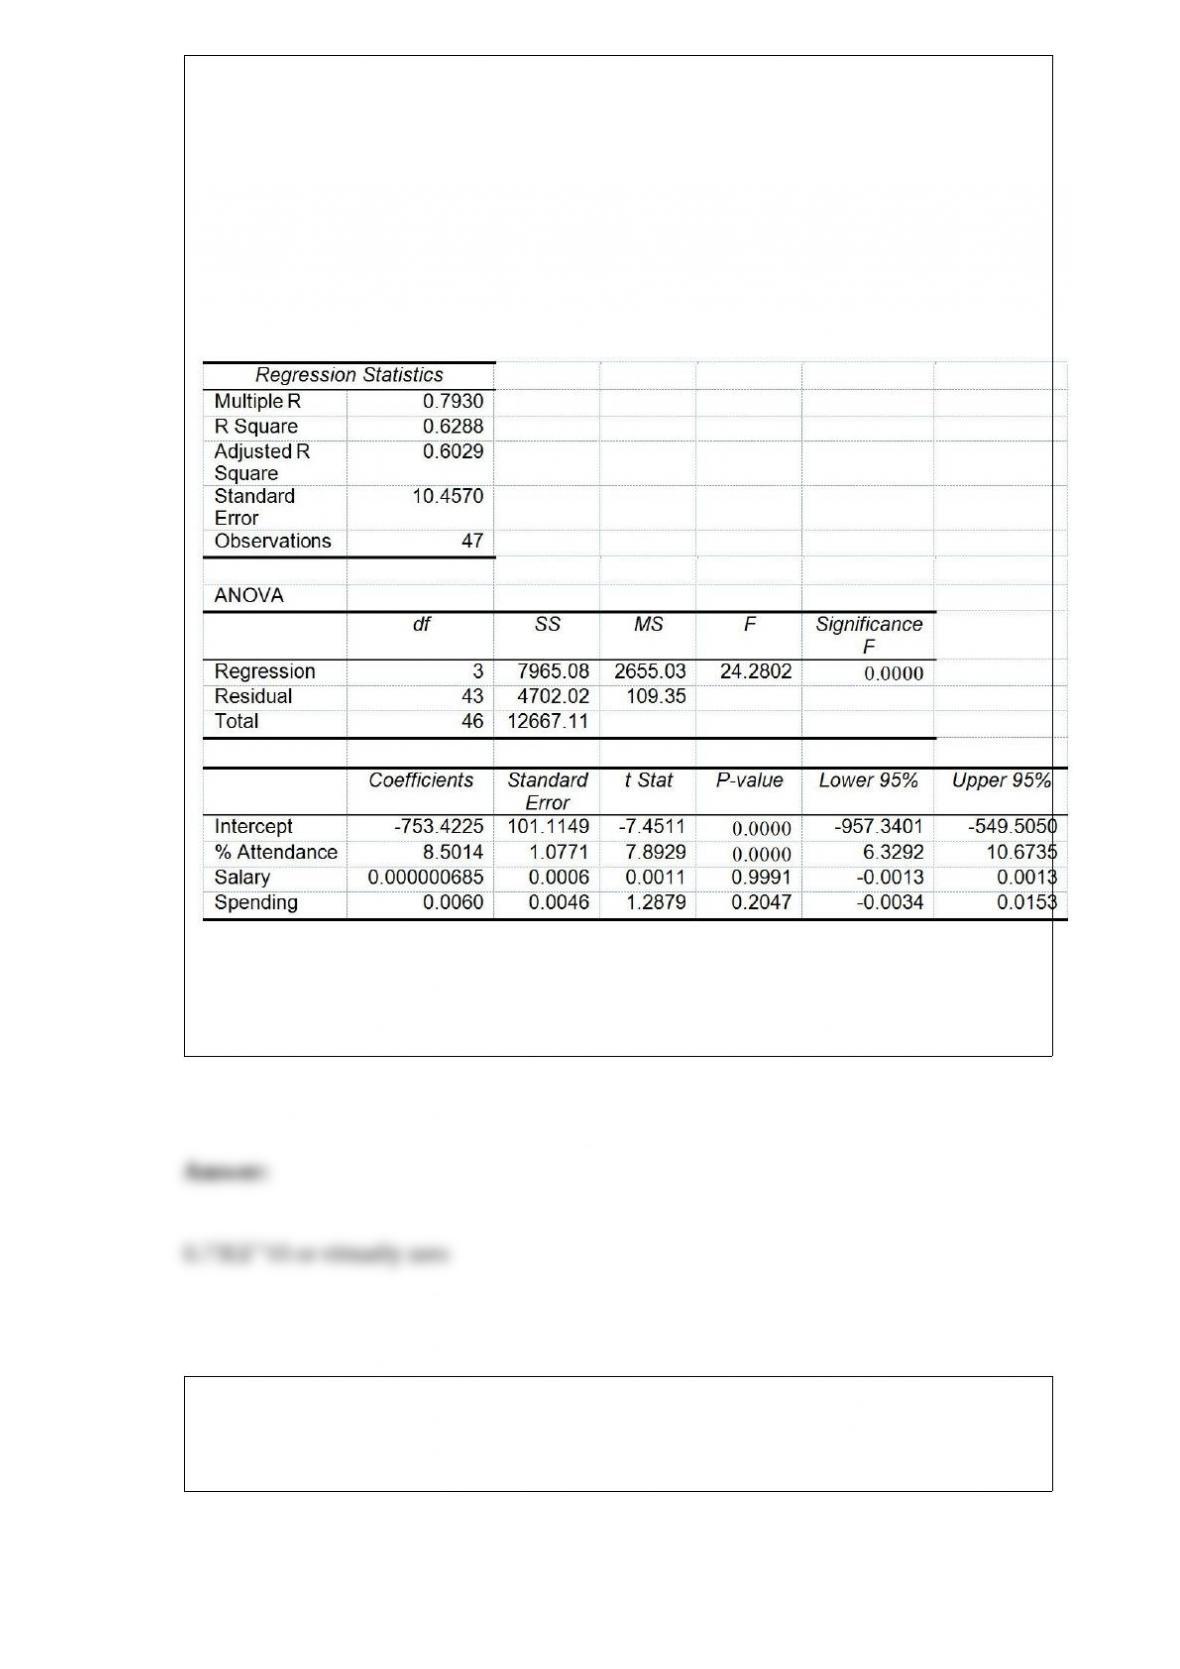
TABLE 17-8
The superintendent of a school district wanted to predict the percentage of students
passing a sixth-grade proficiency test. She obtained the data on percentage of students
passing the proficiency test (% Passing), daily mean of the percentage of students
attending class (% Attendance), mean teacher salary in dollars (Salaries), and
instructional spending per pupil in dollars (Spending) of 47 schools in the state.
Following is the multiple regression output with Y = % Passing as the dependent
variable, X1 = % Attendance, X2 = Salaries and X3 = Spending:
Referring to Table 17-8, what is the p-value of the test statistic when testing whether the
daily average of the percentage of students attending class has any effect on the
percentage of students passing the proficiency test, taking into account the effect of all
the other independent variables?
The interval between patients arriving at an outpatient clinic follows an exponential
distribution at a rate of 1 patient per hour. What is the probability that a randomly
chosen arrival interval will be less than 20 minutes?
TABLE 4-10
Are whites more likely to claim bias? It was found that 60% of the workers were white,
30% were black and 10% are other races. Given that a worker was white, the
probability that the worker had claimed bias was 30%. Given that a worker was black,
the probability that the worker had claimed bias was 40%. Given that a worker was
other race, the probability that the worker had claimed bias was 0%.
Referring to Table 4-10, what is the probability that a randomly selected worker is
white and had claimed bias?
TABLE 18-7
A supplier of silicone sheets for producers of computer chips wants to evaluate her
manufacturing process. She takes sample sizes of 5 from each day’s output and counts
the number of blemishes on each silicone sheet. The results from 20 days of such
evaluations are presented below.
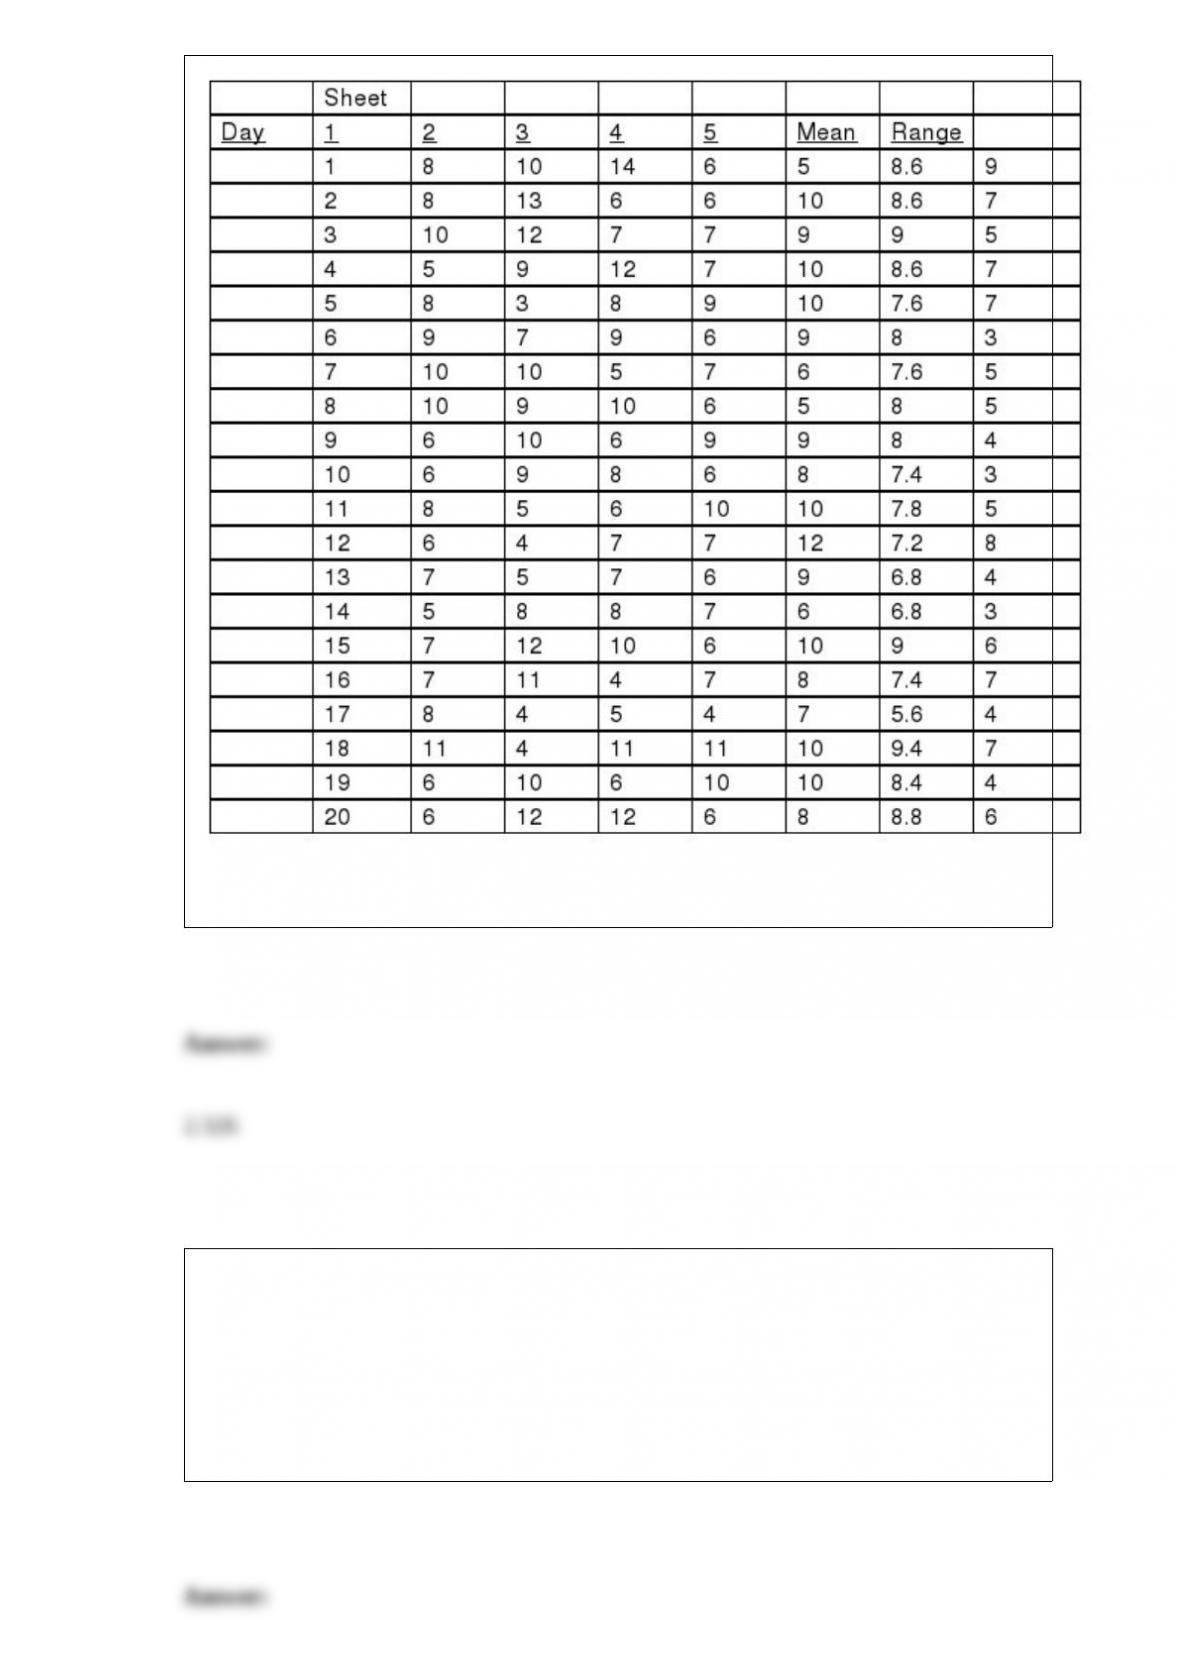
She also decides that the upper specification limit is 10 blemishes.
Referring to Table 18-7, what is the value of d2 factor?
The Quality Assurance Department of a large urban hospital is attempting to monitor
and evaluate patient satisfaction with hospital services. Prior to discharge, a random
sample of patients is asked to fill out a questionnaire to rate such services as medical
care, nursing, therapy, laboratory, food, and cleaning. The Quality Assurance
Department prepares weekly reports that are presented at the Board of Directors
meetings and extraordinary/atypical ratings are easy to flag. Values computed from the
sample results each week are called ________.