
True or False: A regression had the following results: SST = 82.55, SSE = 29.85. It can
be said that 63.84% of the variation in the dependent variable is explained by the
independent variables in the regression.
True or False: If the population distribution is skewed, in most cases the sampling
distribution of the mean can be approximated by the normal distribution if the samples
contain at least 30 observations.
True or False: You should report only the results of hypothesis tests that show statistical
significance and omit those for which there is insufficient evidence in the findings.
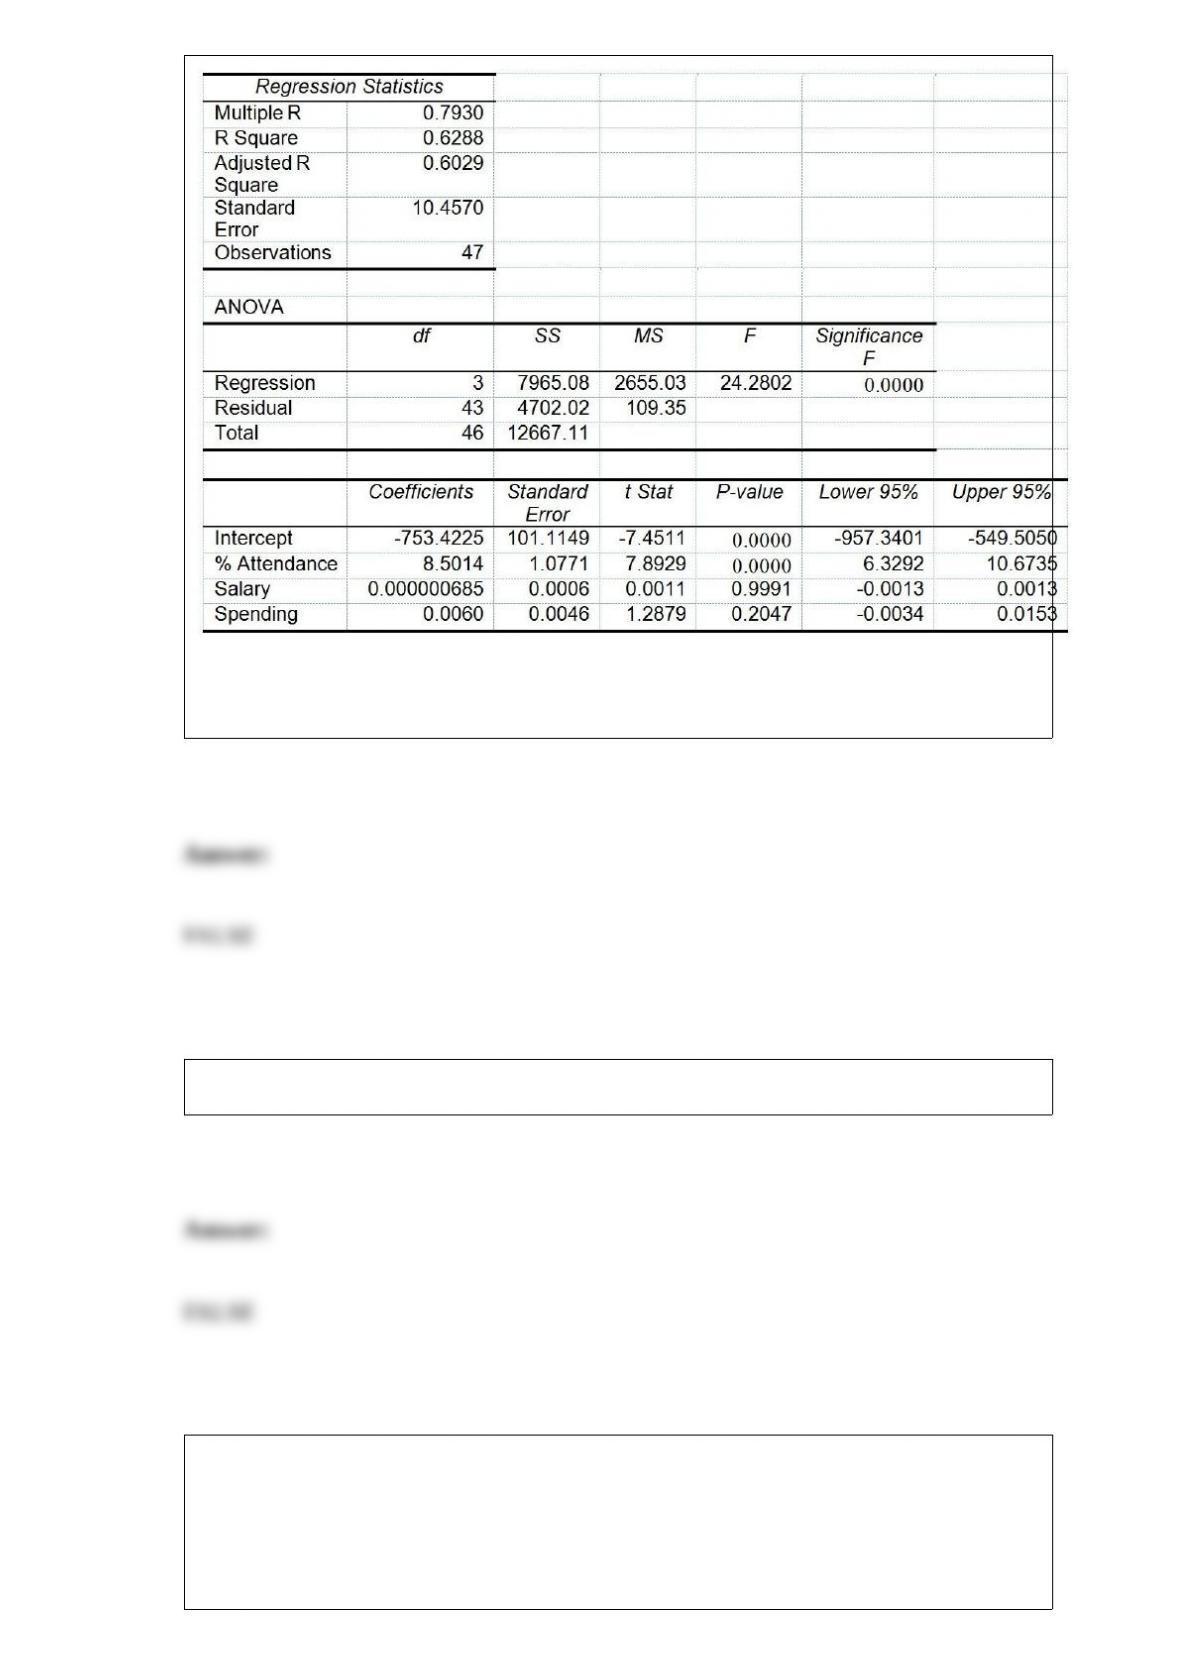
True or False: TABLE 17-8
The superintendent of a school district wanted to predict the percentage of students
passing a sixth-grade proficiency test. She obtained the data on percentage of students
passing the proficiency test (% Passing), daily mean of the percentage of students
attending class (% Attendance), mean teacher salary in dollars (Salaries), and
instructional spending per pupil in dollars (Spending) of 47 schools in the state.
Following is the multiple regression output with Y = % Passing as the dependent
variable, X1 = % Attendance, X2 = Salaries and X3 = Spending:
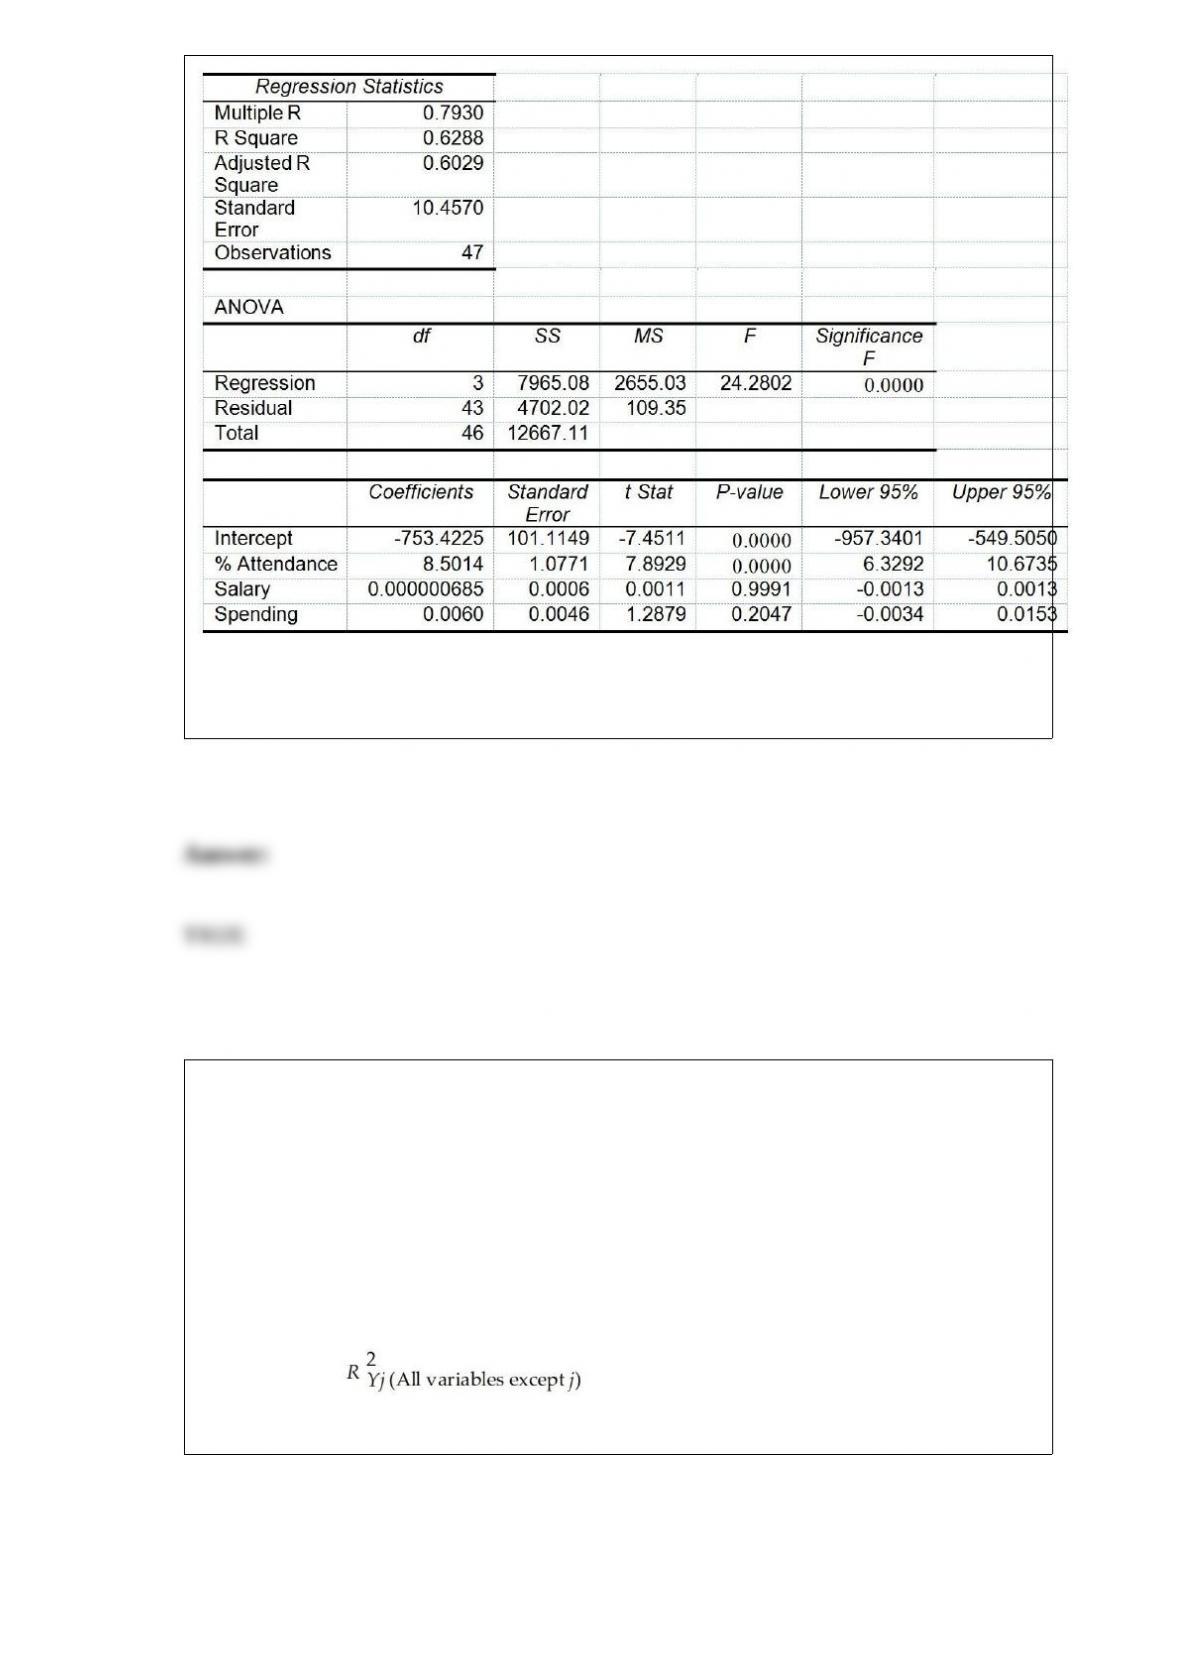
Referring to Table 17-8, there is sufficient evidence that the percentage of students
passing the proficiency test depends on at least one of the explanatory variables at a 5%
level of significance.
True or False: TABLE 17-10
Given below are results from the regression analysis where the dependent variable is
the number of weeks a worker is unemployed due to a layoff (Unemploy) and the
independent variables are the age of the worker (Age), the number of years of education
received (Edu), the number of years at the previous job (Job Yr), a dummy variable for
marital status (Married: 1 = married, 0 = otherwise), a dummy variable for head of
household (Head: 1 = yes, 0 = no) and a dummy variable for management position
(Manager: 1 = yes, 0 = no). We shall call this Model 1. The coefficient of partial
determination ( ) of each of the 6 predictors are, respectively,
0.2807, 0.0386, 0.0317, 0.0141, 0.0958, and 0.1201.
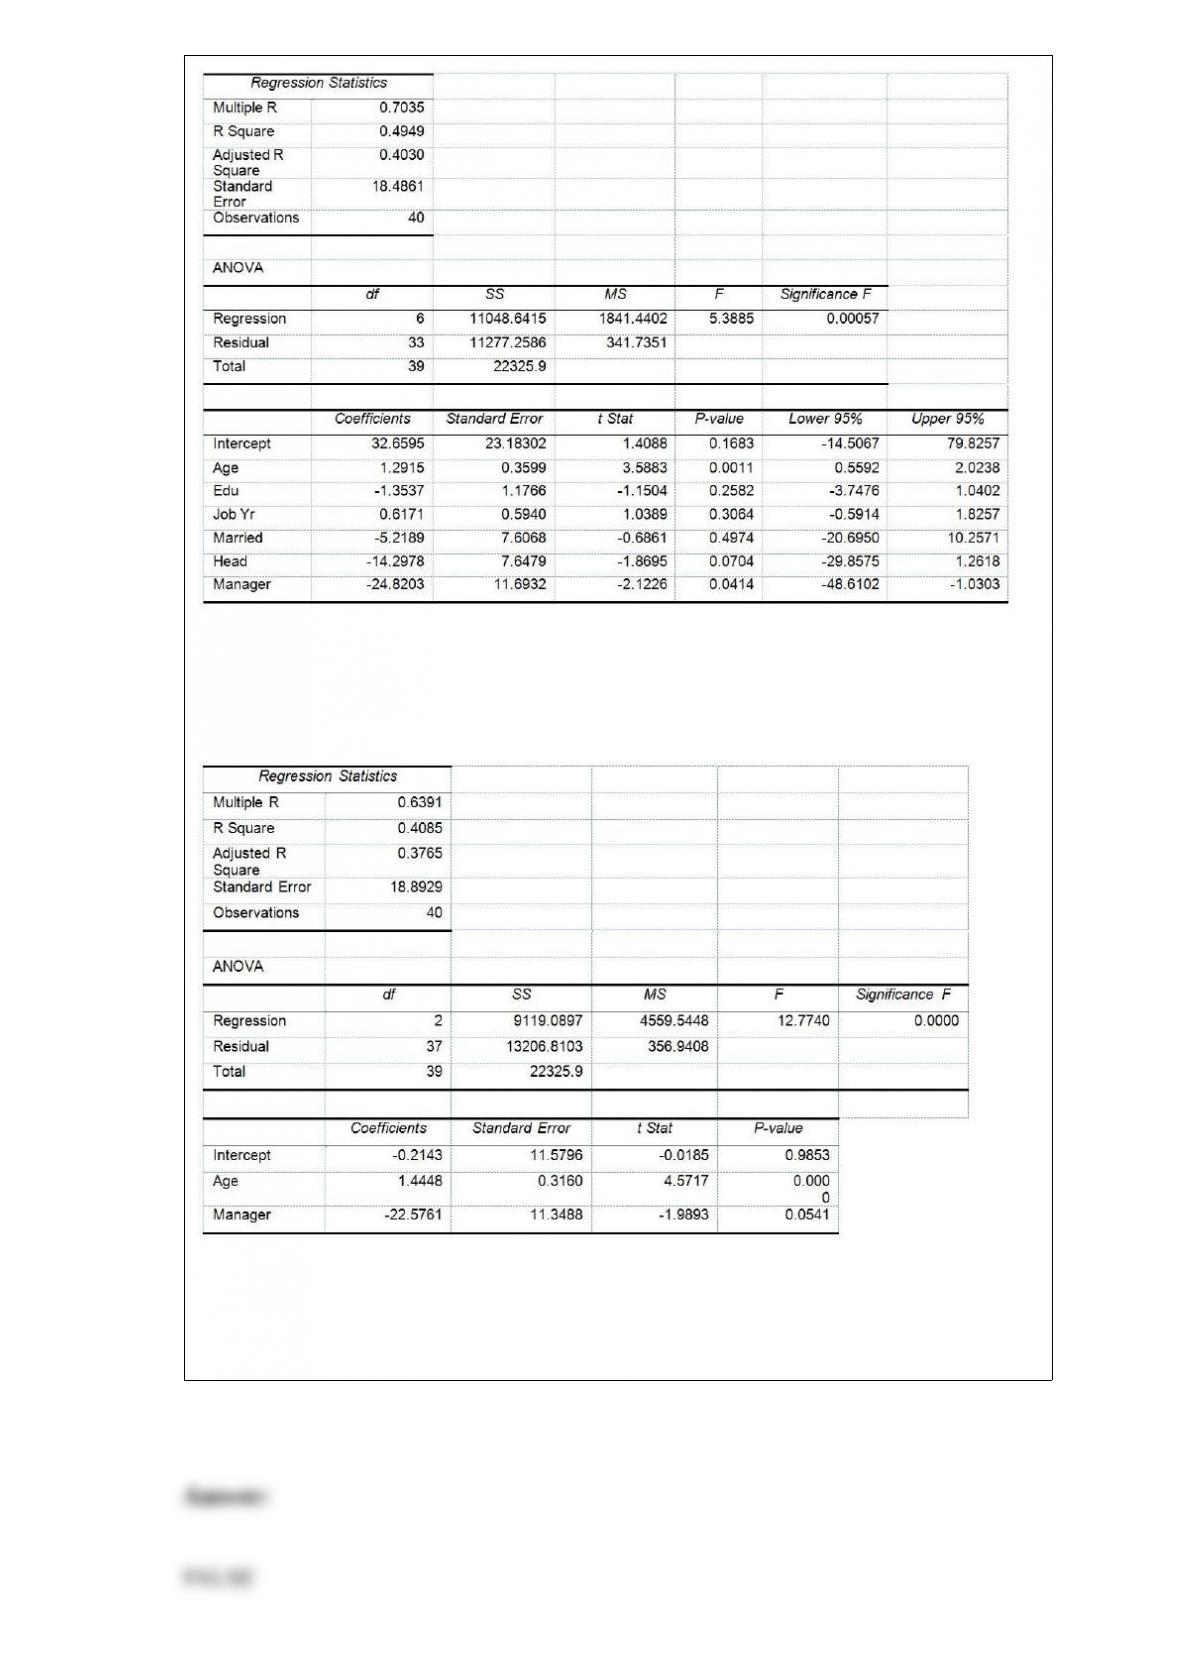
Model 2 is the regression analysis where the dependent variable is Unemploy and the
independent variables are Age and Manager. The results of the regression analysis are
given below:
Referring to Table 17-10, Model 1, the null hypothesis H0 : β1 = β2= β3 = β4 = β5 = β6
= 0 implies that the number of weeks a worker is unemployed due to a layoff is not
affected by some of the explanatory variables.
True or False: Removal of uncertainty from a decision-making problem leads to a case
referred to as perfect information.
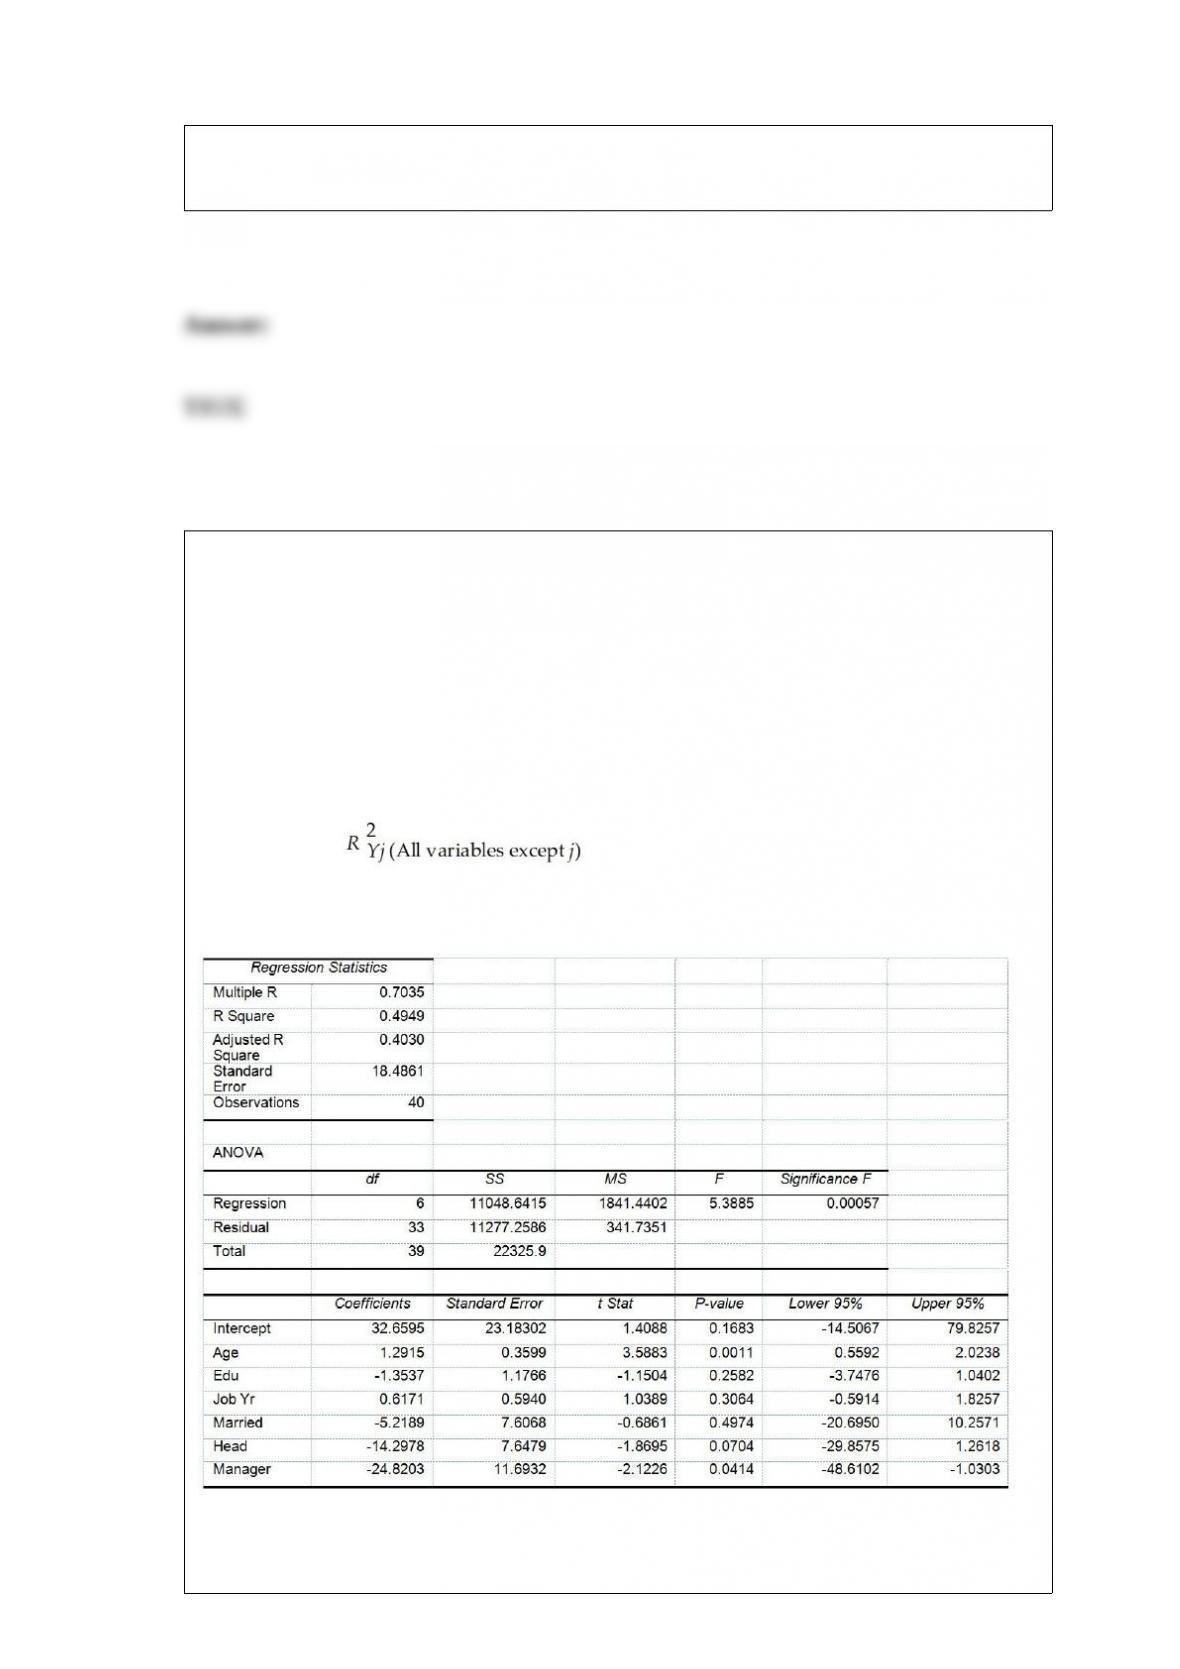
True or False: TABLE 17-10
Given below are results from the regression analysis where the dependent variable is
the number of weeks a worker is unemployed due to a layoff (Unemploy) and the
independent variables are the age of the worker (Age), the number of years of education
received (Edu), the number of years at the previous job (Job Yr), a dummy variable for
marital status (Married: 1 = married, 0 = otherwise), a dummy variable for head of
household (Head: 1 = yes, 0 = no) and a dummy variable for management position
(Manager: 1 = yes, 0 = no). We shall call this Model 1. The coefficient of partial
determination ( ) of each of the 6 predictors are, respectively,
0.2807, 0.0386, 0.0317, 0.0141, 0.0958, and 0.1201.
Model 2 is the regression analysis where the dependent variable is Unemploy and the
independent variables are Age and Manager. The results of the regression analysis are
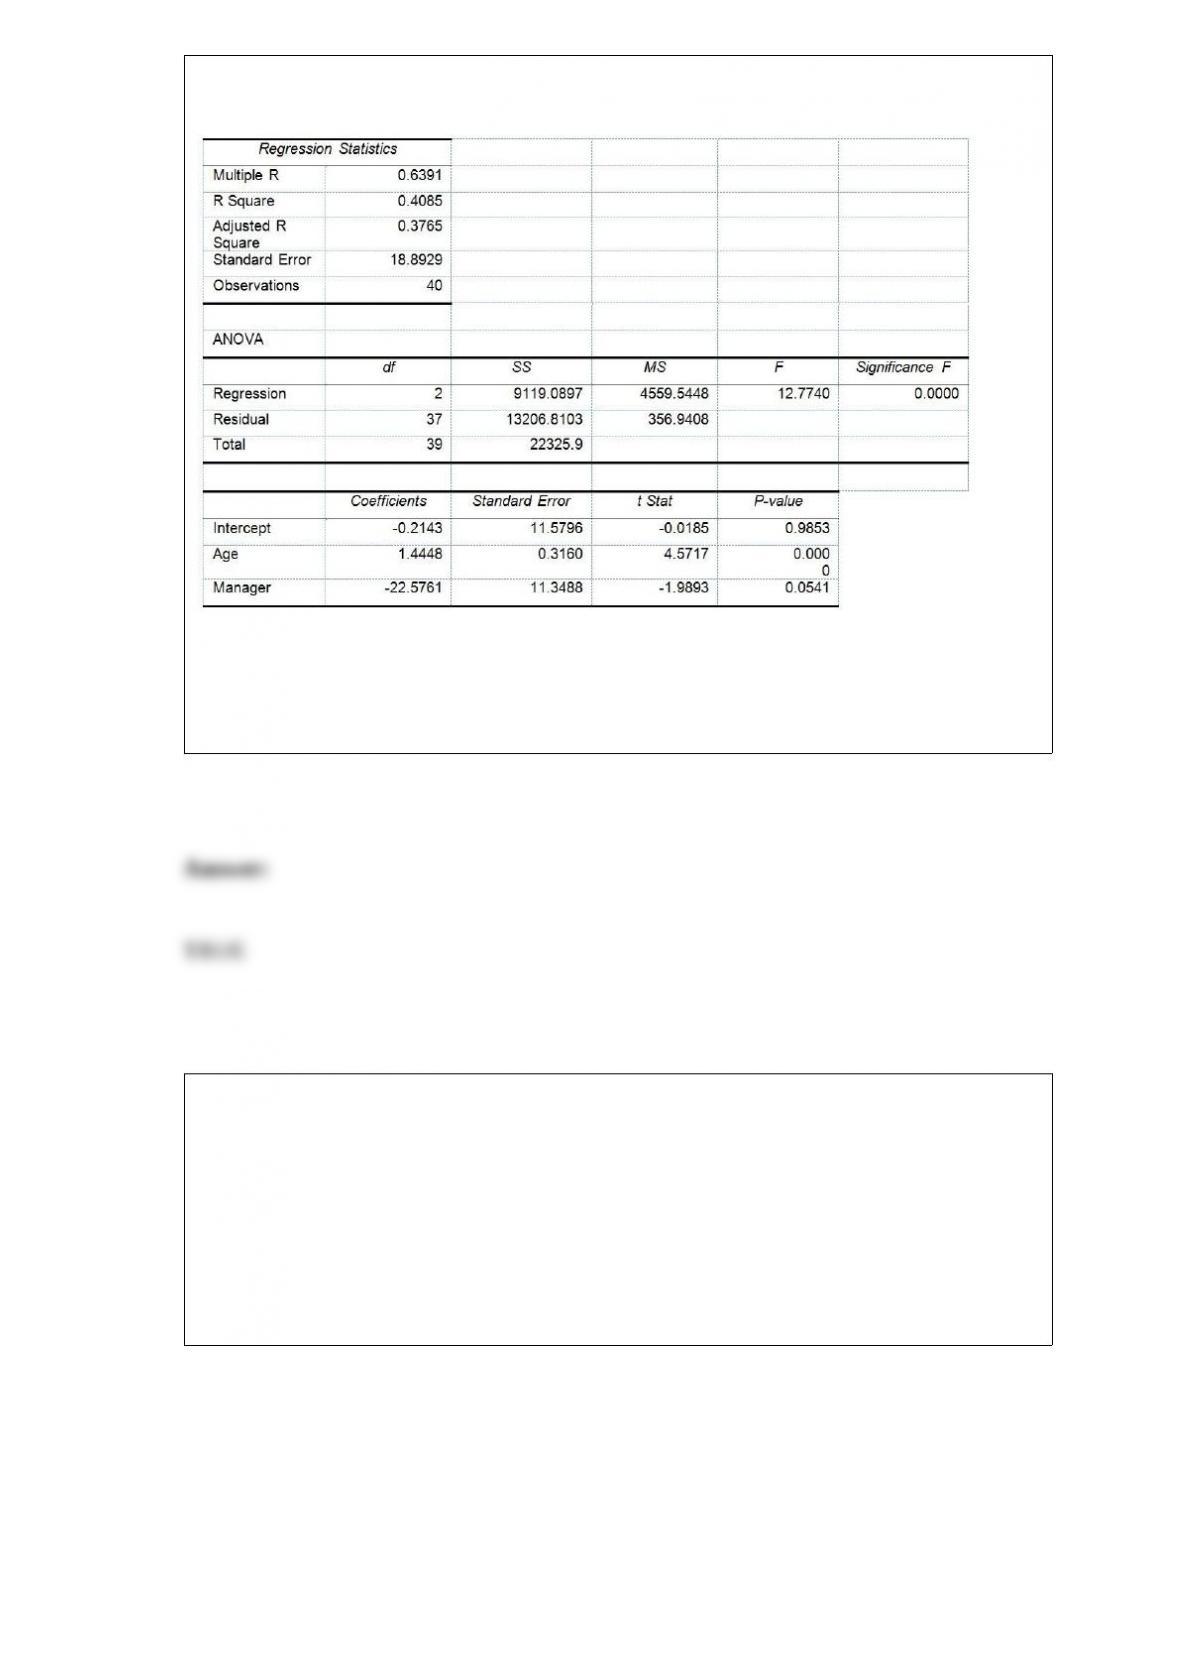
given below:
Referring to Table 17-10, Model 1, the alternative hypothesis H1 : At least one of βj â
‰ 0 for j = 1, 2, 3, 4, 5, 6 implies that the number of weeks a worker is unemployed
due to a layoff is affected by at least one of the explanatory variables.
True or False: TABLE 17-8
The superintendent of a school district wanted to predict the percentage of students
passing a sixth-grade proficiency test. She obtained the data on percentage of students
passing the proficiency test (% Passing), daily mean of the percentage of students
attending class (% Attendance), mean teacher salary in dollars (Salaries), and
instructional spending per pupil in dollars (Spending) of 47 schools in the state.
Following is the multiple regression output with Y = % Passing as the dependent
variable, X1 = % Attendance, X2 = Salaries and X3 = Spending:
Referring to Table 17-8, there is sufficient evidence that the percentage of students
passing the proficiency test depends on all of the explanatory variables at a 5% level of
significance.
True or False: If either A or B must occur they are called mutually exclusive.
TABLE 11-10
An agronomist wants to compare the crop yield of 3 varieties of chickpea seeds. She
plants all 3 varieties of the seeds on each of 5 different patches of fields. She then
measures the crop yield in bushels per acre. Treating this as a randomized block design,
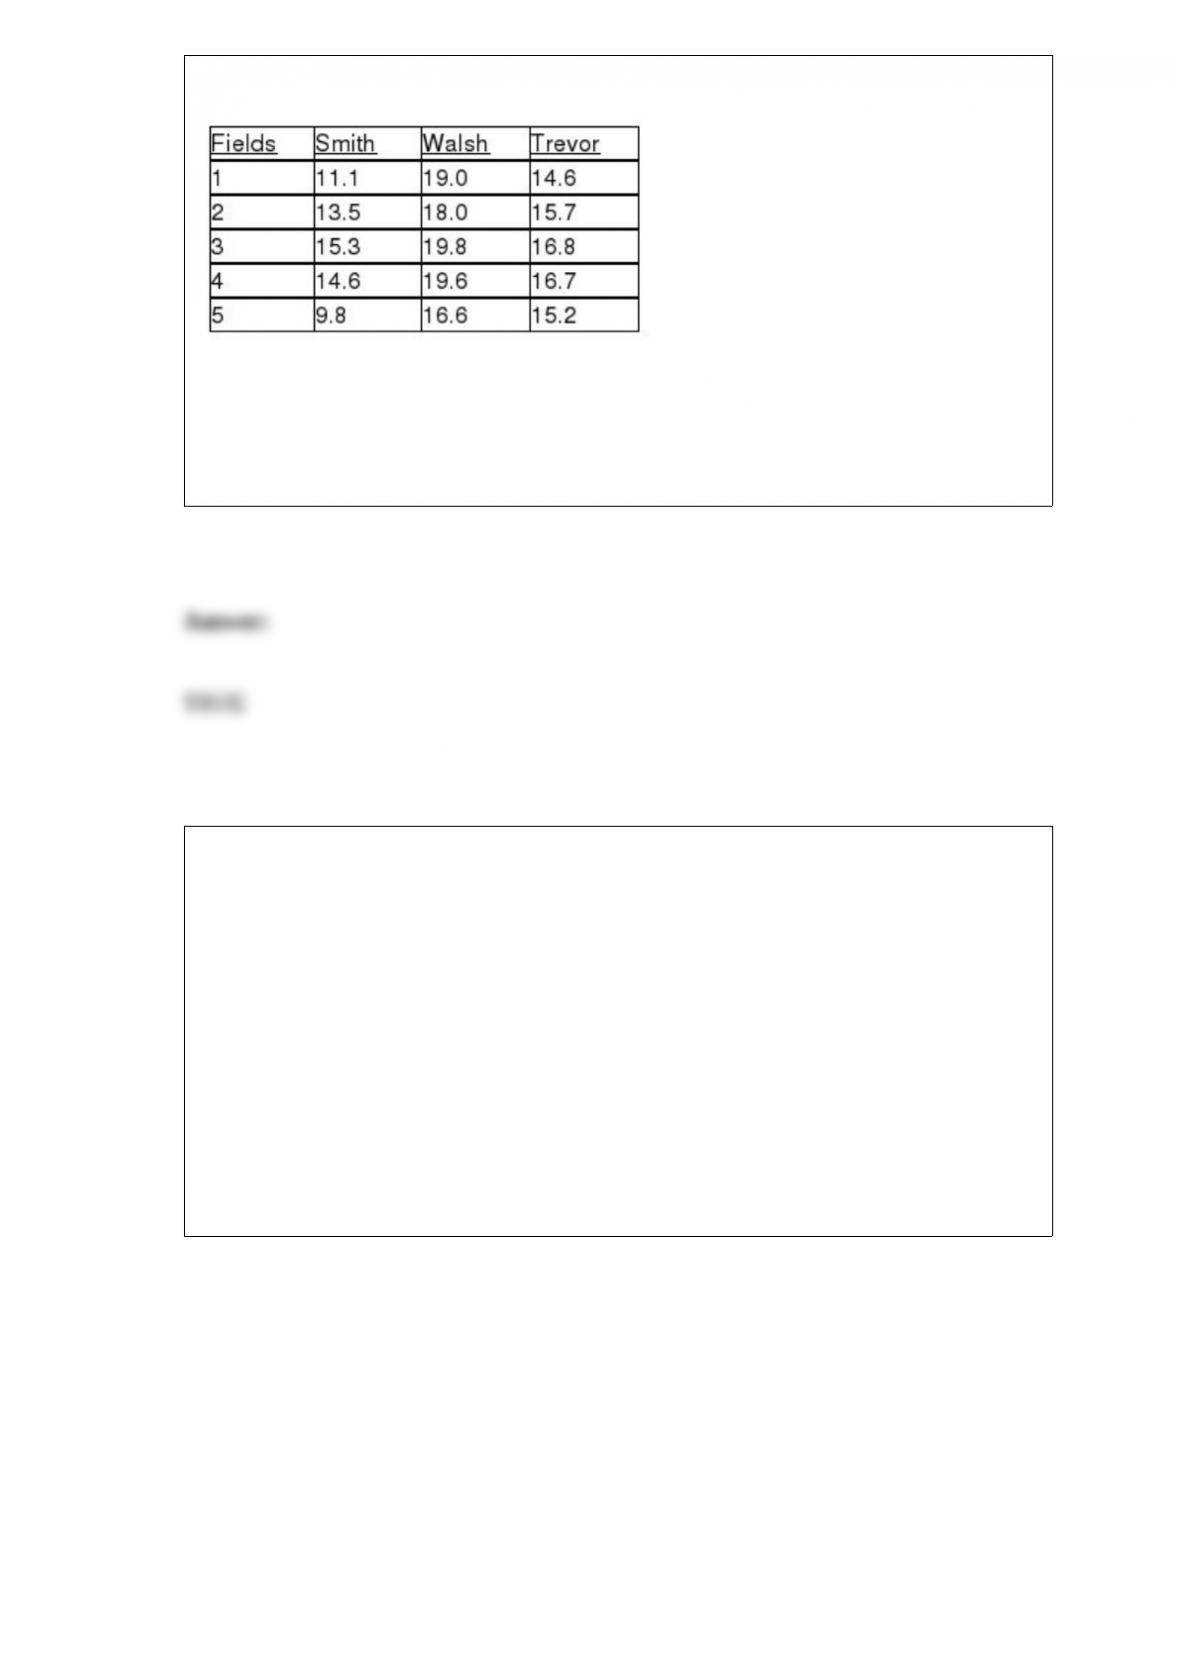
the results are presented in the table that follows.
True or False: Referring to Table 11-10, the relative efficiency means that 2.47 times as
many observations in each variety group would be needed in a one-way ANOVA design
as compared to the randomized block design in order to obtain the same precision for
comparison of the variety means.
True or False: TABLE 17-12
The marketing manager for a nationally franchised lawn service company would like to
study the characteristics that differentiate home owners who do and do not have a lawn
service. A random sample of 30 home owners located in a suburban area near a large
city was selected; 15 did not have a lawn service (code 0) and 15 had a lawn service
(code 1). Additional information available concerning these 30 home owners includes
family income (Income, in thousands of dollars), lawn size (Lawn Size, in thousands of
square feet), attitude toward outdoor recreational activities (Attitude 0 = unfavorable, 1
= favorable), number of teenagers in the household (Teenager), and age of the head of
the household (Age).
The Minitab output is given below:
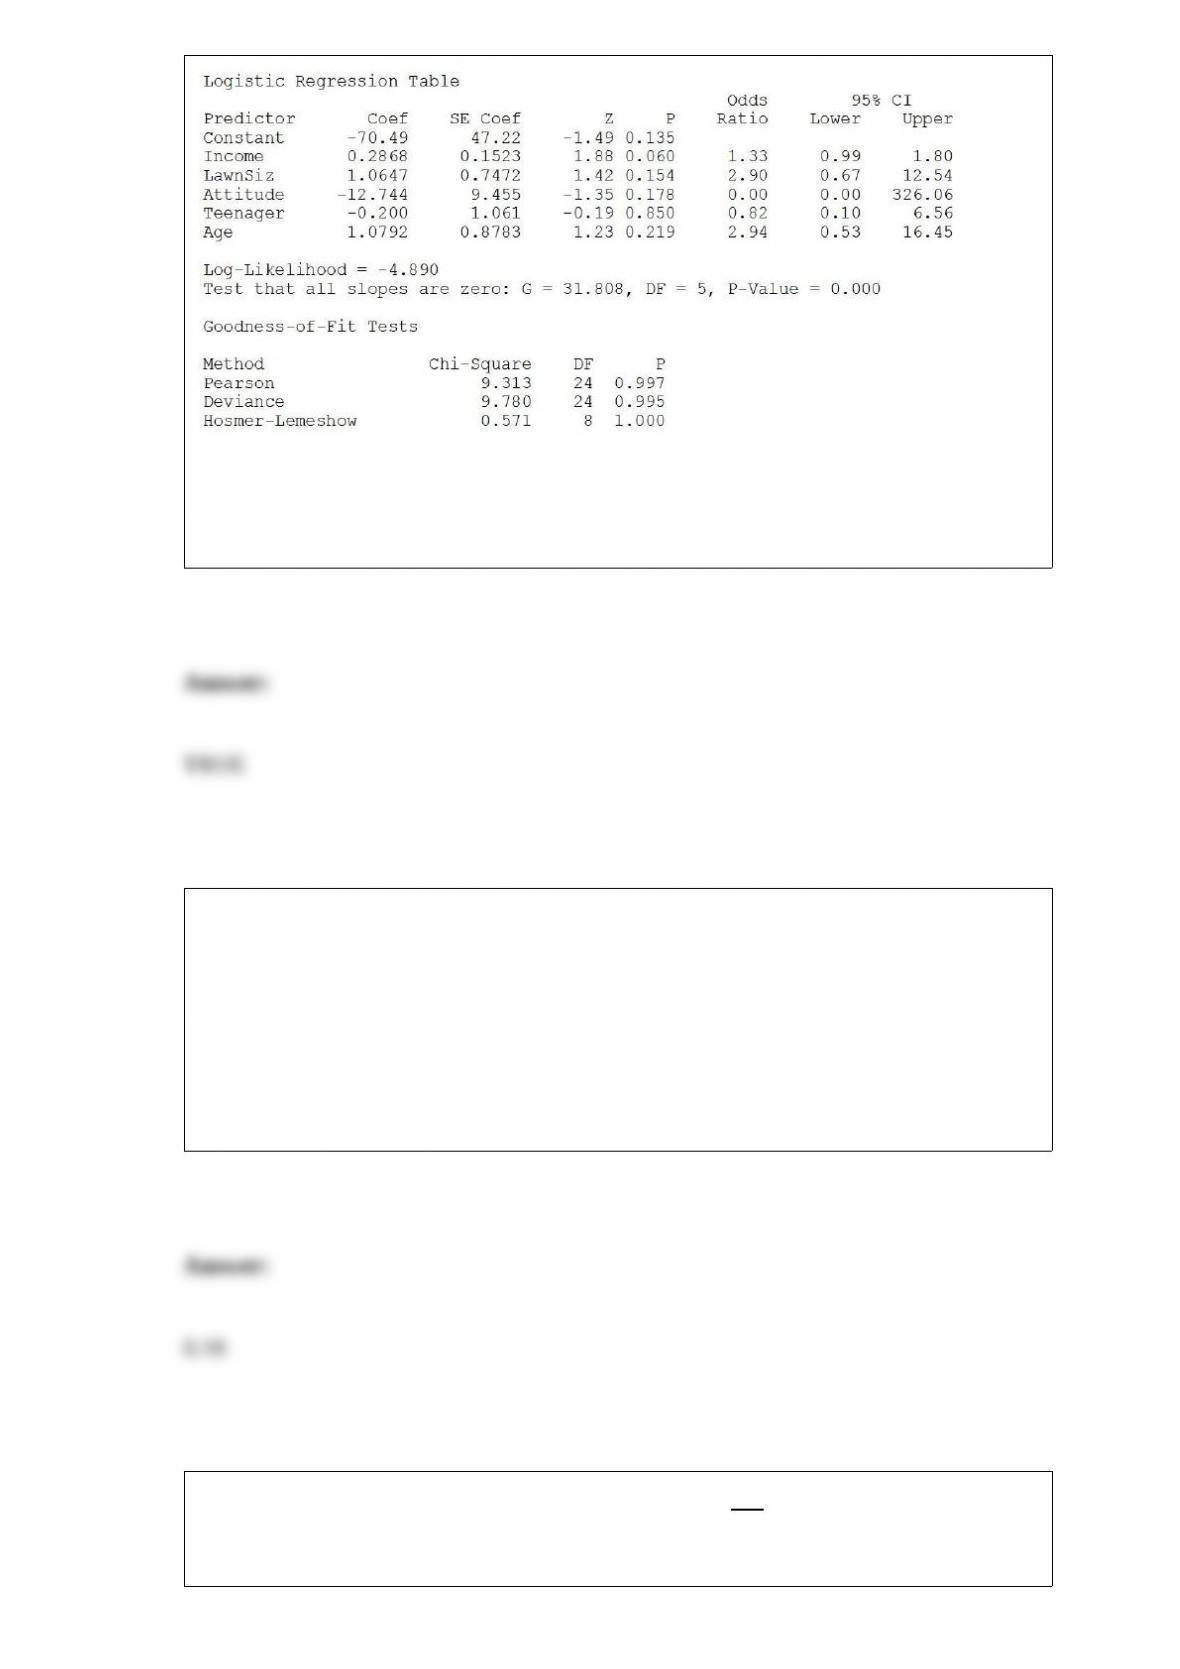
Referring to Table 17-12, there is not enough evidence to conclude that Teenager makes
a significant contribution to the model in the presence of the other independent
variables at a 0.05 level of significance.
TABLE 4-4
Suppose that patrons of a restaurant were asked whether they preferred water or
whether they preferred soda. 70% said that they preferred water. 60% of the patrons
were male. 80% of the males preferred water.
Referring to Table 4-4, the probability that a randomly selected patron is a female who
prefers soda is ________.
Which of the following about the normal distribution is not true?
A) Theoretically, the mean, median, and mode are the same.
B) About of the observations fall within 1 standard deviation from the mean.
C) It is a discrete probability distribution.
D) Its parameters are the mean, and standard deviation, .
In a multiple regression model, the value of the coefficient of multiple determination
A) has to fall between -1 and +1.
B) has to fall between 0 and +1.
C) has to fall between -1 and 0.
D) can fall between any pair of real numbers.
Sales prices of baseball cards from the 1960s are known to possess a right skewed
distribution with a mean sale price of $5.25 and a standard deviation of $2.80. Suppose
a random sample of 100 cards from the 1960s is selected. Describe the sampling
distribution for the sample mean sale price of the selected cards.
A) right skewed with a mean of $5.25 and a standard error of $2.80
B) normal with a mean of $5.25 and a standard error of $0.28
C) right skewed with a mean of $5.25 and a standard error of $0.28
D) normal with a mean of $5.25 and a standard error of $2.80
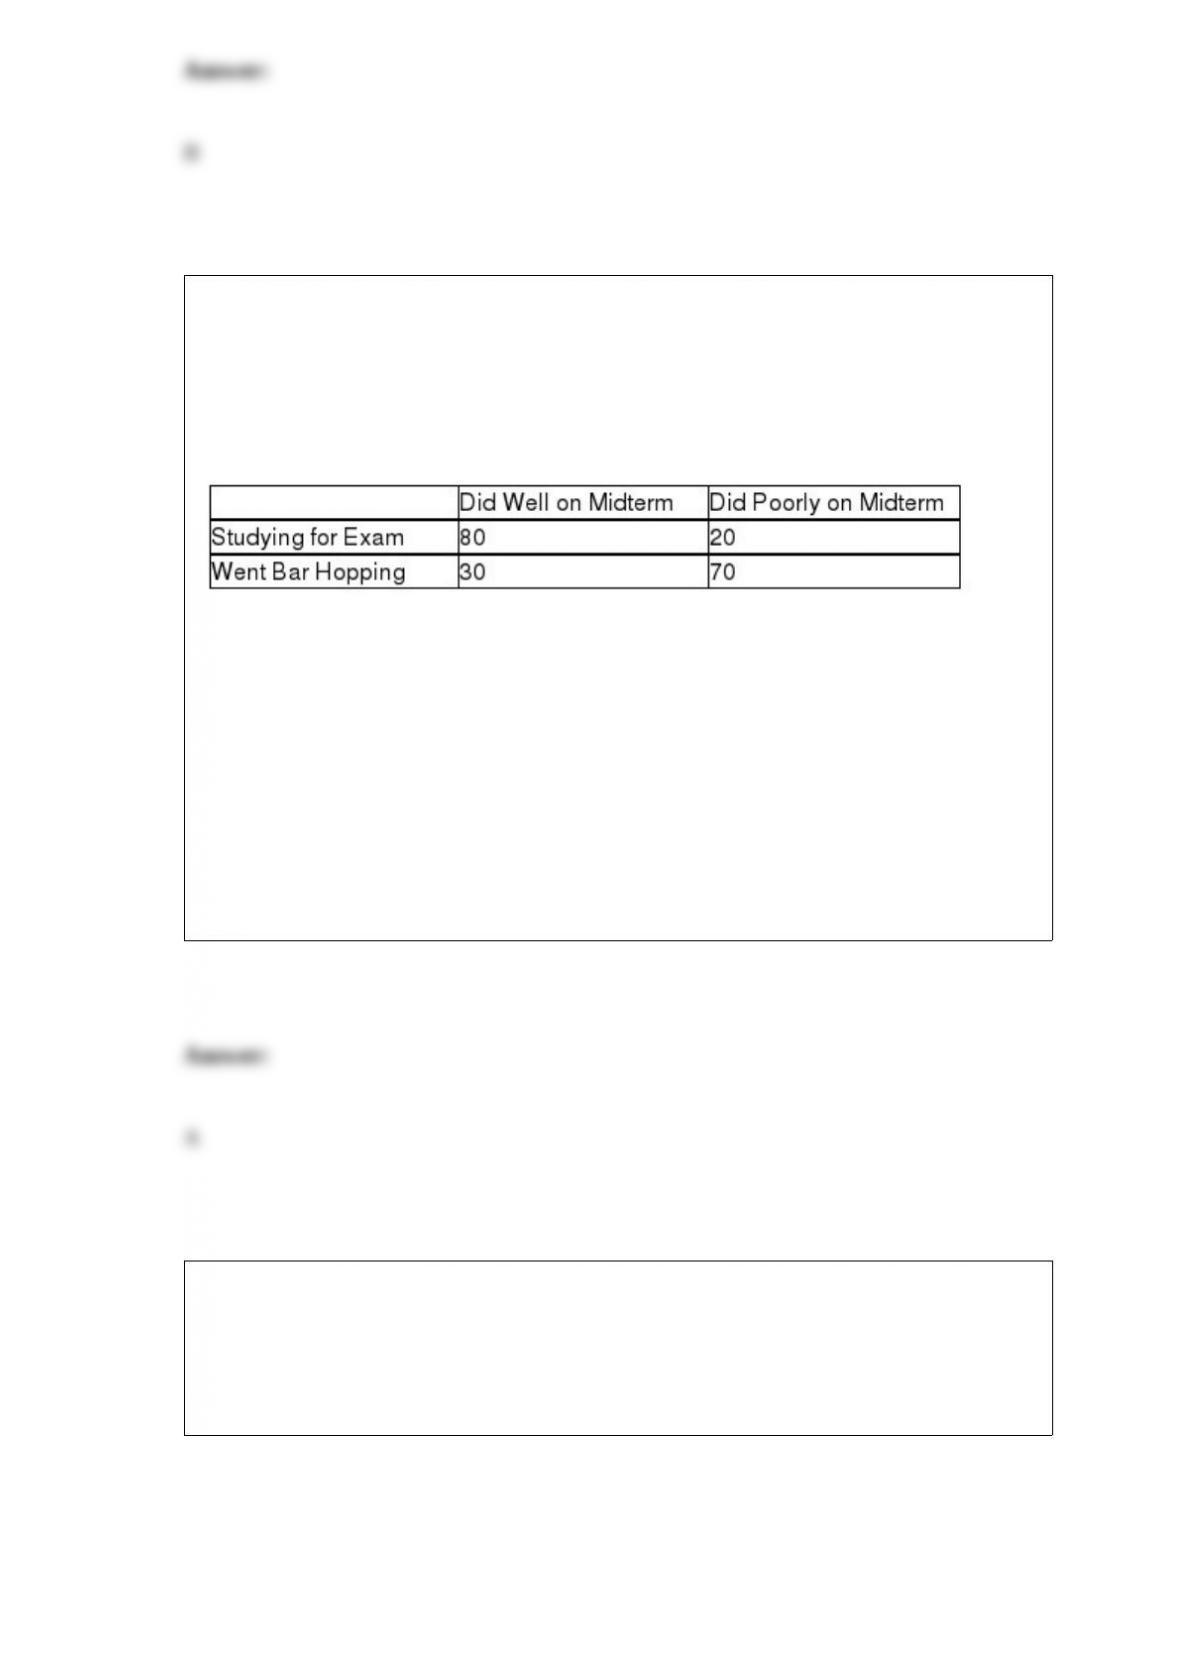
TABLE 4-2
An alcohol awareness task force at a Big-Ten university sampled 200 students after the
midterm to ask them whether they went bar hopping the weekend before the midterm or
spent the weekend studying, and whether they did well or poorly on the midterm. The
following result was obtained.
Referring to Table 4-2, what is the probability that a randomly selected student did well
on the midterm and also went bar hopping the weekend before the midterm?
A) 30/200 or 15%
B) (80 + 30)/200 or 55%
C) (30 + 70)/200 or 50%
D) (80 + 30 + 70)/200 or 90%
TABLE 18-3
A quality control analyst for a light bulb manufacturer is concerned that the time it takes
to produce a batch of light bulbs is too erratic. Accordingly, the analyst randomly
surveys 10 production periods each day for 14 days and records the sample mean and
range for each day.
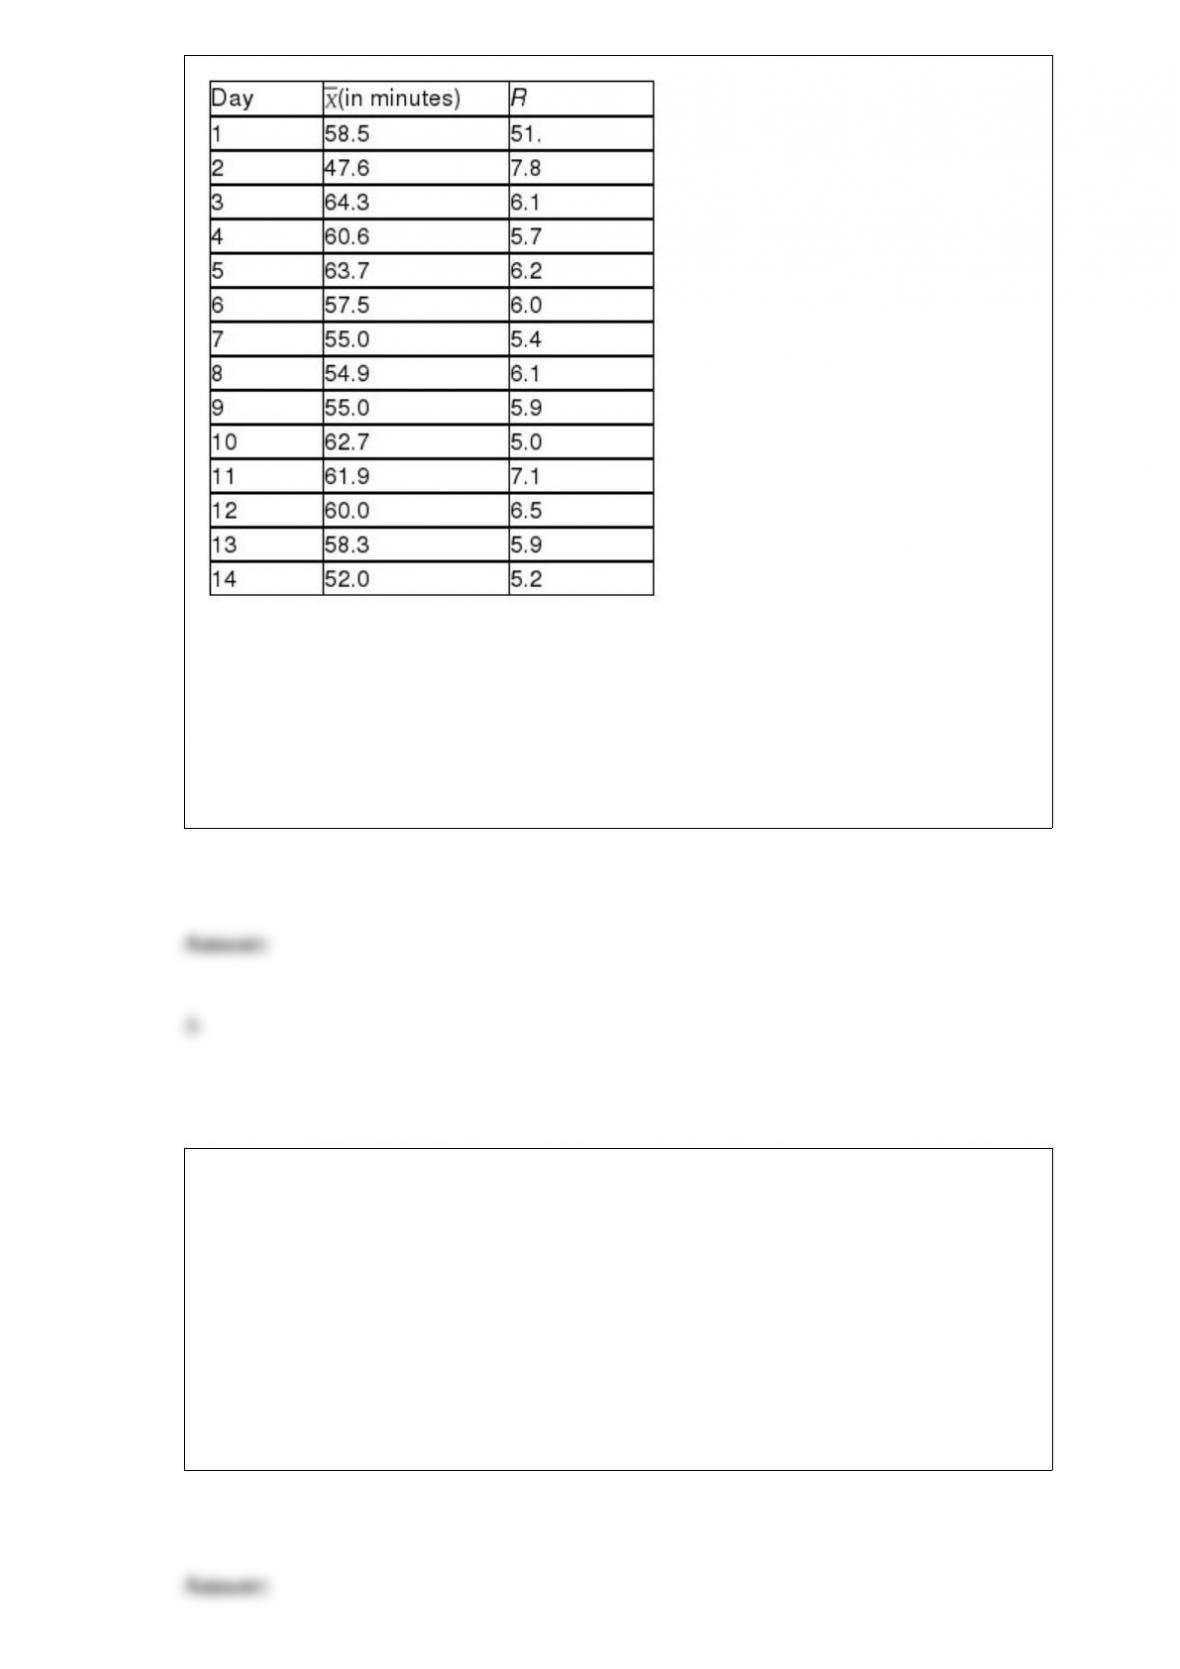
Referring to Table 18-3, suppose the analyst constructs an R chart to see if the
variability in production times is in-control. What is the upper control limit for this R
chart?
A) 10.66
B) 9.37
C) 7.98
D) 6.34
In performing a regression analysis involving two numerical variables, you are
assuming
A) the variances of X and Y are equal.
B) the variation around the line of regression is the same for each X value.
C) that X and Y are independent.
D) All of the above.

The method of moving averages is used
A) to plot a series.
B) to exponentiate a series.
C) to smooth a series.
D) in regression analysis.
Testing for the existence of correlation is equivalent to
A) testing for the existence of the slope ( 1).
B) testing for the existence of the Y-intercept ( 0).
C) the confidence interval estimate for predicting Y.
D) None of the above.
An agronomist wants to compare the crop yield of 3 varieties of chickpea seeds. She
plants all 3 varieties of the seeds on each of 5 different patches of fields. She then
measures the crop yield in bushels per acre. She has found out that the different
varieties do have an impact on crop yield. Which of the following tests will be the most
appropriate to find out which variety will produce the highest yield?
A) One-way ANOVA F test for differences among more than two means
B) McNemar test

C) Tukey-Kramer multiple comparisons procedure for one-way ANOVA
D) Tukey multiple comparisons procedure for randomized block designs
A business venture can result in the following outcomes (with their corresponding
chance of occurring in parentheses): Highly Successful (10%), Successful (25%), Break
Even (25%), Disappointing (20%), and Highly Disappointing (?). If these are the only
outcomes possible for the business venture, what is the chance that the business venture
will be considered Highly Disappointing?
A) 10%
B) 15%
C) 20%
D) 25%
Which measure of central tendency can be used for both numerical and categorical
variables?
A) arithmetic mean
B) median
C) mode
D) geometric mean
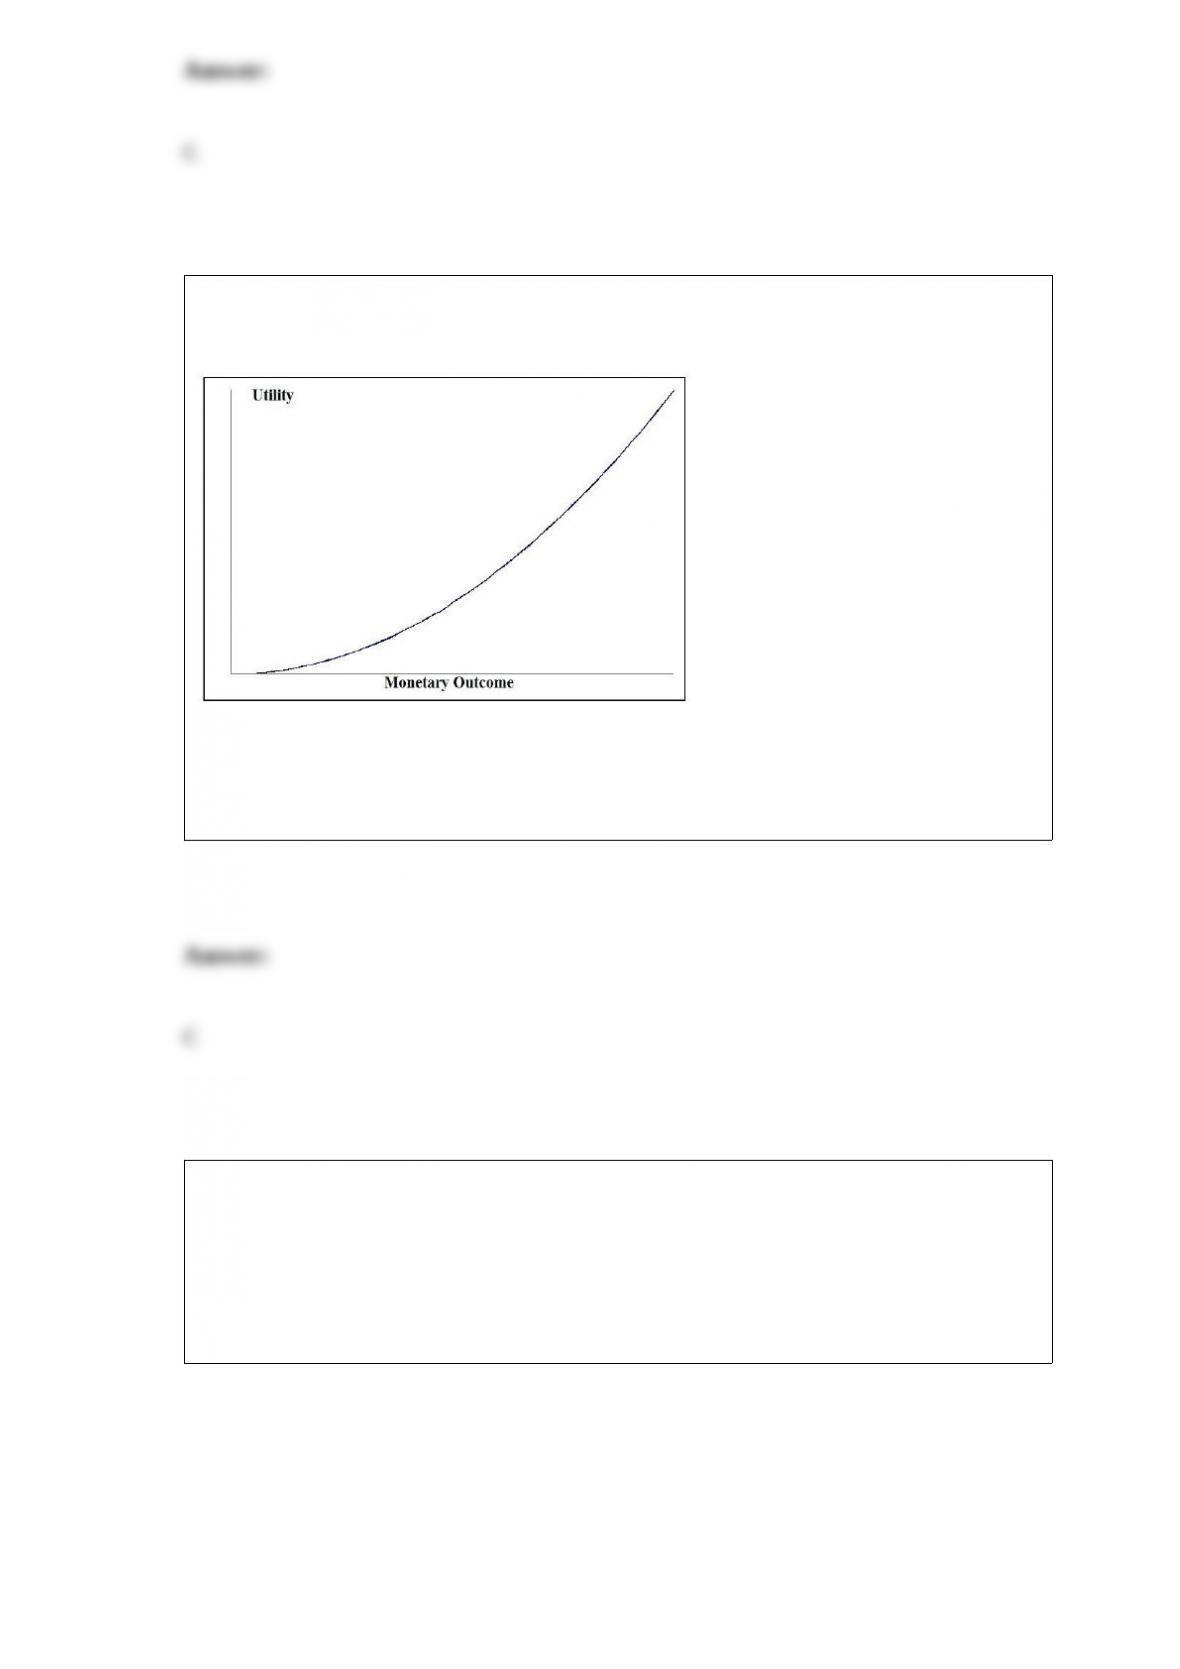
Look at the utility function graphed below and select the type of decision maker that
corresponds to the graph.
A) Risk averter
B) Risk neutral
C) Risk taker
D) Risk player
TABLE 12-15
Two new different models of compact SUVs have just arrived at the market. You are
interested in comparing the gas mileage performance of both models to see if they are
the same. A partial computer output for twelve compact SUVs of model 1 and thirteen
of model 2 is given below:
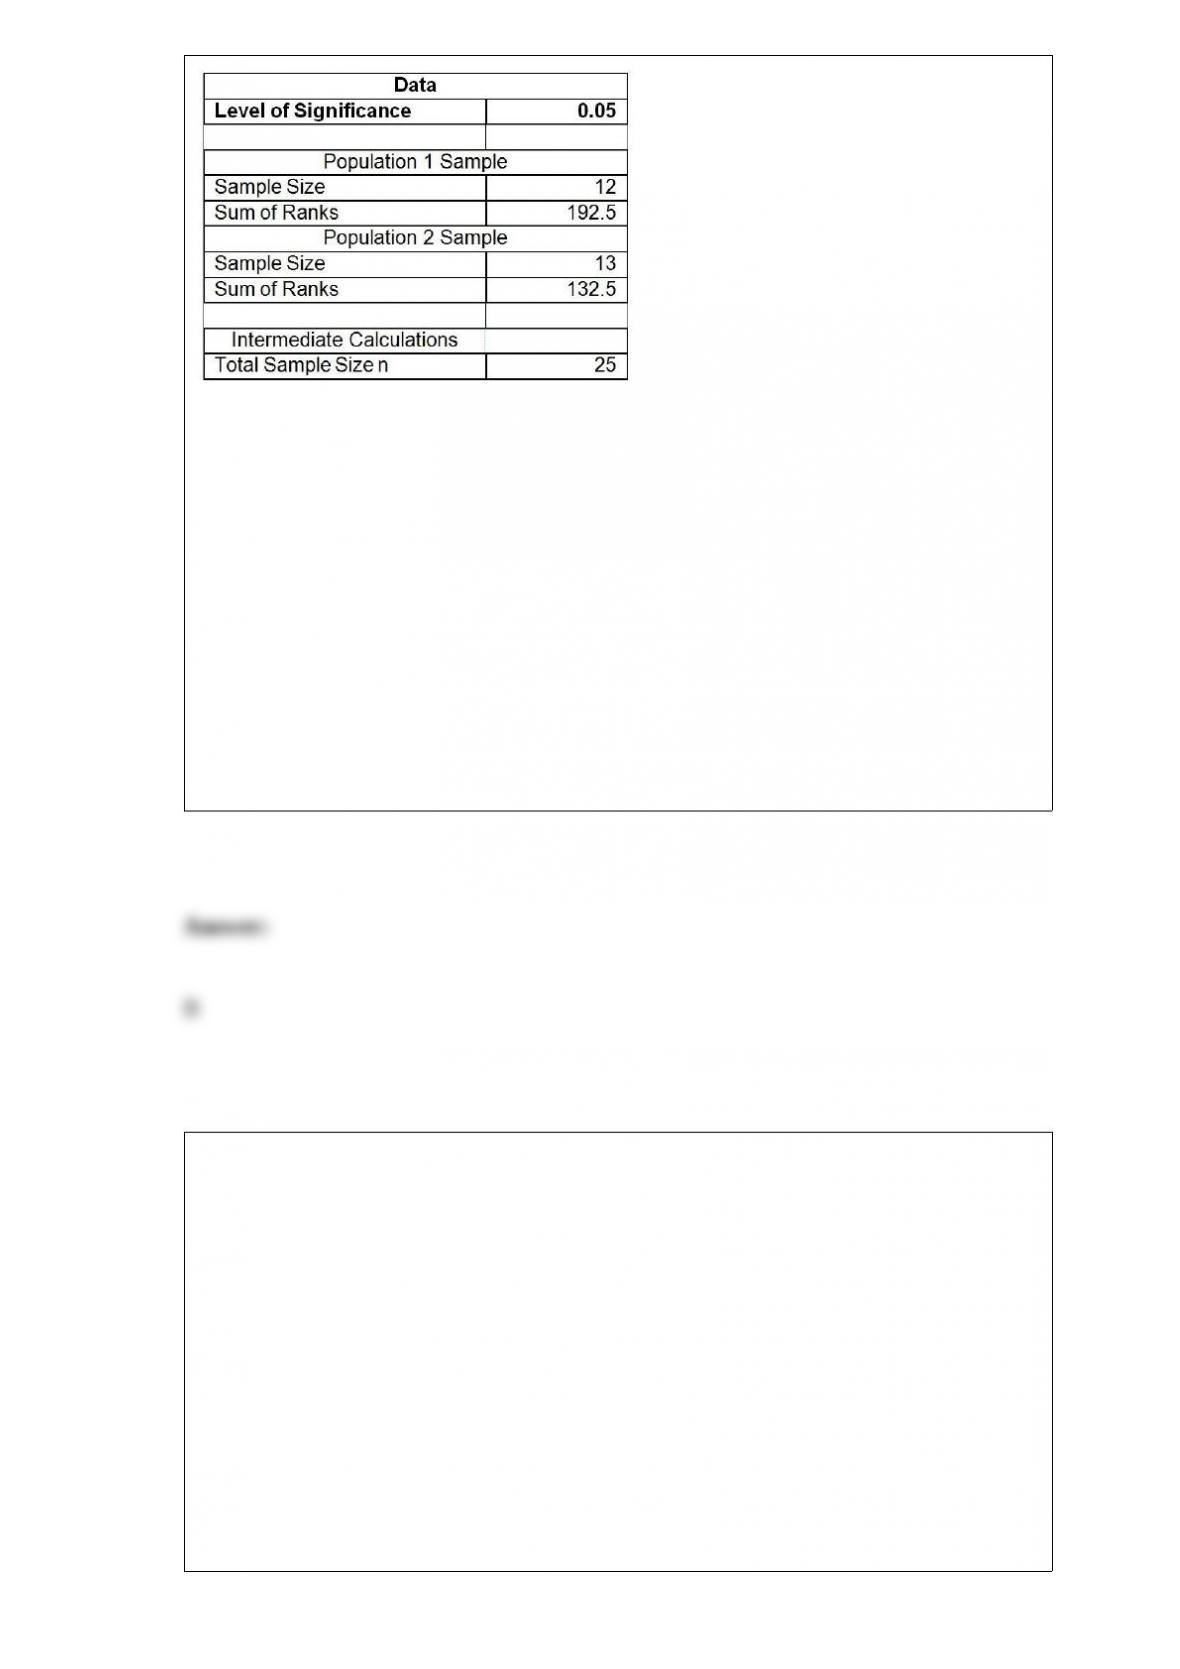
You are told that the gas mileage population distributions for both models are not
normally distributed.
Referring to Table 12-15, what is your conclusion on the test using a 5% level of
significance?
A) There is not enough evidence of a difference in median gas mileage.
B) There is evidence of a difference in median gas mileage.
C) There is not enough evidence of a difference in mean gas mileage.
D) There is evidence of a difference in mean gas mileage.
TABLE 9-12
A drug company is considering marketing a new local anesthetic. The effective time of
the anesthetic the drug company is currently producing has a normal distribution with a
mean of 7.4 minutes with a standard deviation of 1.2 minutes. The chemistry of the new
anesthetic is such that the effective time should be normally distributed with the same
standard deviation. The company will market the new local anesthetic as being better if
there is evidence that the population mean effective time is greater than the 7.4 minutes
of the current local anesthetic.
Referring to Table 9-12, if you select a sample of 25 new local anesthetics and are
willing to have a level of significance of 0.05, the probability of the company failing to
market the new local anesthetic when it is better is ________ if the population mean
effective time is 8 minutes.
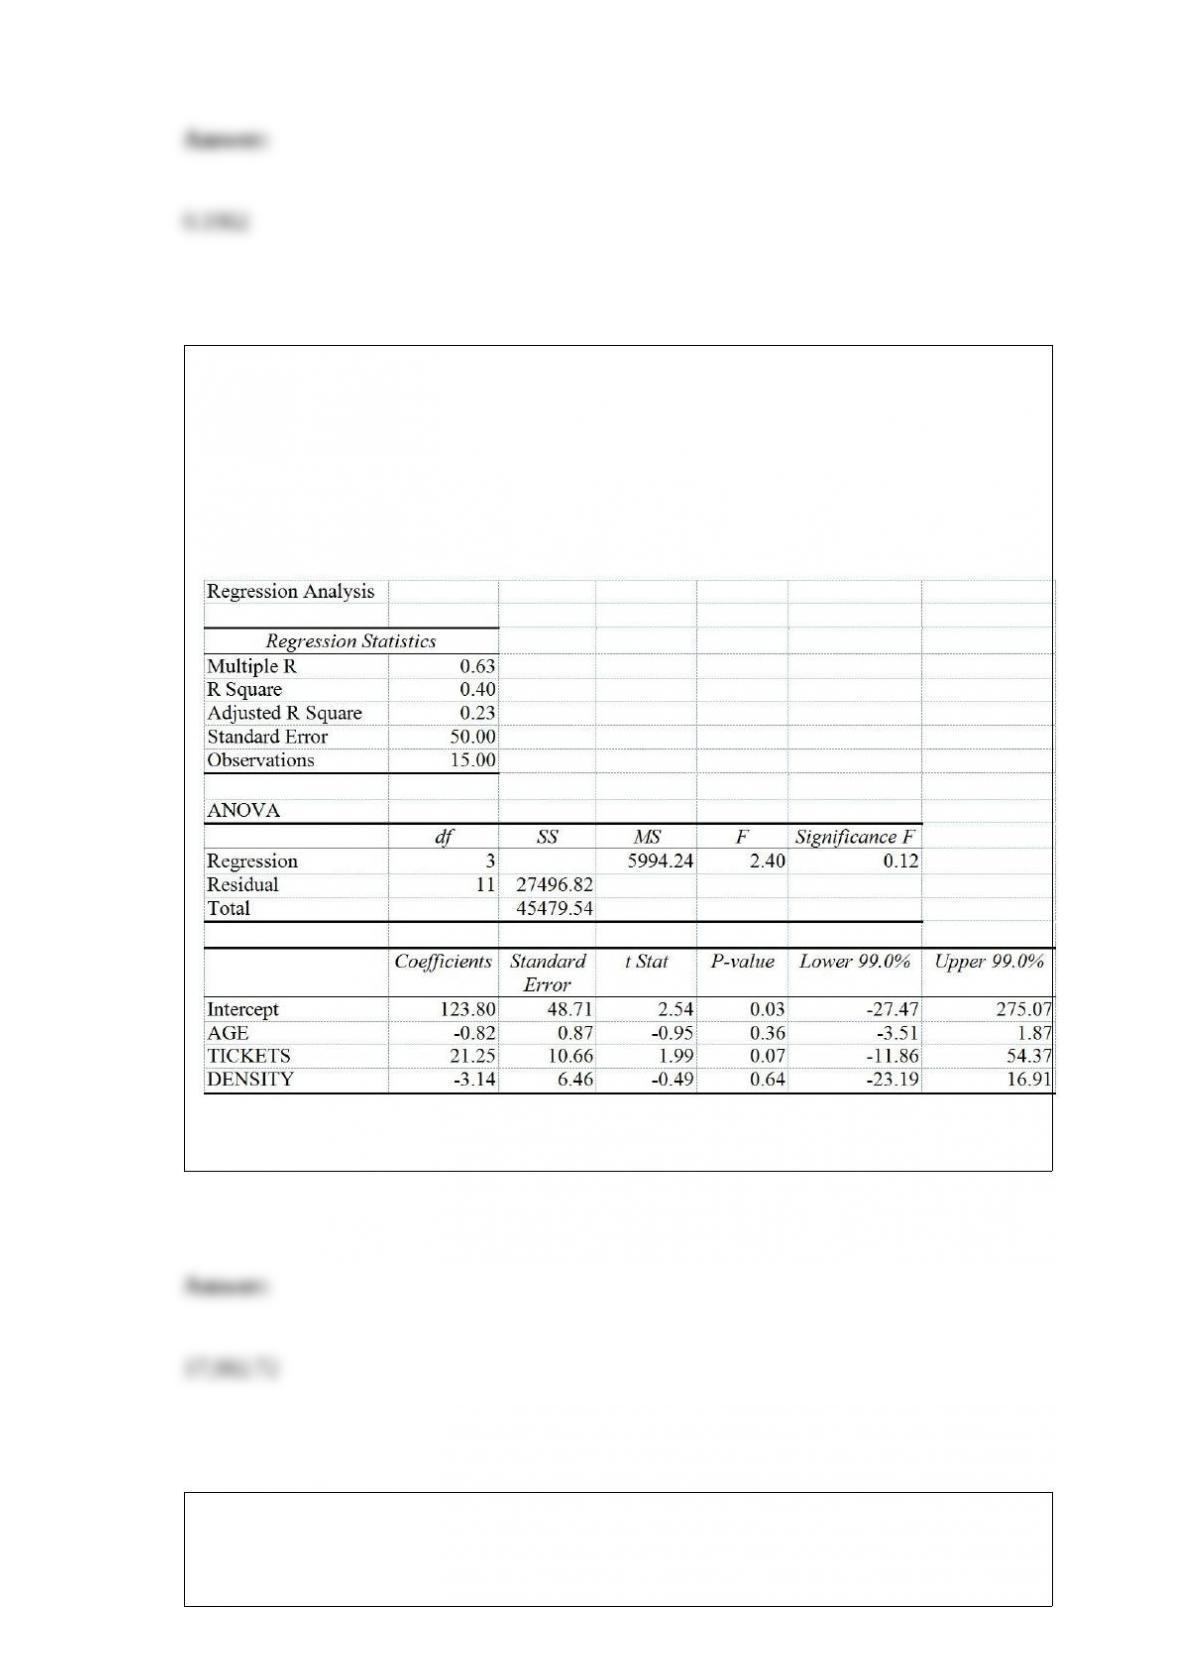
TABLE 17-5
You worked as an intern at We Always Win Car Insurance Company last summer. You
notice that individual car insurance premiums depend very much on the age of the
individual, the number of traffic tickets received by the individual, and the population
density of the city in which the individual lives. You performed a regression analysis in
EXCEL and obtained the following information:
Referring to Table 17-5, the regression sum of squares that is missing in the ANOVA
table should be ________.
TABLE 5-9
A major hotel chain keeps a record of the number of mishandled bags per 1,000
customers. In a recent year, the hotel chain had 4.06 mishandled bags per 1,000
customers. Assume that the number of mishandled bags has a Poisson distribution.
Referring to Table 5-9, what is the probability that in the next 1,000 customers, the
hotel chain will have fewer than eight mishandled bags?
Most colleges admit students based on their achievements in a number of different
areas. The grade obtained in senior level English (A, B, C, D, or F) is an example of a
________ variable.
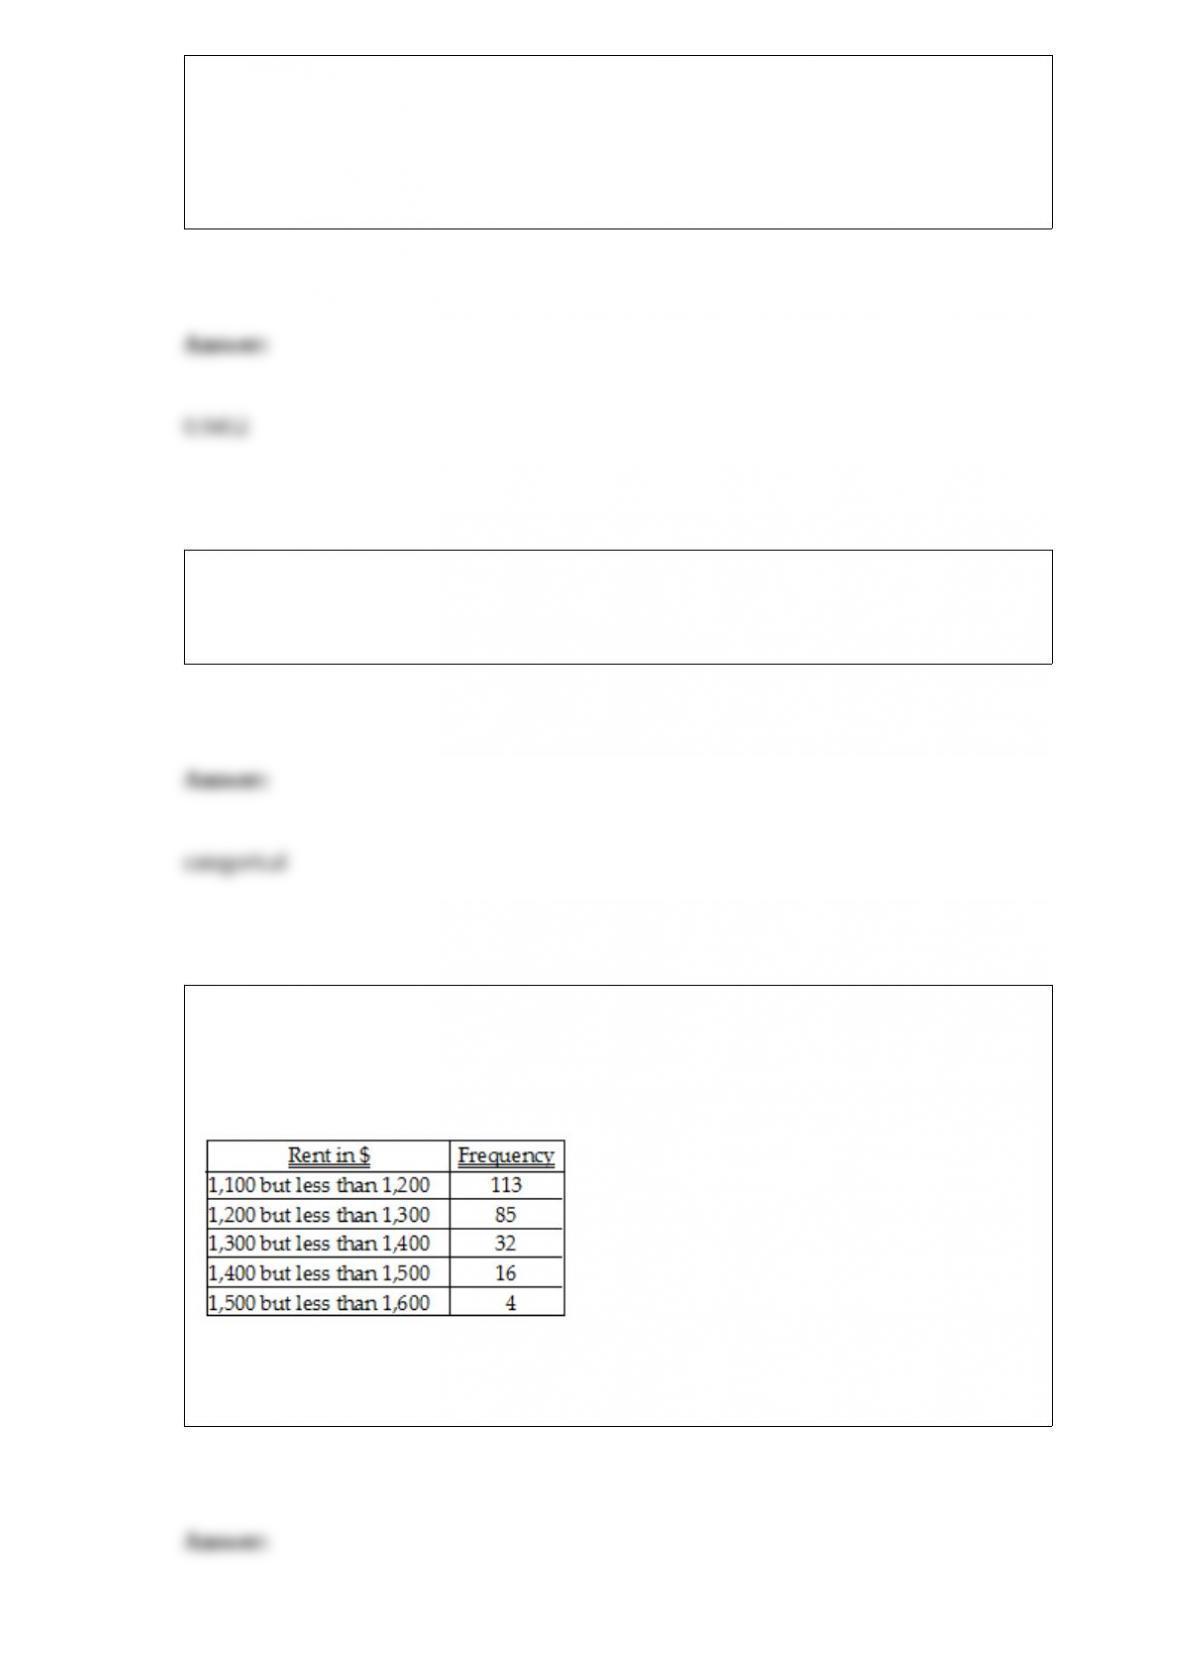
TABLE 2-9
The frequency distribution below represents the rents of 250 randomly selected
federally subsidized apartments in a small town.
Referring to Table 2-9, ________ apartments rented for at least $1,200 but less than
$1,400.
TABLE 8-13
A wealthy real estate investor wants to decide whether it is a good investment to build a
high-end shopping complex in a suburban county in Houston. His main concern is the
total market value of the 3,605 houses in the suburban county. He commissioned a
statistical consulting group to take a sample of 200 houses and obtained a sample mean
market price of $225,000 and a sample standard deviation of $38,700. The consulting
group also found out that the mean differences between market prices and appraised
prices was $125,000 with a standard deviation of $3,400. Also the proportion of houses
in the sample that are appraised for higher than the market prices is 0.24.
Referring to Table 8-13, what will be the 90% confidence interval for the total market
price of the houses in the suburban county constructed by the consulting group?
Referring to Table 14-17, what are the lower and upper limits of the
95% confidence interval estimate for the di!erence in the mean
number of weeks a worker is unemployed due to a layo! between a
worker who is in a management position and one who is not after
taking into consideration the e!ect of all the other independent
variables?
TABLE 14-17
Given below are results from the regression analysis where the
dependent variable is the number of weeks a worker is unemployed
due to a layo! (Unemploy) and the independent variables are the age
of the worker (Age) and a dummy variable for management position
(Manager: 1 = yes, 0 = no).
The results of the regression analysis are given below:
