The Dean of Students conducted a survey on campus. Class designation (Freshman,
Sophomore, Junior, Senior) is an example of a ________ variable.
Suppose Z has a standard normal distribution with a mean of 0 and standard deviation
of 1. So, 85% of the possible Z values are smaller than ________.
TABLE 17-10
Given below are results from the regression analysis where the dependent variable is
the number of weeks a worker is unemployed due to a layoff (Unemploy) and the
independent variables are the age of the worker (Age), the number of years of education
received (Edu), the number of years at the previous job (Job Yr), a dummy variable for
marital status (Married: 1 = married, 0 = otherwise), a dummy variable for head of
household (Head: 1 = yes, 0 = no) and a dummy variable for management position
(Manager: 1 = yes, 0 = no). We shall call this Model 1. The coefficient of partial
determination ( ) of each of the 6 predictors are, respectively,
0.2807, 0.0386, 0.0317, 0.0141, 0.0958, and 0.1201.
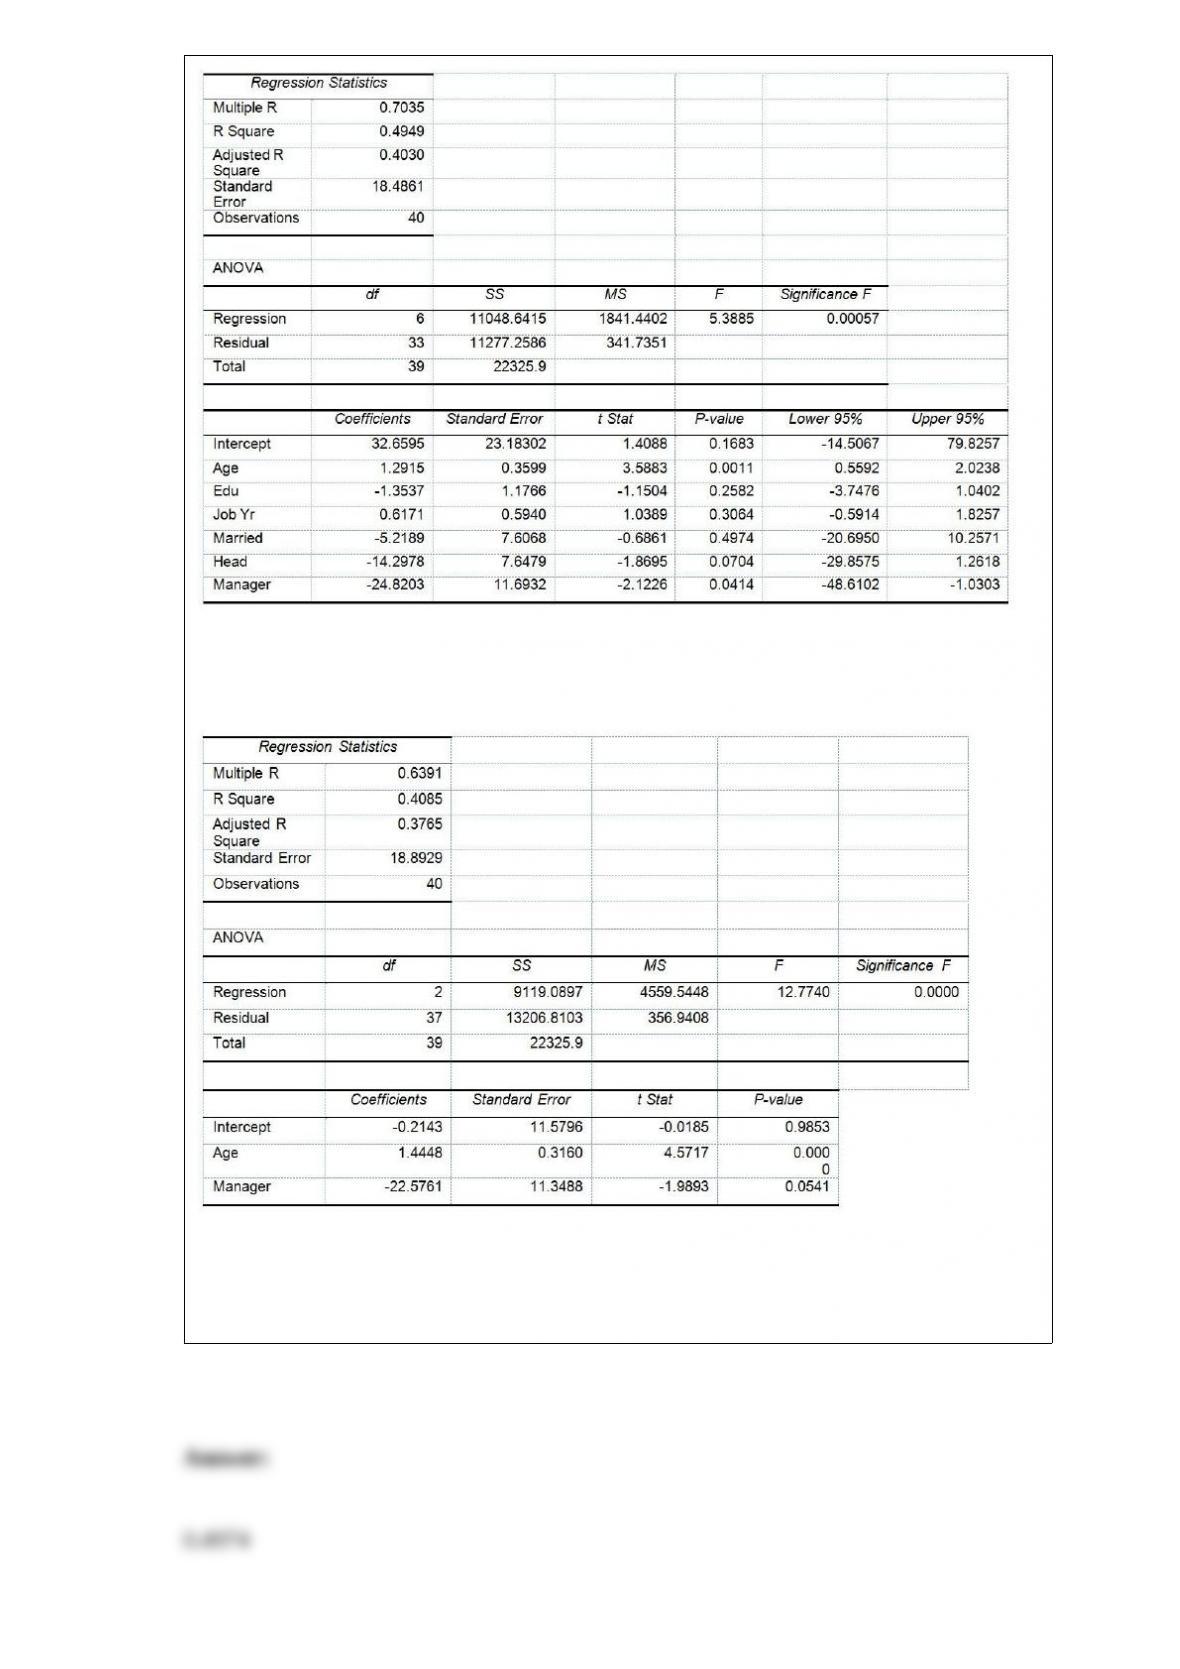
Model 2 is the regression analysis where the dependent variable is Unemploy and the
independent variables are Age and Manager. The results of the regression analysis are
given below:
Referring to Table 17-10, Model 1, what is the p-value of the test statistic when testing
whether being married or not makes a difference in the mean number of weeks a worker
is unemployed due to a layoff while holding constant the effect of all the other
independent variables?

Referring to Table 14-15, what is the p-value of the test statistic when
testing whether mean teacher salary has any effect on percentage of
students passing the proficiency test, taking into account the effect of
instructional spending per pupil?
TABLE 14-15
The superintendent of a school district wanted to predict the
percentage of students passing a sixth-grade proficiency test. She
obtained the data on percentage of students passing the proficiency
test (% Passing), mean teacher salary in thousands of dollars
(Salaries), and instructional spending per pupil in thousands of dollars
(Spending) of 47 schools in the state.
Following is the multiple regression output with Y = % Passing as the
dependent variable, X1 = Salaries and X2 = Spending:

TABLE 9-10
A manufacturer produces light bulbs that have a mean life of at least 500 hours when
the production process is working properly. Based on past experience, the population
standard deviation is 50 hours and the light bulb life is normally distributed. The
operations manager stops the production process if there is evidence that the population
mean light bulb life is below 500 hours.
Referring to Table 9-10, if you select a sample of 100 light bulbs and are willing to have
a level of significance of 0.10, the probability of a Type II error is ________ if the
population mean bulb life is 490 hours.
TABLE 8-10
A sales and marketing management magazine conducted a survey on salespeople
cheating on their expense reports and other unethical conduct. In the survey on 200
managers, 58% of the managers have caught salespeople cheating on an expense report,
50% have caught salespeople working a second job on company time, 22% have caught
salespeople listing a ‘strip bar” as a restaurant on an expense report, and 19% have
caught salespeople giving a kickback to a customer.
Referring to Table 8-10, the sampling error of a 95% confidence interval estimate of the
population proportion of managers who have caught salespeople cheating on an
expense report is ________.
TABLE 6-6
According to Investment Digest, the arithmetic mean of the annual return for common
stocks over an 85-year period was 9.5%, but the value of the variance was not
mentioned. Also 25% of the annual returns were below 8%, while 65% of the annual

returns were between 8% and 11.5%. The article claimed that the distribution of annual
return for common stocks was bell-shaped and approximately symmetric. Assume that
this distribution is normal with the mean given above. Answer the following questions
without the help of a calculator, statistical software or statistical table.
Referring to Table 6-6, what is the value above which will account for the highest 25%
of the possible annual returns?