Unlock document.
This document is partially blurred.
Unlock all pages and 1 million more documents.
Get Access
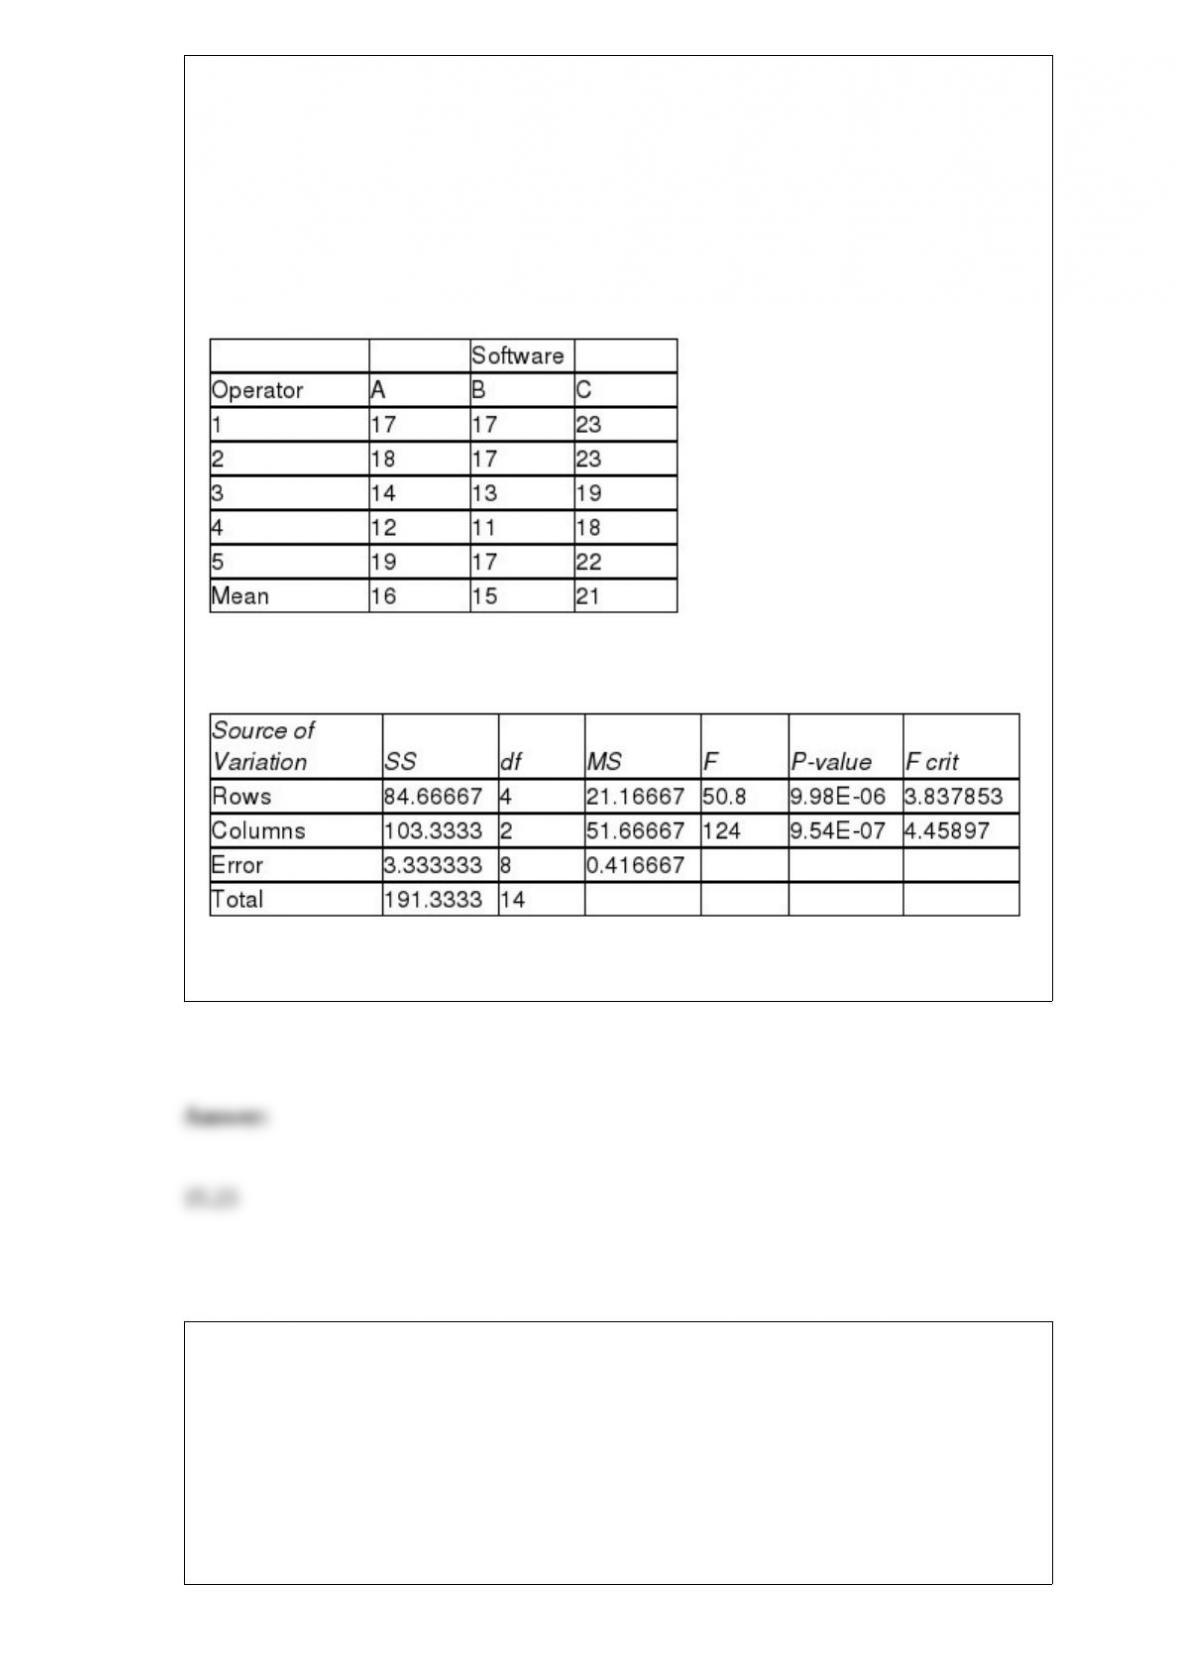
TABLE 11-8
An important factor in selecting database software is the time required for a user to
learn how to use the system. To evaluate three potential brands (A, B and C) of database
software, a company designed a test involving five different employees. To reduce
variability due to differences among employees, each of the five employees is trained
on each of the three different brands. The amount of time (in hours) needed to learn
each of the three different brands is given below:
Below is the Excel output for the randomized block design:
Referring to Table 11-8, what is the estimated relative efficiency?
TABLE 4-10
Are whites more likely to claim bias? It was found that 60% of the workers were white,
30% were black and 10% are other races. Given that a worker was white, the
probability that the worker had claimed bias was 30%. Given that a worker was black,
the probability that the worker had claimed bias was 40%. Given that a worker was
other race, the probability that the worker had claimed bias was 0%.
Referring to Table 4-10, when a randomly selected worker was not white, what is the
probability that the worker had not claimed bias?
TABLE 6-3
Suppose the time interval between two consecutive defective light bulbs from a
production line has a uniform distribution over an interval from 0 to 90 minutes.
Referring to Table 6-3, what is the probability that the time interval between two
consecutive defective light bulbs will be at least 90 minutes?
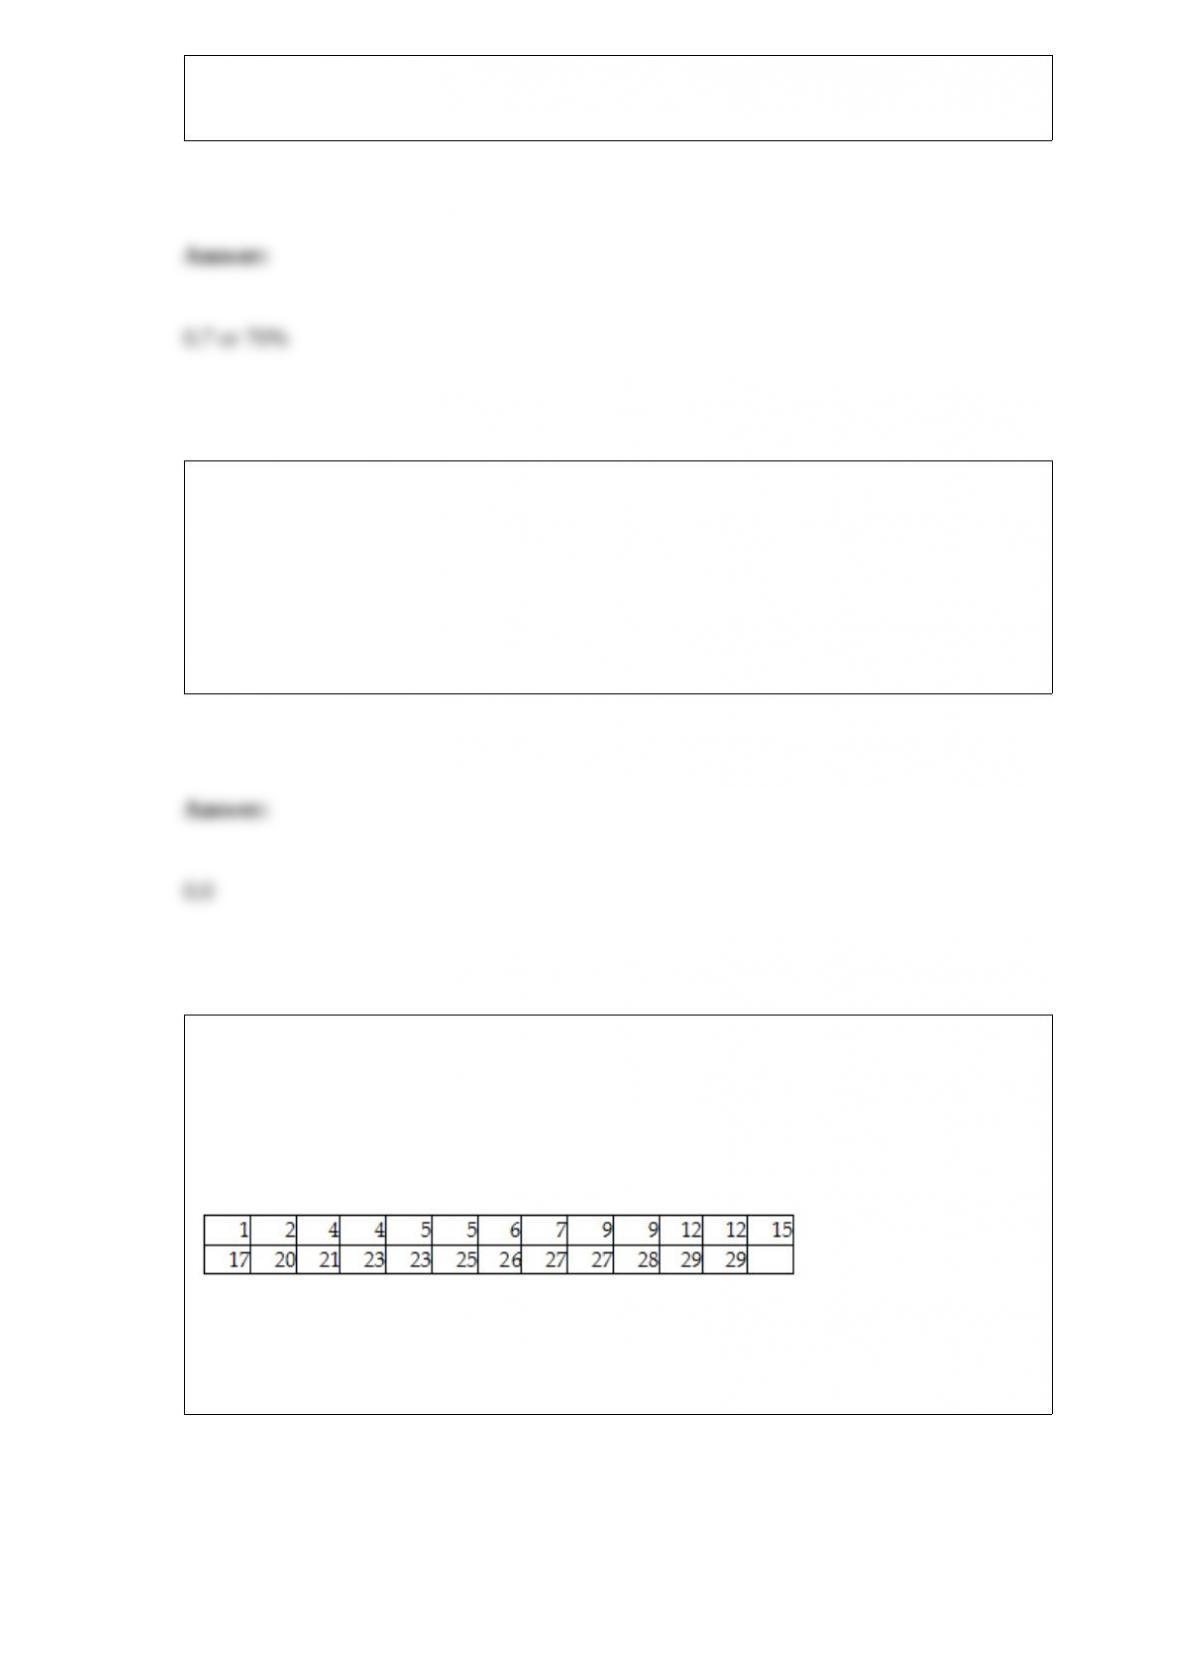
TABLE 2-11
The ordered array below resulted from selecting a sample of 25 batches of 500
computer chips and determining how many in each batch were defective.
Defects
Referring to Table 2-11, construct a cumulative percentage distribution for the defects
data if the corresponding frequency distribution uses "0 but less than 5" as the first
class.
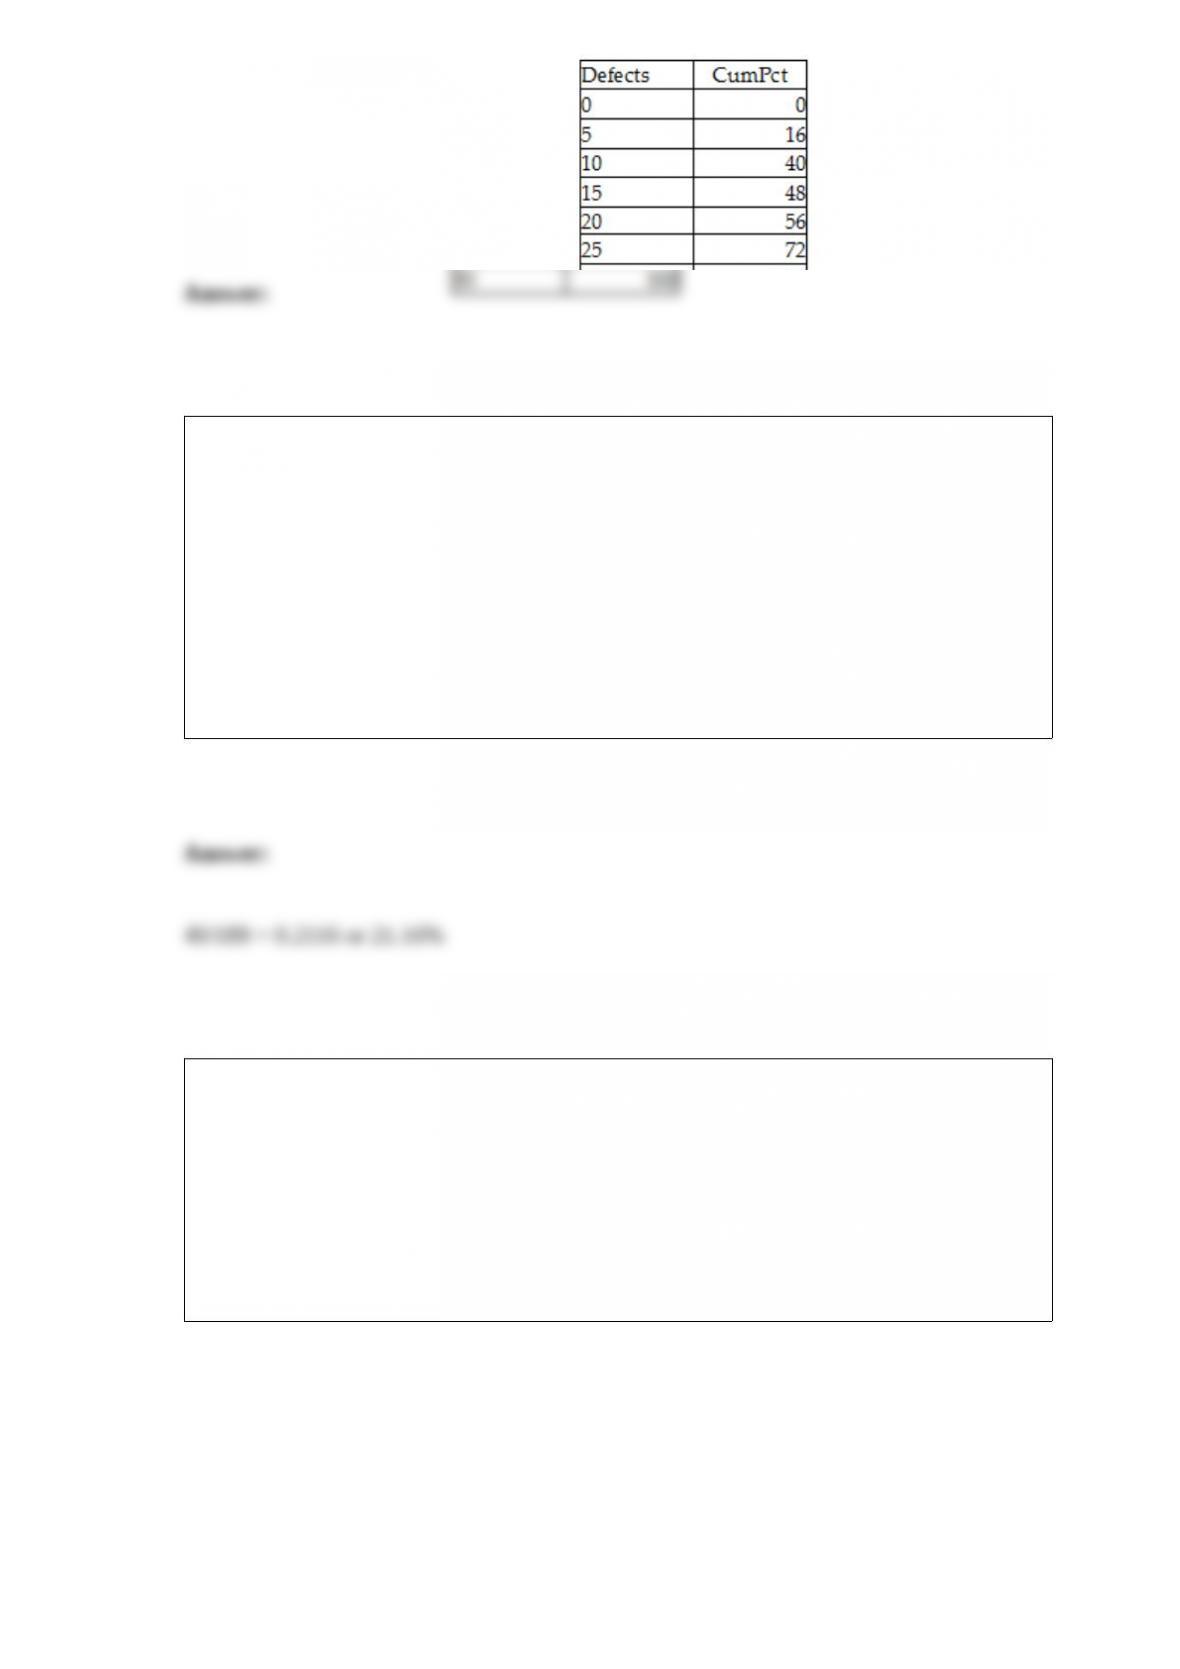
TABLE 13-13
In this era of tough economic conditions, voters increasingly ask the question: "Is the
educational achievement level of students dependent on the amount of money the state
in which they reside spends on education?" The partial computer output below is the
result of using spending per student ($) as the independent variable and composite score
which is the sum of the math, science and reading scores as the dependent variable on
35 states that participated in a study. The table includes only partial results.
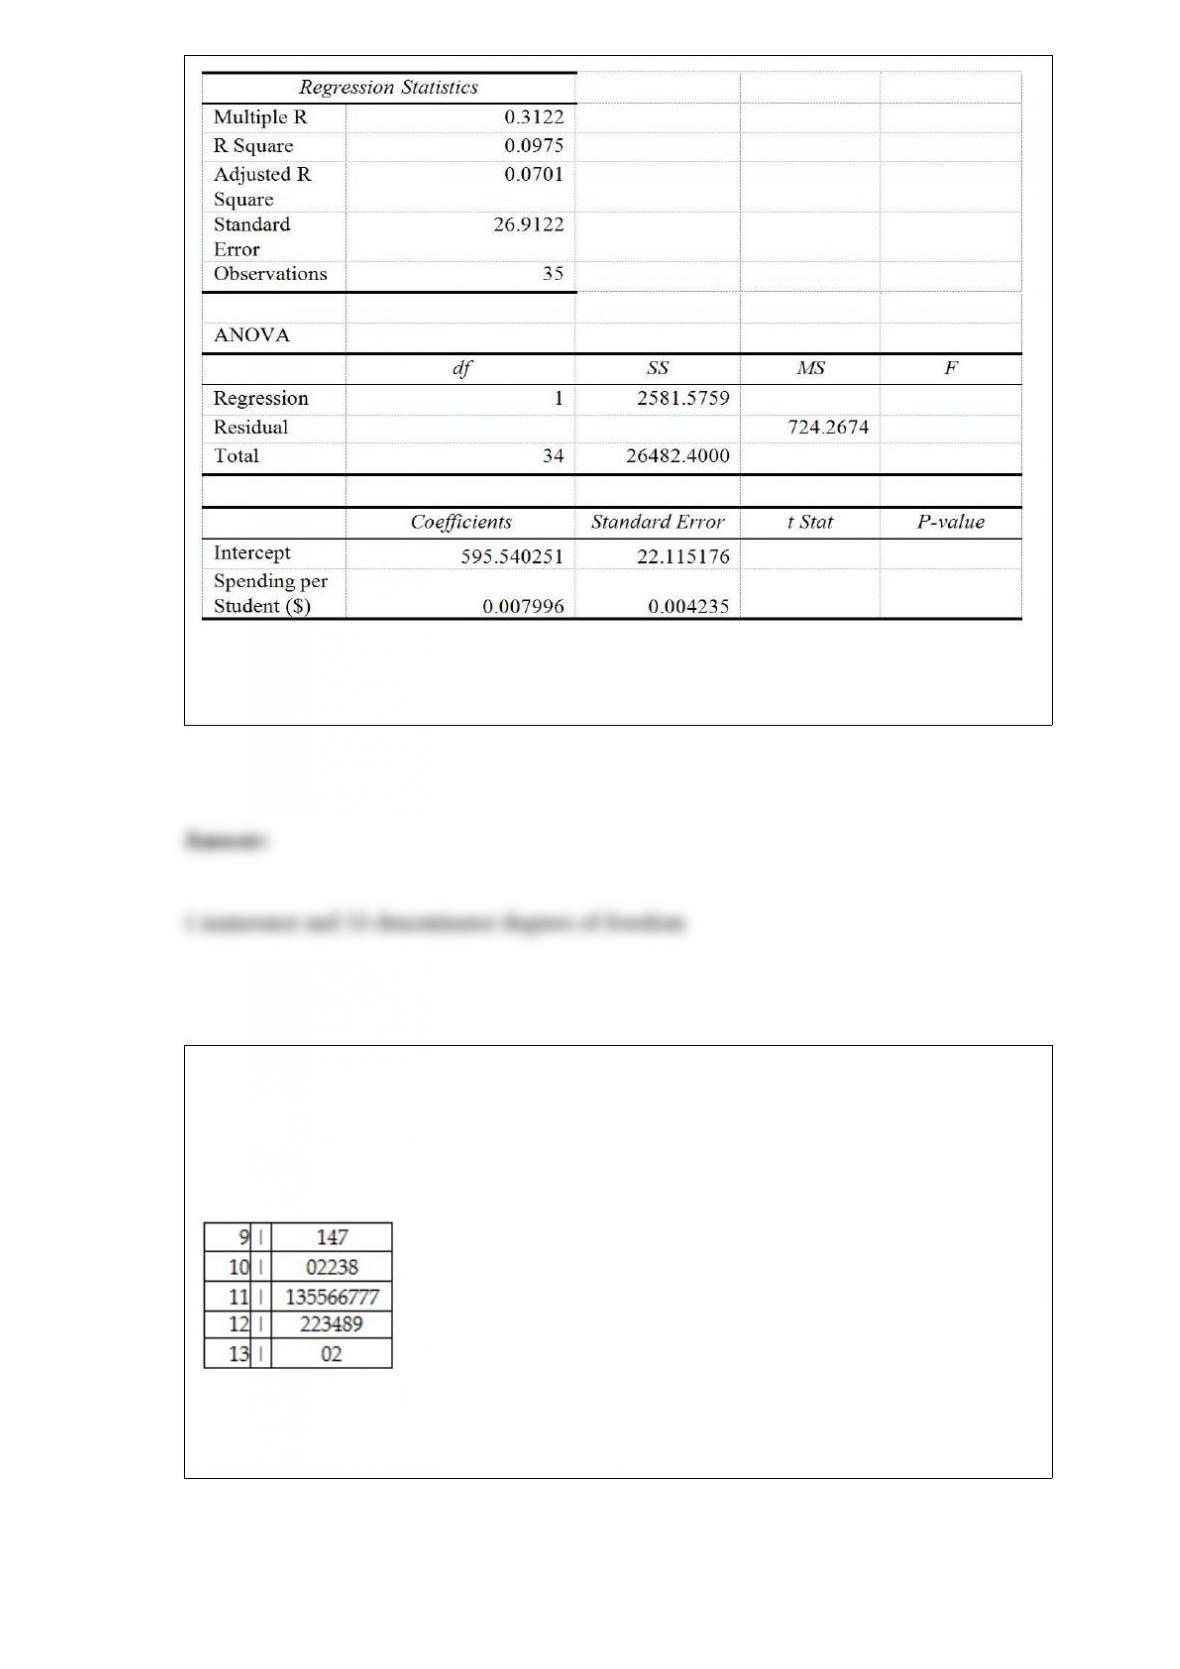
Referring to Table 13-13, the degrees of freedom for the F test on whether spending per
student affects composite scores are ________.
TABLE 2-13
Given below is the stem-and-leaf display representing the amount of detergent used in
gallons (with leaves in 10ths of gallons) in a day by 25 drive-through car wash
operations in Phoenix.
Referring to Table 2-13, construct a percentage polygon for the detergent data if the
corresponding frequency distribution uses "9.0 but less than 10.0" as the first class.
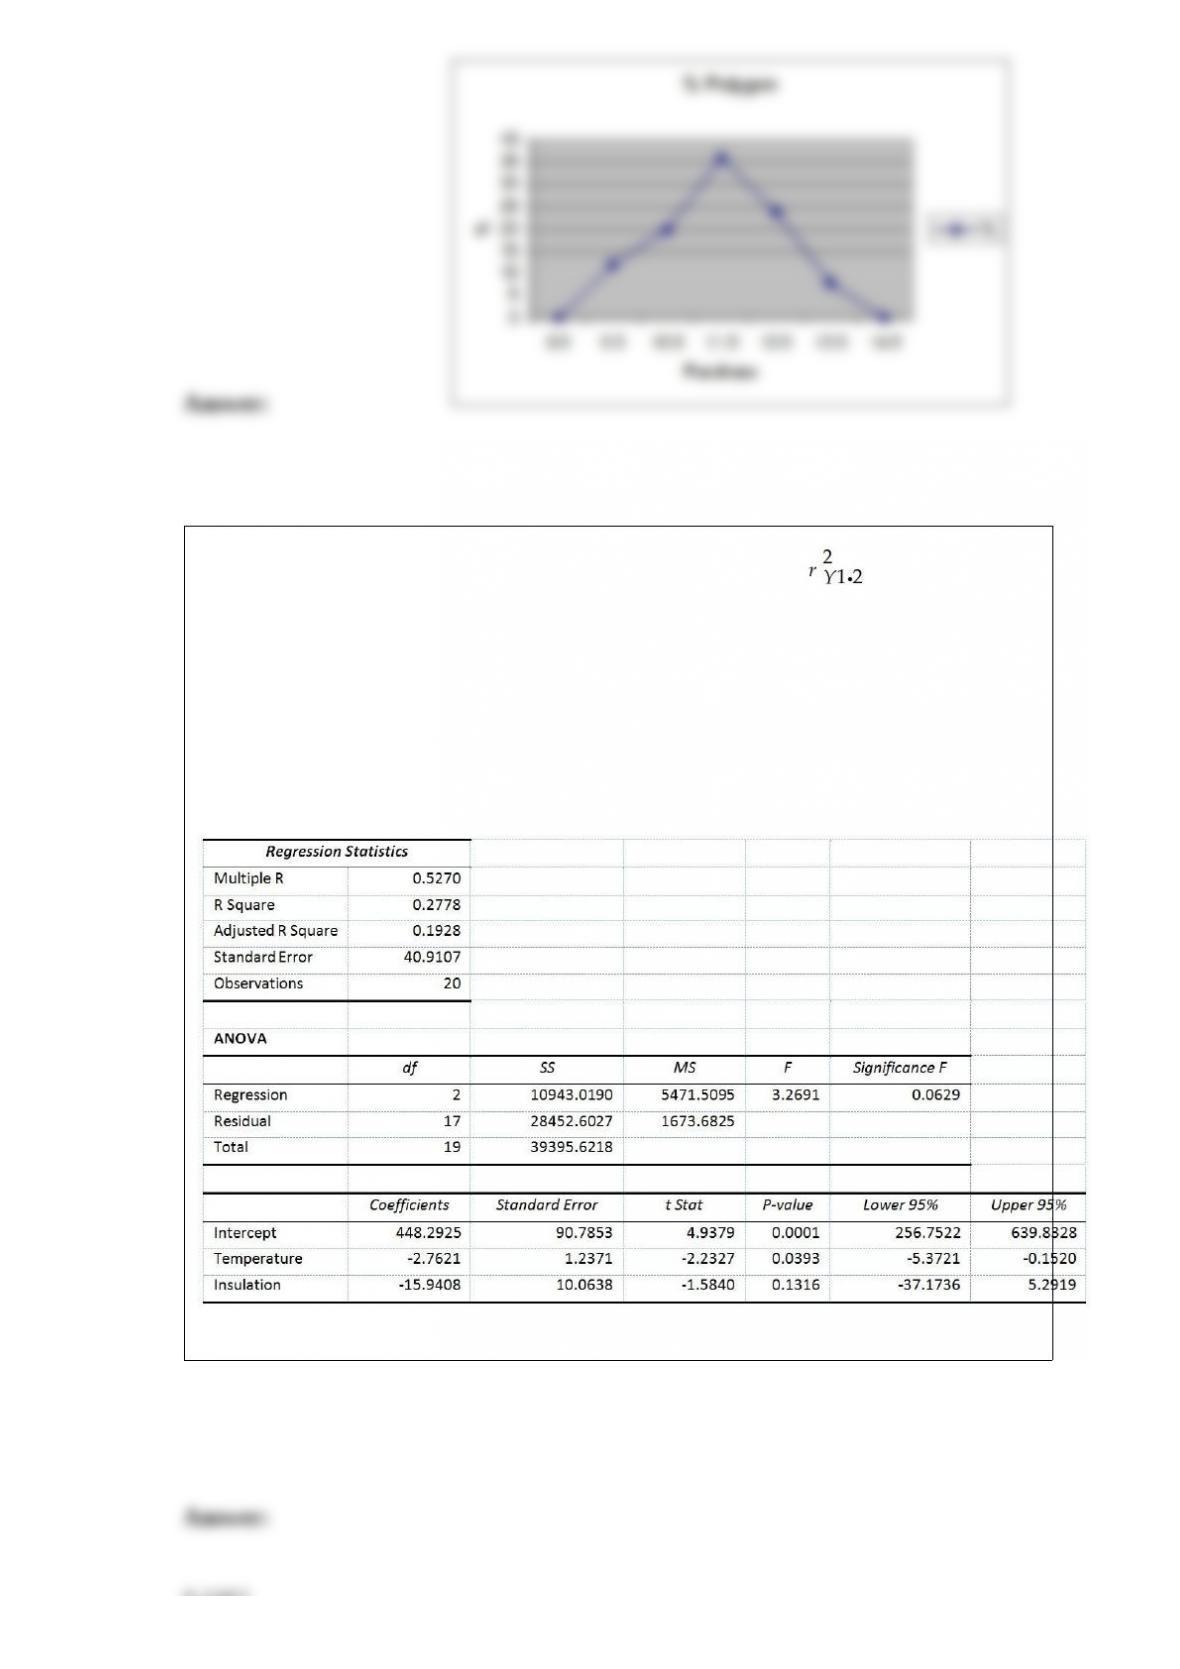
Referring to Table 14-6, the coefficient of partial determination is ________.
TABLE 14-6
One of the most common questions of prospective house buyers pertains to the cost of
heating in dollars (Y). To provide its customers with information on that matter, a large
real estate firm used the following 2 variables to predict heating costs: the daily
minimum outside temperature in degrees of Fahrenheit (X1) and the amount of
insulation in inches (X2). Given below is EXCEL output of the regression model.
Also SSR (X1∣ X2) = 8343.3572 and SSR (X2∣ X1) = 4199.2672
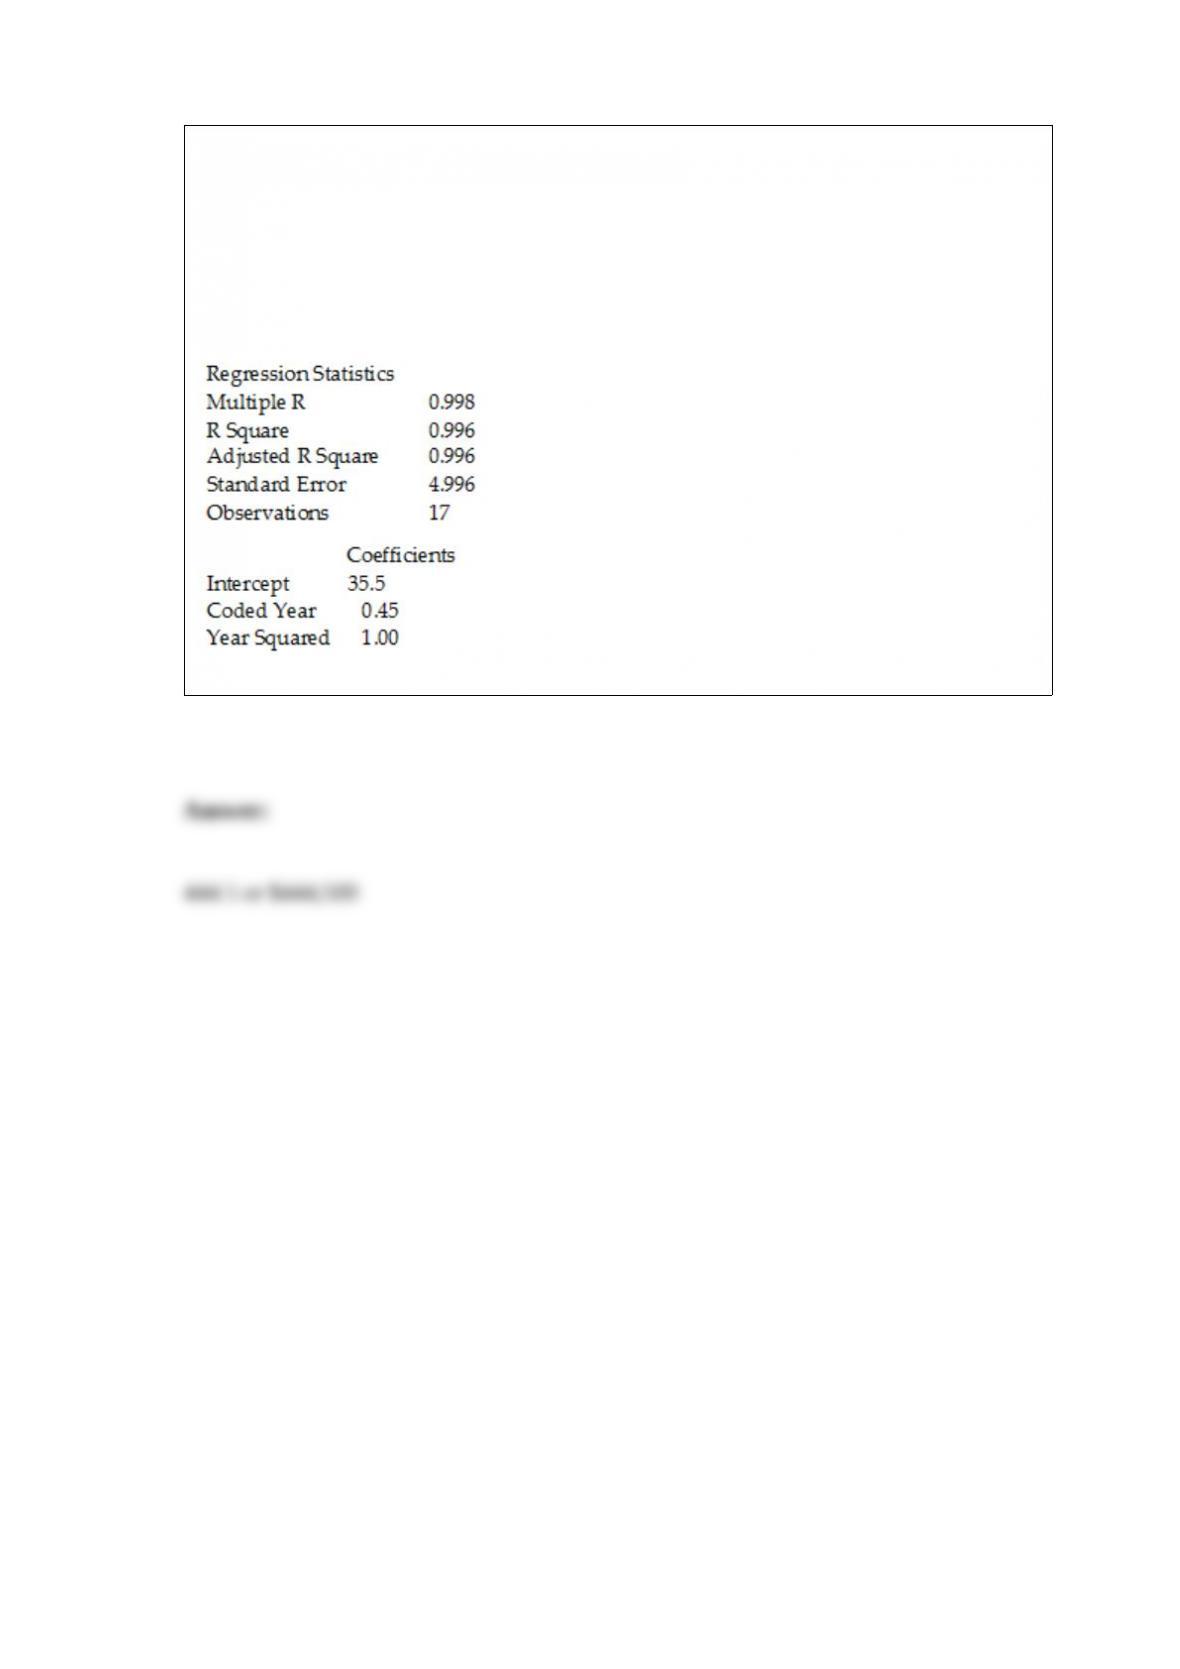
TABLE 16-8
The manager of a marketing consulting firm has been examining his company's yearly
profits. He believes that these profits have been showing a quadratic trend since 1994.
He uses Microsoft Excel to obtain the partial output below. The dependent variable is
profit (in thousands of dollars), while the independent variables are coded years and
squared of coded years, where 1994 is coded as 0, 1995 is coded as 1, etc.
SUMMARY OUTPUT
Referring to Table 16-8, the forecast for profits in 2014 is ________.


