TABLE 7-5
According to an article, 19% of the entire population in a developing country has
high-speed access to the Internet. Random sample sizes of 200 are selected from the
country’s population.
Referring to Table 7-5, among all the random sample sizes of 200, ________% will
have more than 30% who have high-speed access to the Internet.
TABLE 5-9
A major hotel chain keeps a record of the number of mishandled bags per 1,000
customers. In a recent year, the hotel chain had 4.06 mishandled bags per 1,000
customers. Assume that the number of mishandled bags has a Poisson distribution.
Referring to Table 5-9, what is the probability that in the next 1,000 customers, the
hotel chain will have fewer than six mishandled bags?
TABLE 8-8
The president of a university would like to estimate the proportion of the student
population that owns a personal computer. In a sample of 500 students, 417 own a
personal computer.
Referring to Table 8-8, the sampling error of a 99% confidence interval for the
proportion of the student population who own a personal computer is ________.
A ________ is a summary table in which numerical data are tallied into class intervals
or categories.
The amount of time between successive TV watching by first graders follows an
exponential distribution with a mean of 10 hours. The probability that a given first
grader spends less than 20 hours between successive TV watching is ________.
In multiple regression, the ________ procedure permits variables to enter and leave the
model at different stages of its development.
TABLE 17-9
What are the factors that determine the acceleration time (in sec.) from 0 to 60 miles per
hour of a car? Data on the following variables for 171 different vehicle models were
collected:
Accel Time: Acceleration time in sec.
Cargo Vol: Cargo volume in cu. ft.
HP: Horsepower
MPG: Miles per gallon
SUV: 1 if the vehicle model is an SUV with Coupe as the base when SUV and Sedan
are both 0
Sedan: 1 if the vehicle model is a sedan with Coupe as the base when SUV and Sedan
are both 0
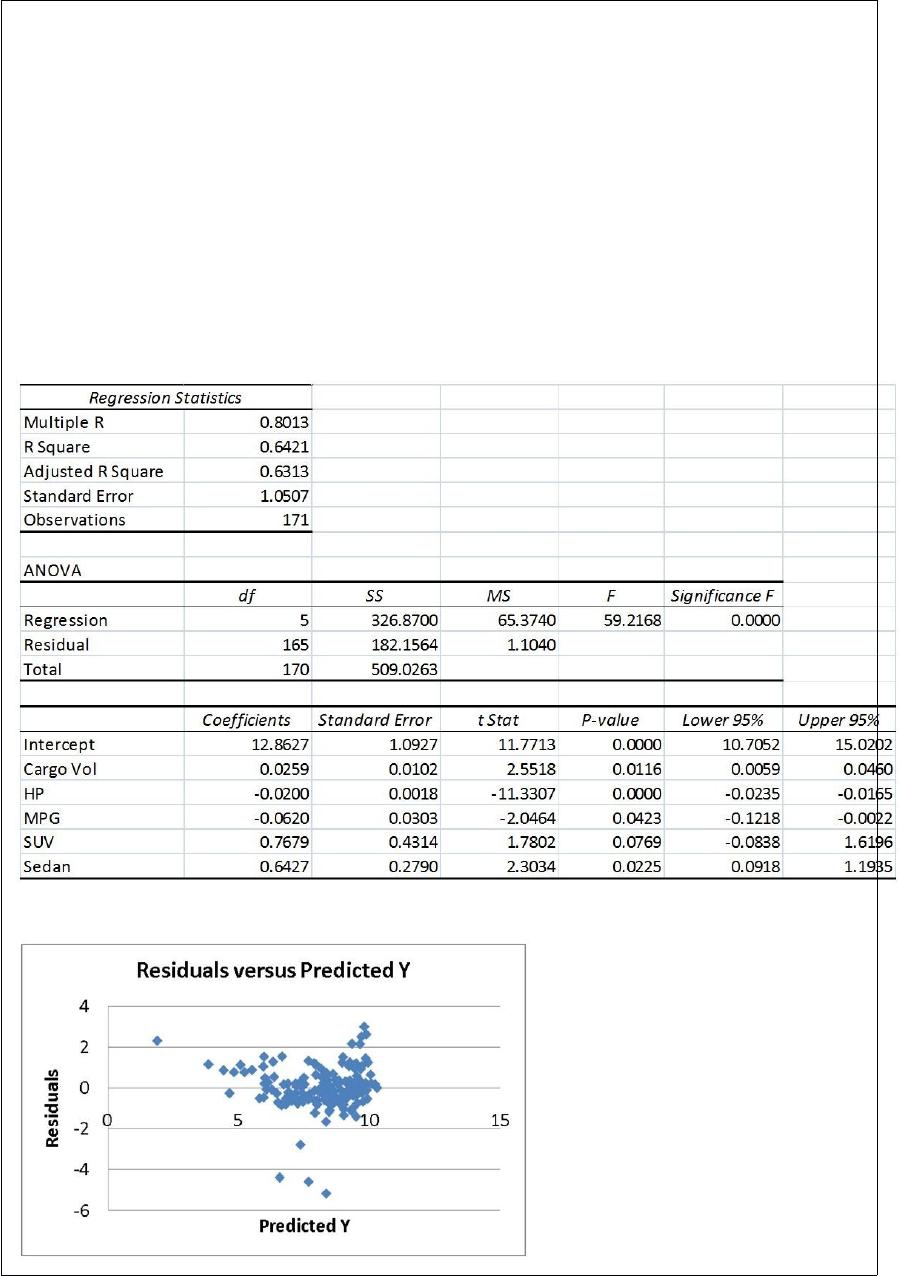
The regression results using acceleration time as the dependent variable and the
remaining variables as the independent variables are presented below.
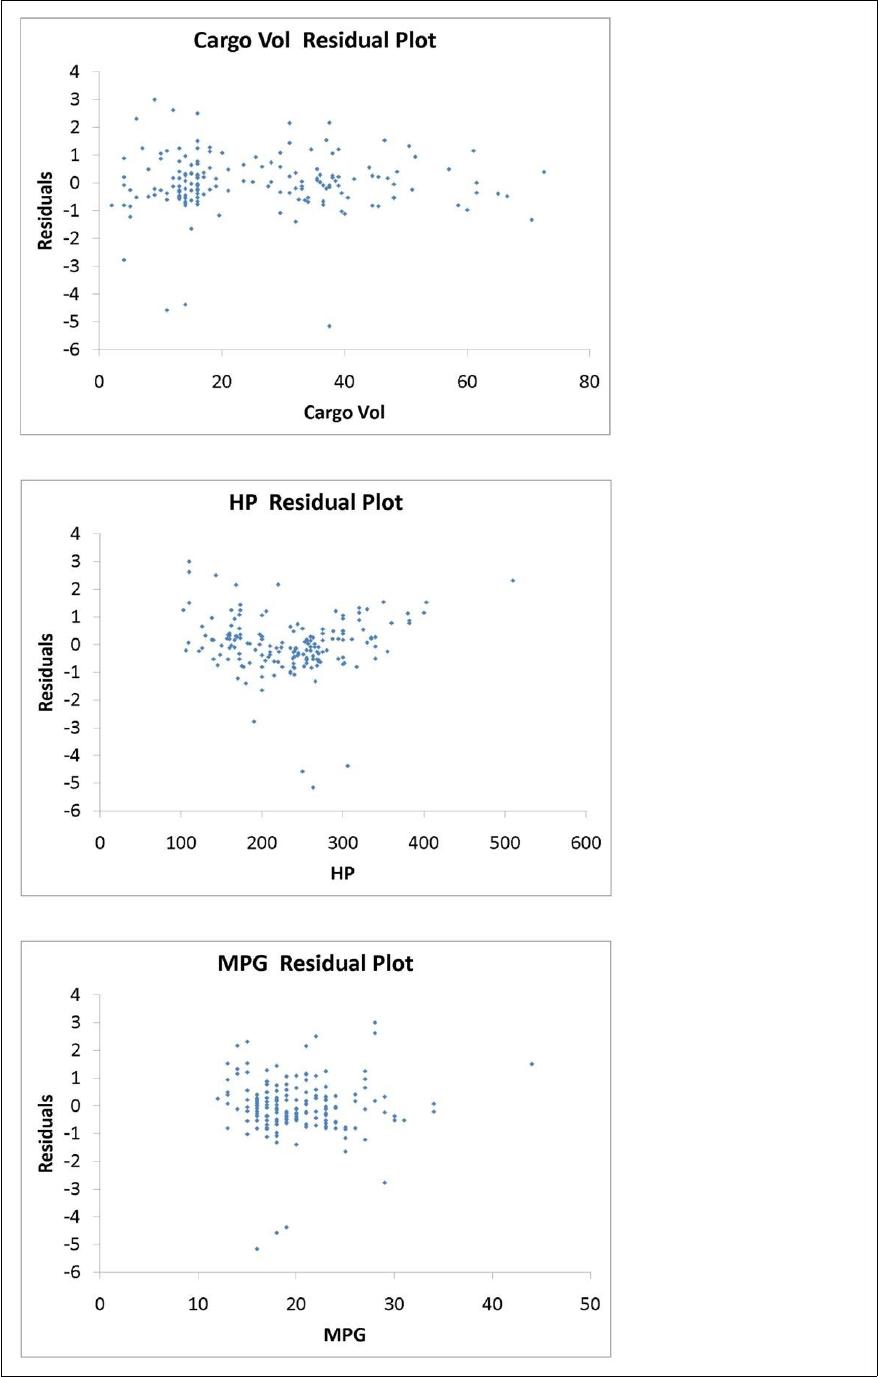
The various residual plots are as shown below.
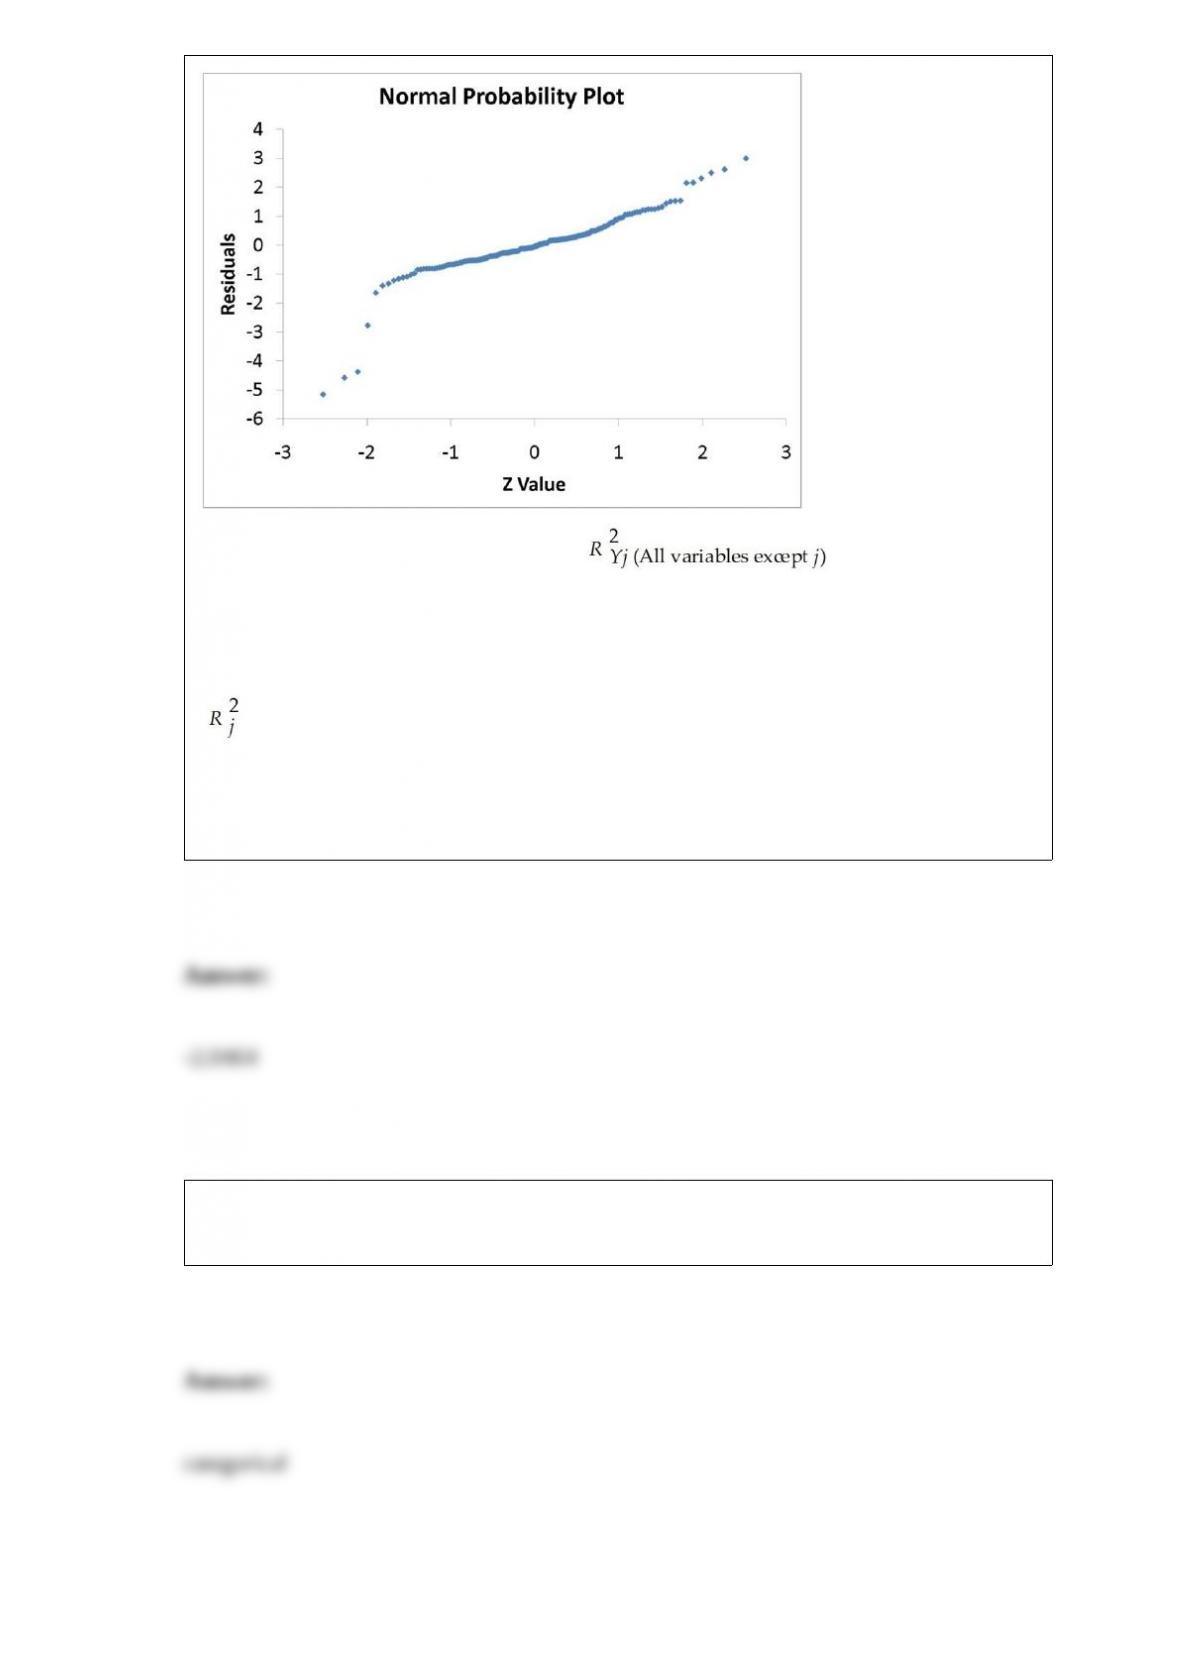
The coefficient of partial determination ( ) of each of the 5
predictors are, respectively, 0.0380, 0.4376, 0.0248, 0.0188, and 0.0312.
The coefficient of multiple determination for the regression model using each of the 5
variables Xj as the dependent variable and all other X variables as independent variables
( ) are, respectively, 0.7461, 0.5676, 0.6764, 0.8582, 0.6632.
Referring to Table 17-9, what is the value of the test statistic to determine whether MPG
makes a significant contribution to the regression model in the presence of the other
independent variables at a 5% level of significance?
The Dean of Students conducted a survey on campus. Major area of study is an
example of a ________ variable.
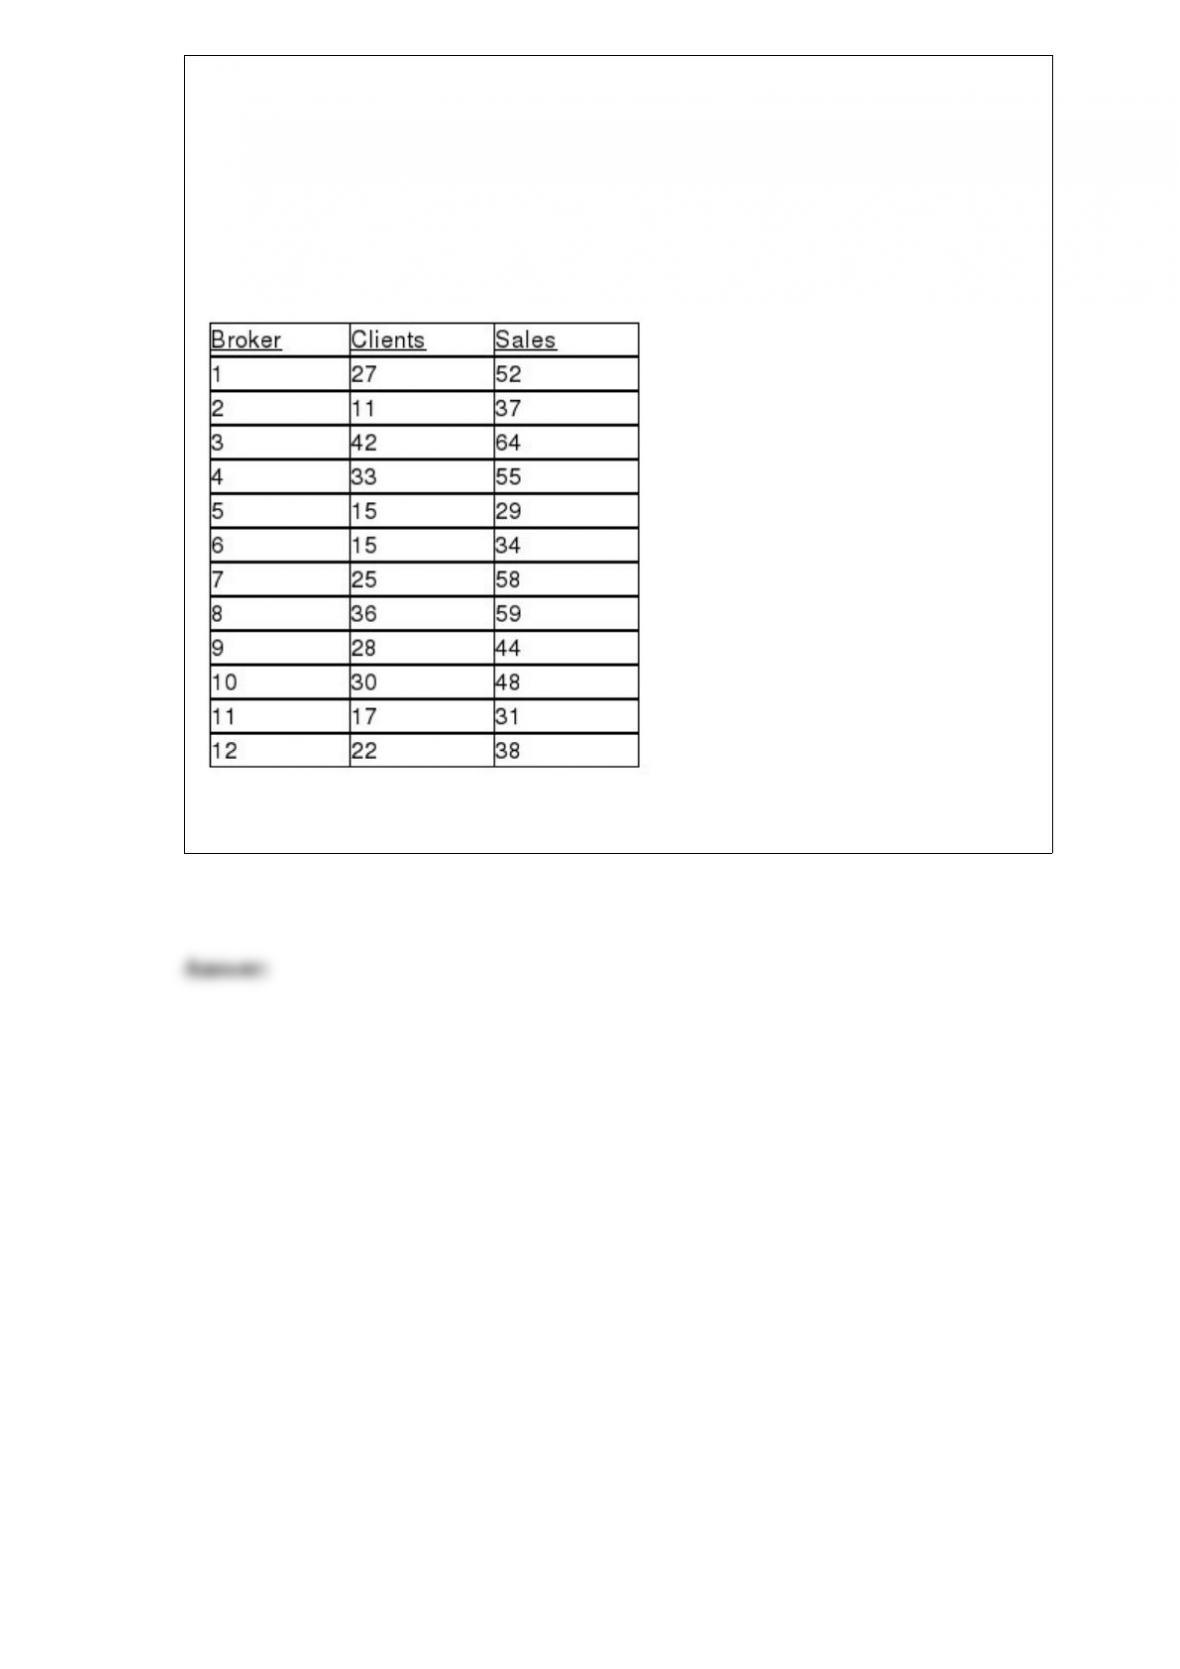
TABLE 13-4
The managers of a brokerage firm are interested in finding out if the number of new
clients a broker brings into the firm affects the sales generated by the broker. They
sample 12 brokers and determine the number of new clients they have enrolled in the
last year and their sales amounts in thousands of dollars. These data are presented in the
table that follows.
Referring to Table 13-4, set up a scatter plot.
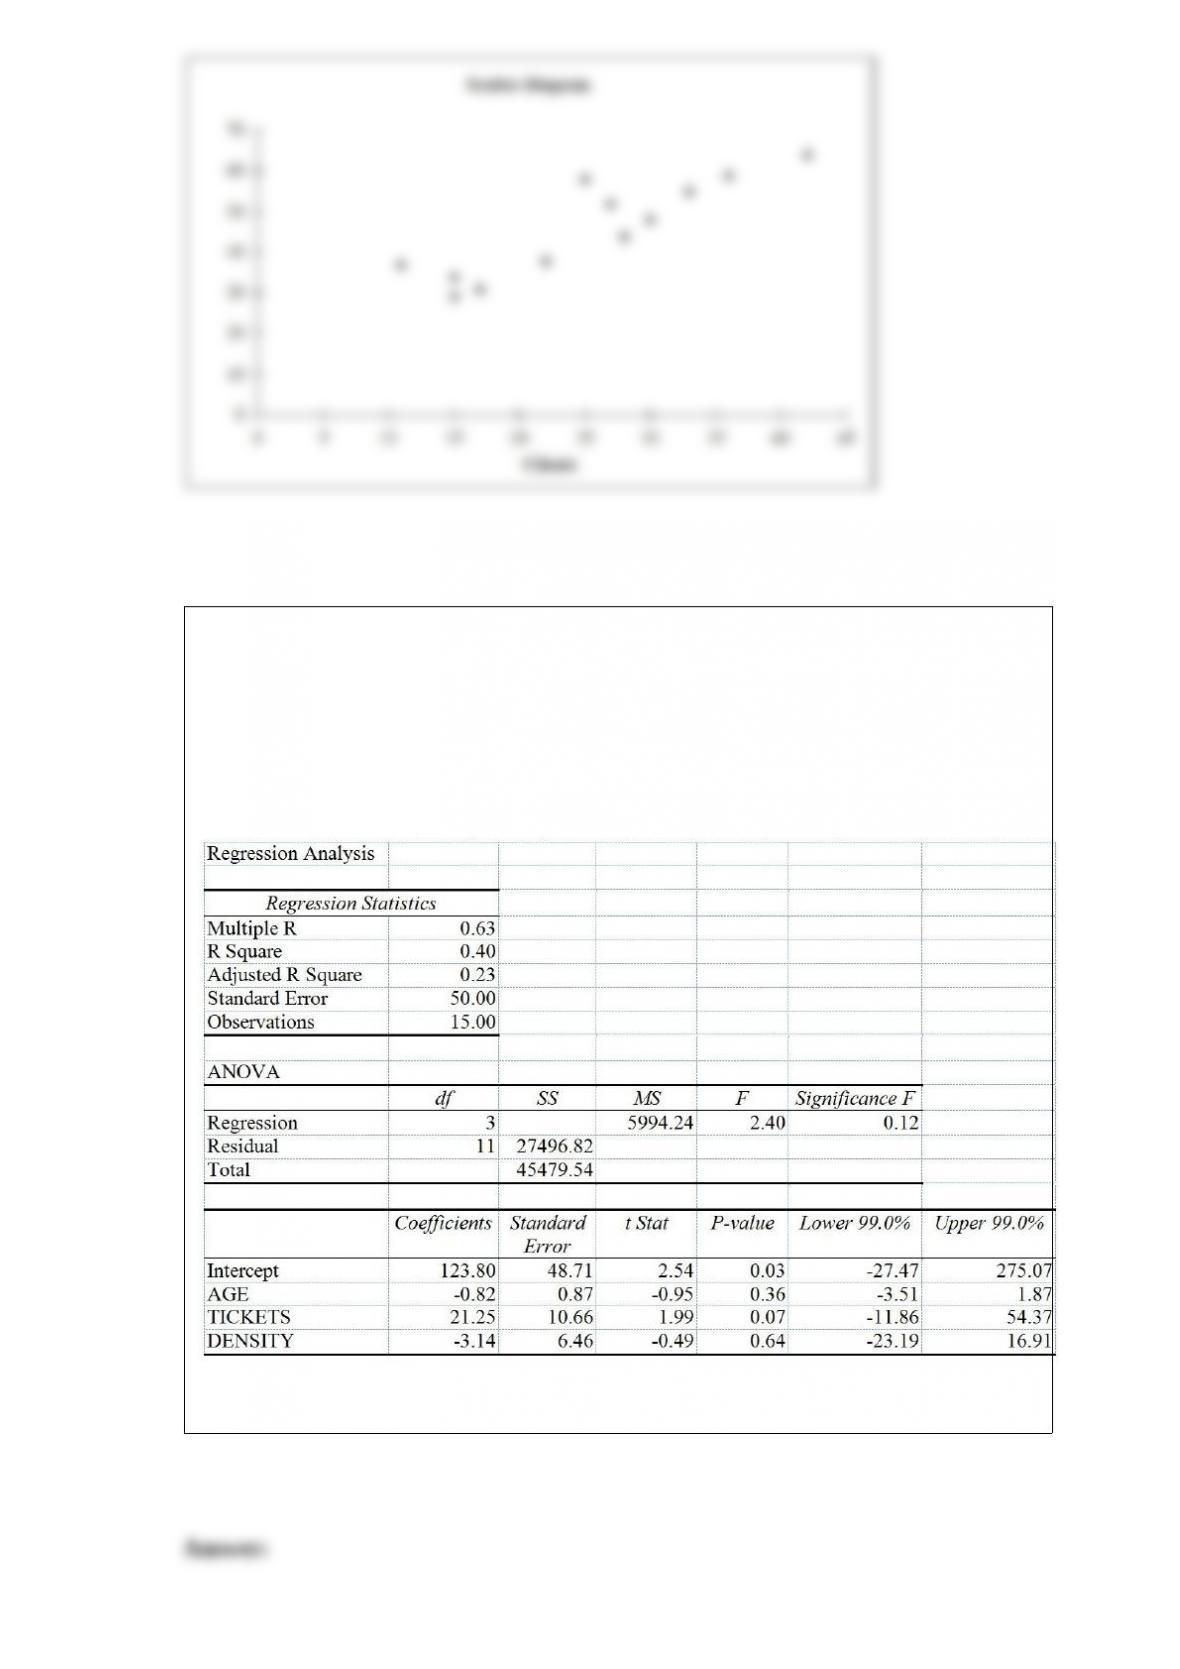
TABLE 17-5
You worked as an intern at We Always Win Car Insurance Company last summer. You
notice that individual car insurance premiums depend very much on the age of the
individual, the number of traffic tickets received by the individual, and the population
density of the city in which the individual lives. You performed a regression analysis in
EXCEL and obtained the following information:
Referring to Table 17-5, the regression sum of squares that is missing in the ANOVA
table should be ________.