
Referring to Table 14-18, what should be the decision (‘reject’ or ‘do
not reject’) on the null hypothesis when testing whether Toe90
makes a signi”cant contribution to the model in the presence of SAT
at a 0.05 level of signi”cance?
TABLE 14-18
A logistic regression model was estimated in order to predict the
probability that a randomly chosen university or college would be a
private university using information on mean total Scholastic Aptitude
Test score (SAT) at the university or college and whether the TOEFL
criterion is at least 90 (Toe90 = 1 if yes, 0 otherwise). The
dependent variable, Y, is school type (Type = 1 if private and 0
otherwise).
The PHStat output is given below:
The rate of return for the S&P 500 over a four-year period is -0.029, -0.061, -0.493, and
-0.286. The geometric mean rate of return per year is ________.
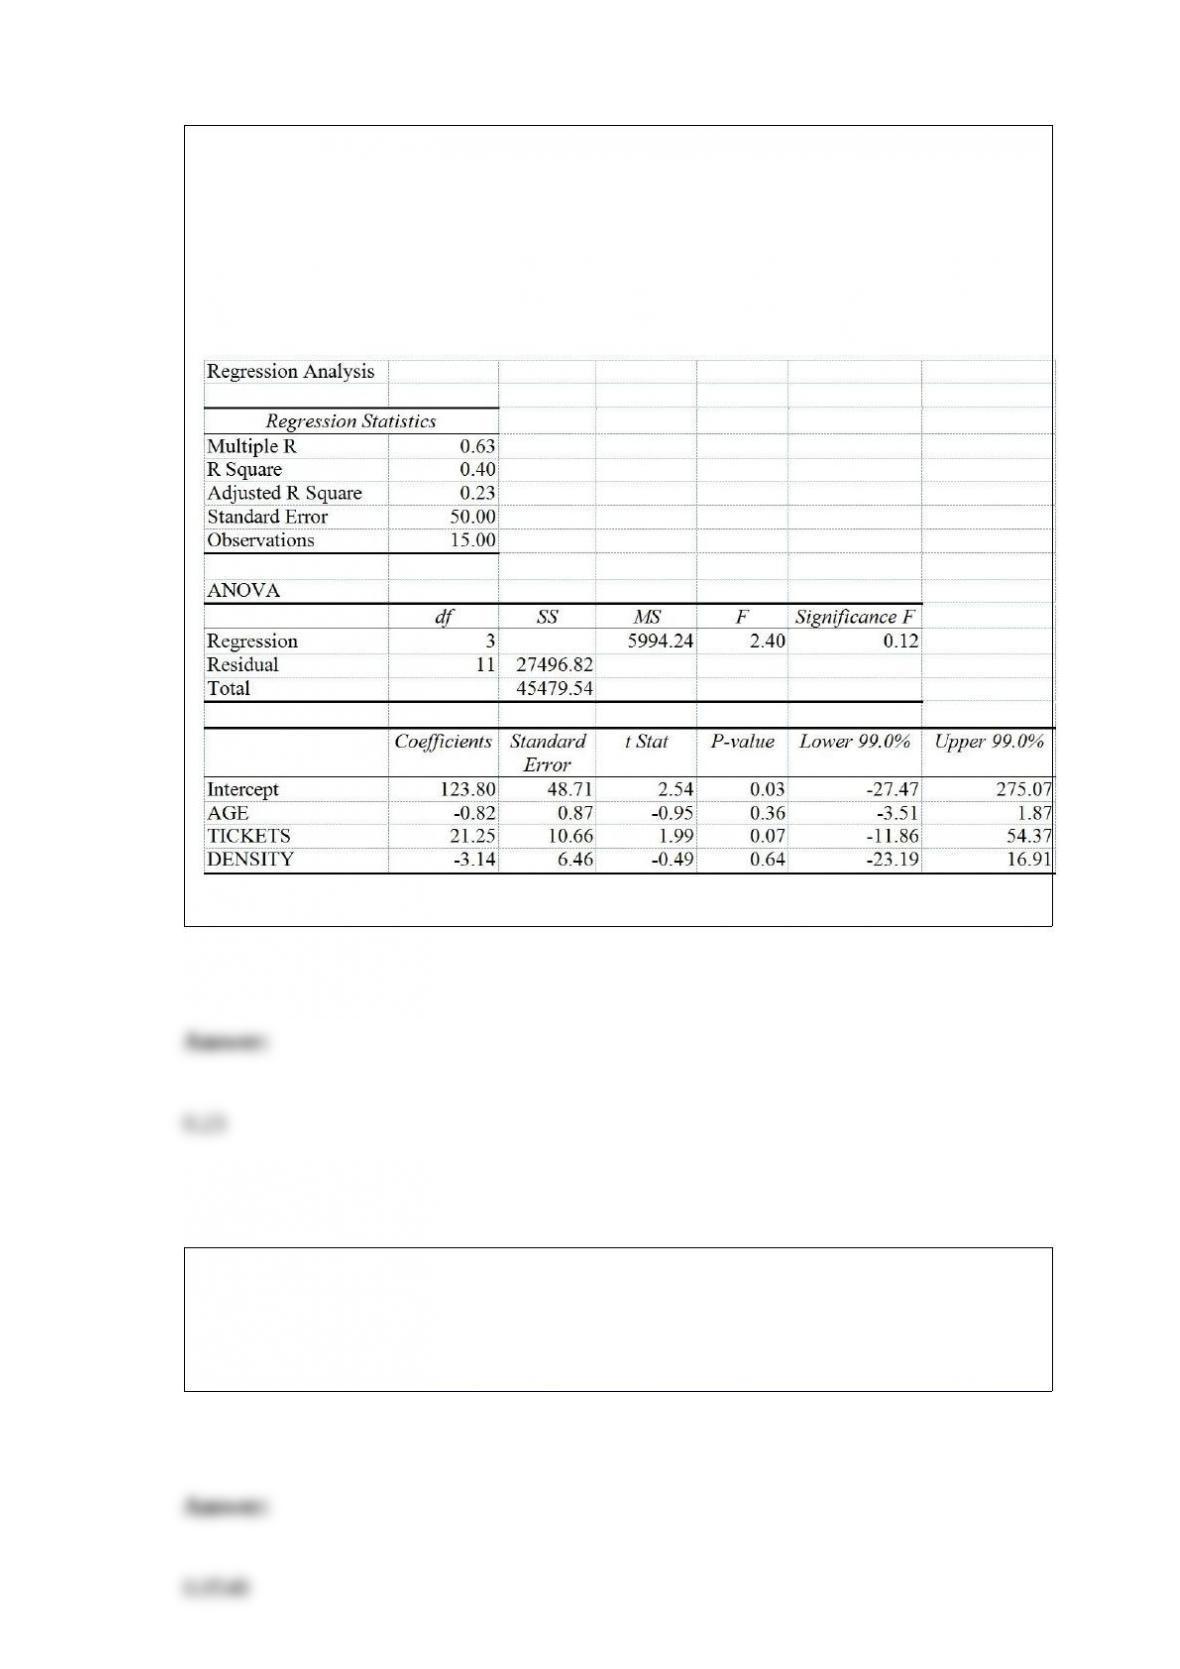
TABLE 17-5
You worked as an intern at We Always Win Car Insurance Company last summer. You
notice that individual car insurance premiums depend very much on the age of the
individual, the number of traffic tickets received by the individual, and the population
density of the city in which the individual lives. You performed a regression analysis in
EXCEL and obtained the following information:
Referring to Table 17-5, the adjusted r2 is ________.
A manufacturer of power tools claims that the mean amount of time required to
assemble their top-of-the-line table saw is 80 minutes with a standard deviation of 40
minutes. Suppose a random sample of 64 purchasers of this table saw is taken. The
probability that the sample mean will be greater than 88 minutes is ________.
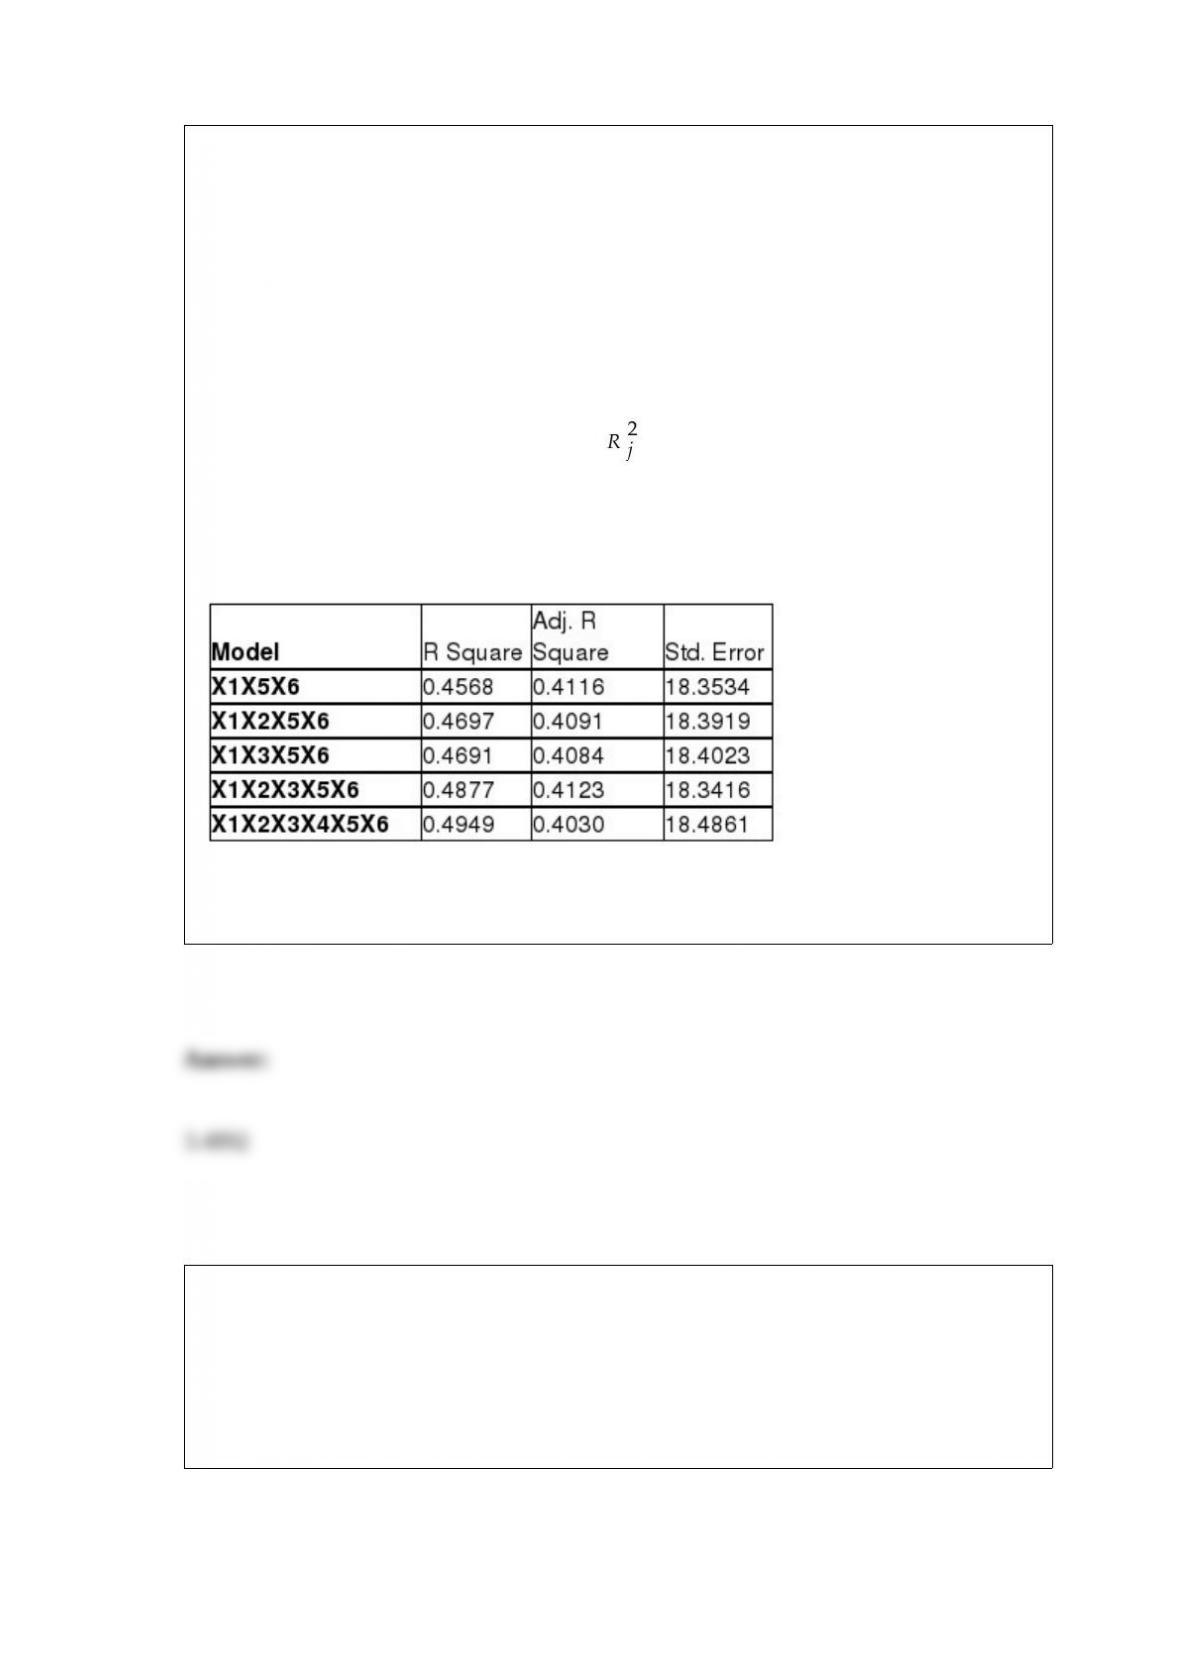
TABLE 15-6
Given below are results from the regression analysis on 40 observations where the
dependent variable is the number of weeks a worker is unemployed due to a layoff (Y)
and the independent variables are the age of the worker (X1), the number of years of
education received (X2), the number of years at the previous job (X3), a dummy variable
for marital status (X4: 1 = married, 0 = otherwise), a dummy variable for head of
household (X5: 1 = yes, 0 = no) and a dummy variable for management position (X6: 1
= yes, 0 = no).
The coefficient of multiple determination ( ) for the regression model using each of
the 6 variables Xj as the dependent variable and all other X variables as independent
variables are, respectively, 0.2628, 0.1240, 0.2404, 0.3510, 0.3342 and 0.0993.
The partial results from best-subset regression are given below:
Referring to Table 15-6, what is the value of the Mallow’s Cp statistic for the model that
includes X1, X5 and X6?
TABLE 5-7
There are two houses with almost identical characteristics available for investment in
two different neighborhoods with drastically different demographic composition. The
anticipated gain in value when the houses are sold in 10 years has the following
probability distribution:
Referring to Table 5-7, if your investment preference is to minimize the amount of risk
that you have to take and do not care at all about the expected return, will you choose a
portfolio that will consist of 10%, 30%, 50%, 70%, or 90% of your money on the house
in neighborhood A and the remaining on the house in neighborhood B?
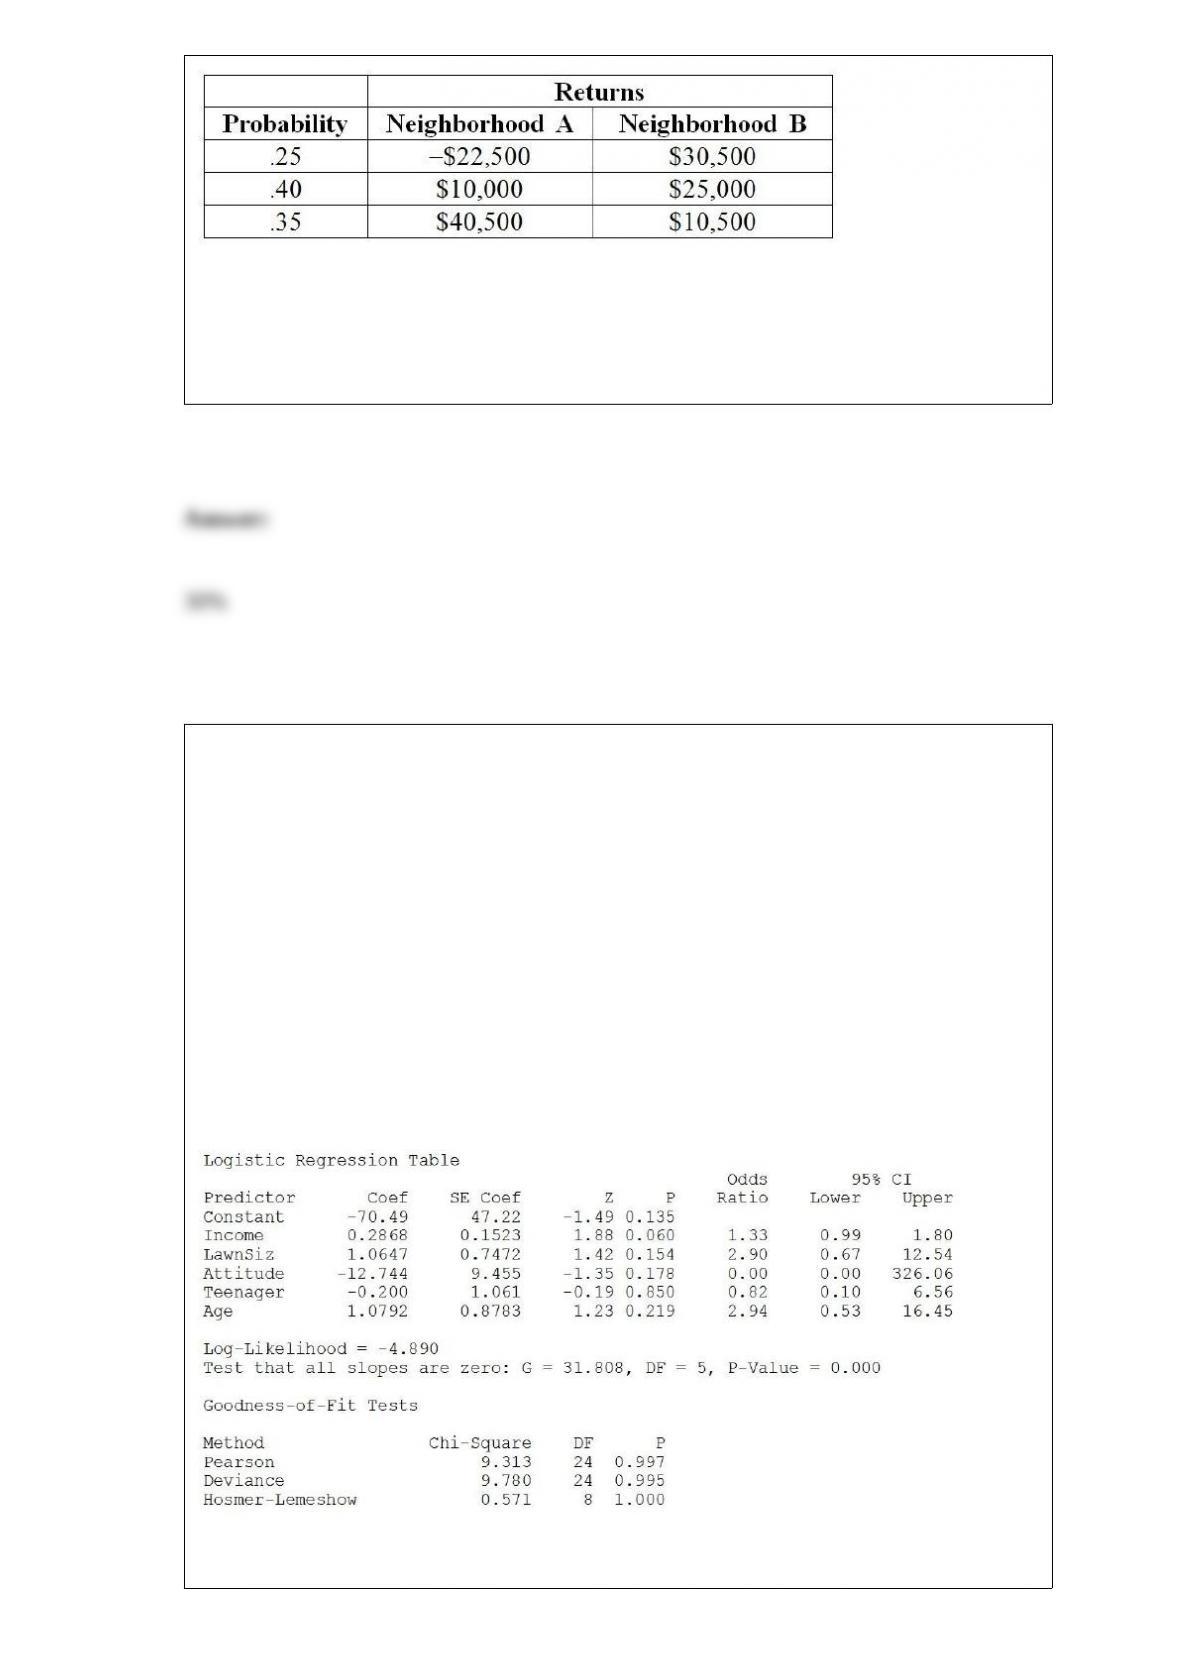
TABLE 17-12
The marketing manager for a nationally franchised lawn service company would like to
study the characteristics that differentiate home owners who do and do not have a lawn
service. A random sample of 30 home owners located in a suburban area near a large
city was selected; 15 did not have a lawn service (code 0) and 15 had a lawn service
(code 1). Additional information available concerning these 30 home owners includes
family income (Income, in thousands of dollars), lawn size (Lawn Size, in thousands of
square feet), attitude toward outdoor recreational activities (Attitude 0 = unfavorable, 1
= favorable), number of teenagers in the household (Teenager), and age of the head of
the household (Age).
The Minitab output is given below:
Referring to Table 17-12, what are the degrees of freedom for the chi-square

distribution when testing whether the model is a good-fitting model?