True or False: Apple Computer, Inc. collected information on the age of their
customers. Suppose the youngest customer was 12 and the oldest was 72. To study the
distribution of the age among its customers, it can use a percentage polygon.
True or False: A side-by-side bar chart is two histograms plotted side-by-side.
True or False: For a given level of significance, if the sample size is increased but the
summary statistics remain the same, the power of the test will increase.
TABLE 9-8
One of the biggest issues facing e-retailers is the ability to turn browsers into buyers.
This is measured by the conversion rate, the percentage of browsers who buy something
in their visit to a site. The conversion rate for a company’s website was 10.1%. The
website at the company was redesigned in an attempt to increase its conversion rates. A
sample of 200 browsers at the redesigned site was selected. Suppose that 24 browsers
made a purchase. The company officials would like to know if there is evidence of an
increase in conversion rate at the 5% level of significance.
True or False: Referring to Table 9-8, the value of the probability of committing a Type
II error is 0.95.
True or False: The parameter estimates are biased when collinearity is present in a
multiple regression equation.
True or False: Unweighted aggregate price indices account for differences in the
magnitude of prices per unit and differences in the consumption levels of the items in
the market basket.
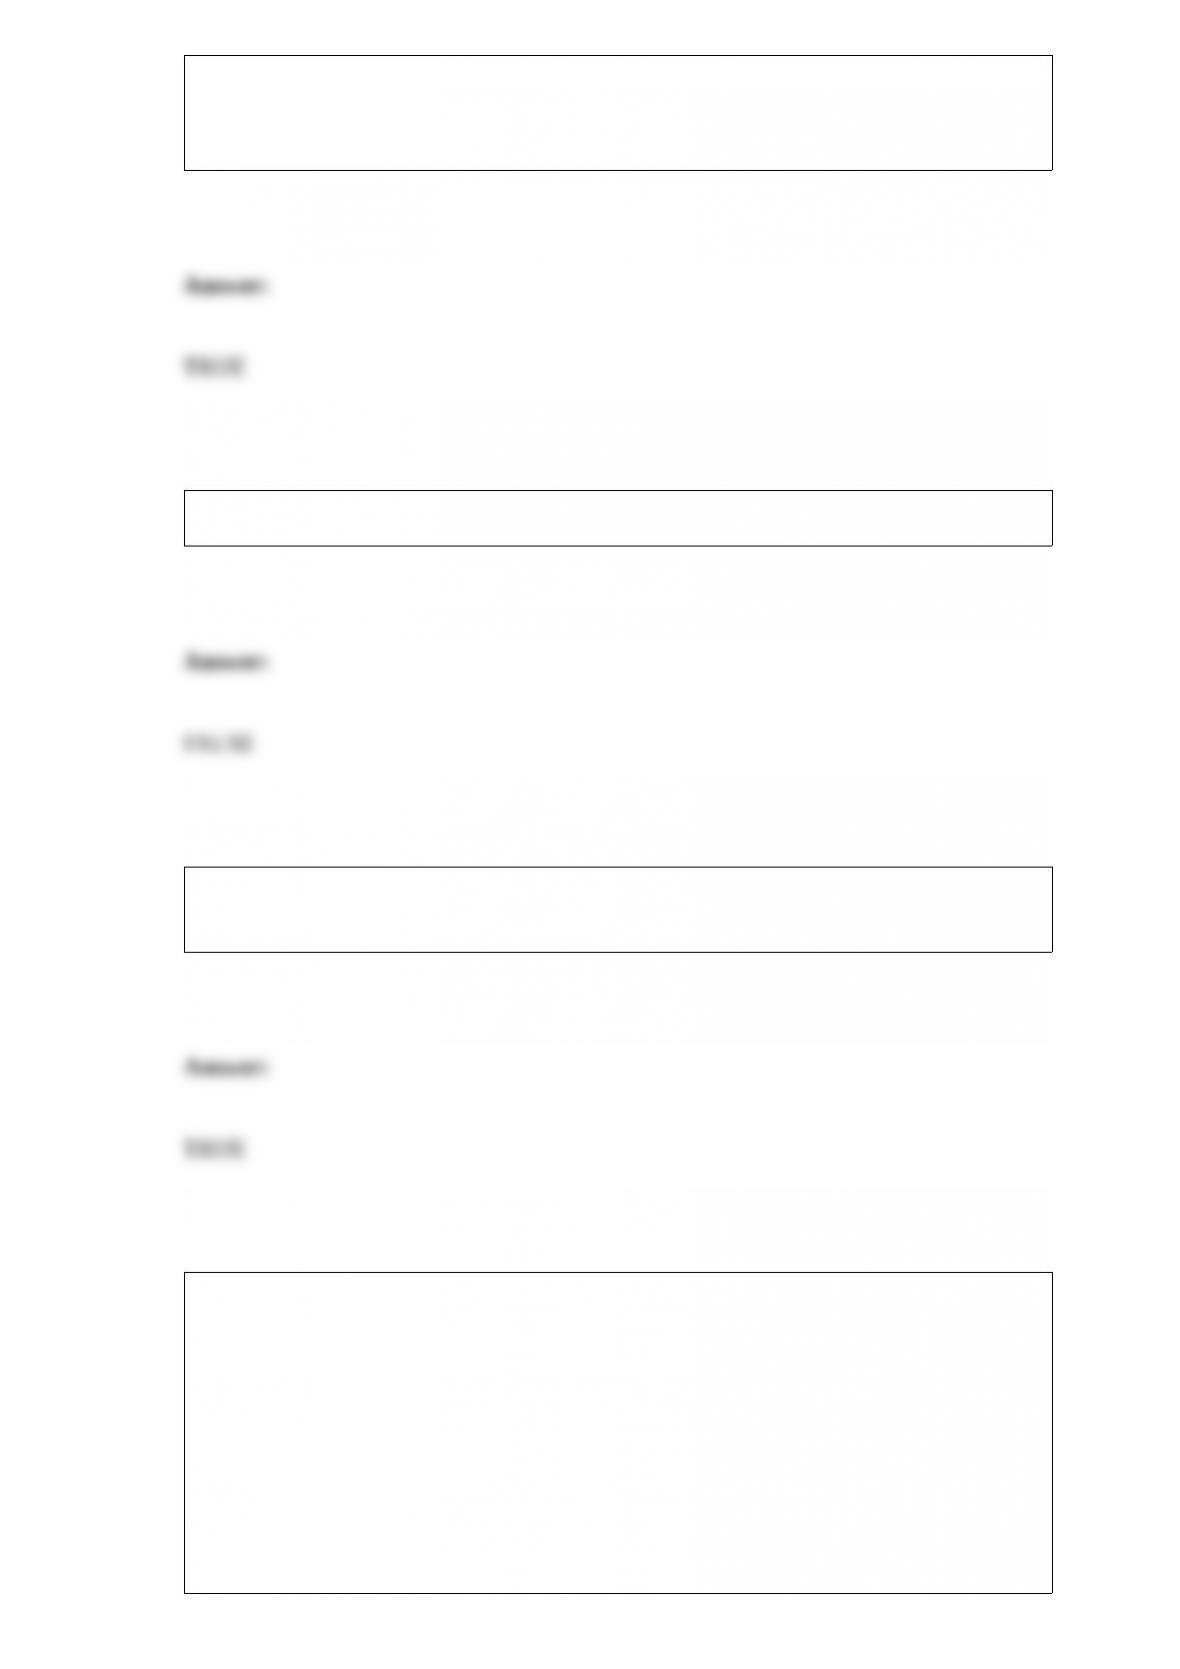
TABLE 12-11
The director of admissions at a state college is interested in seeing if admissions status
(admitted, waiting list, denied admission) at his college is independent of the type of
community in which an applicant resides. He takes a sample of recent admissions
decisions and forms the following table:
He will use this table to do a chi-square test of independence with a level of
significance of 0.01.
True or False: Referring to Table 12-11, the alternative hypothesis claims that “there is
some connection between admission status at the college and the type of community in
which an applicant resides.”
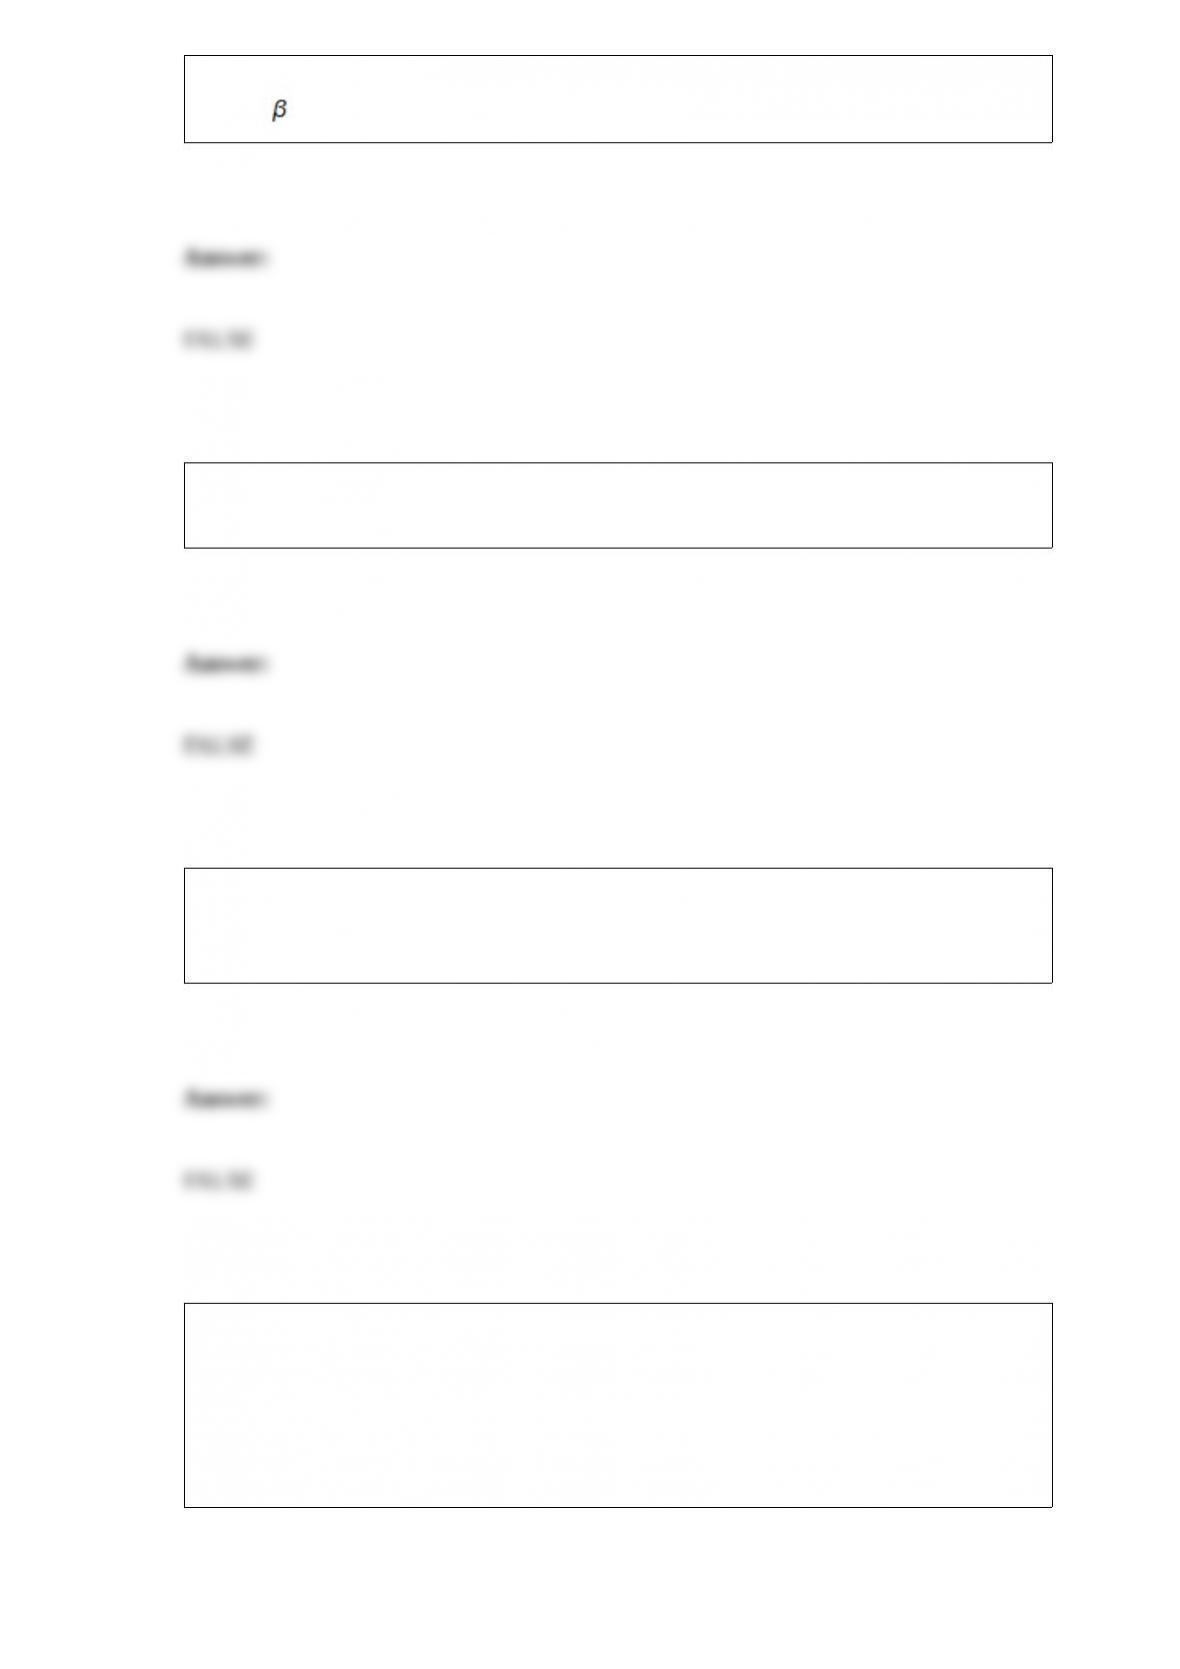
TABLE 12-7
Data on the percentage of 200 hotels in each of the three large cities across the world on
whether minibar charges are correctly posted at checkout are given below.
At the 0.05 level of significance, you want to know if there is evidence of a difference
in the proportion of hotels that correctly post minibar charges among the three cities.
True or False: Referring to Table 12-7, there is sufficient evidence to conclude that the
proportions between Hong Kong and Paris are different at a 0.05 level of significance.

True or False: TABLE 17-10
Given below are results from the regression analysis where the dependent variable is
the number of weeks a worker is unemployed due to a layoff (Unemploy) and the
independent variables are the age of the worker (Age), the number of years of education
received (Edu), the number of years at the previous job (Job Yr), a dummy variable for
marital status (Married: 1 = married, 0 = otherwise), a dummy variable for head of
household (Head: 1 = yes, 0 = no) and a dummy variable for management position
(Manager: 1 = yes, 0 = no). We shall call this Model 1. The coefficient of partial
determination ( ) of each of the 6 predictors are, respectively,
0.2807, 0.0386, 0.0317, 0.0141, 0.0958, and 0.1201.
Model 2 is the regression analysis where the dependent variable is Unemploy and the
independent variables are Age and Manager. The results of the regression analysis are
given below:
Referring to Table 17-10, Model 1, there is sufficient evidence that the number of
weeks a worker is unemployed due to a layoff depends on all of the explanatory
variables at a 10% level of significance.
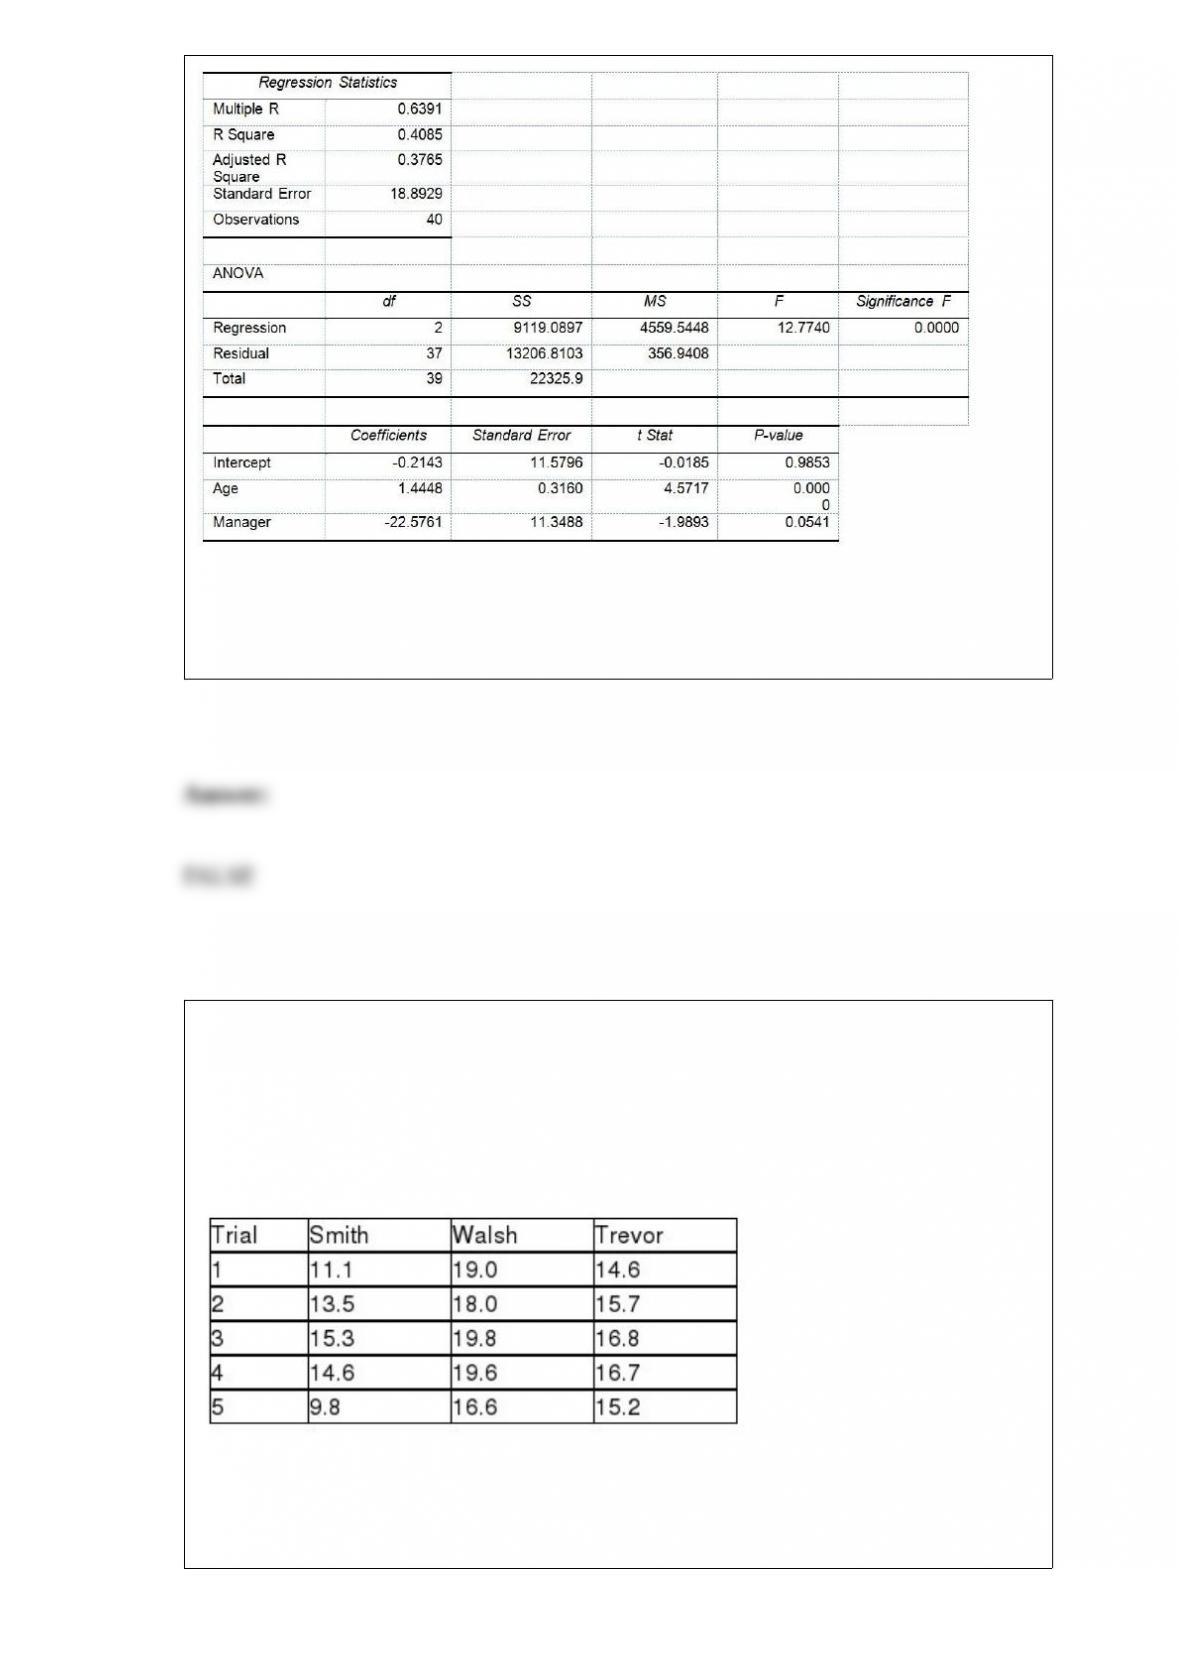
TABLE 11-4
An agronomist wants to compare the crop yield of 3 varieties of chickpea seeds. She
plants 15 fields, 5 with each variety. She then measures the crop yield in bushels per
acre. Treating this as a completely randomized design, the results are presented in the
table that follows.
True or False: Referring to Table 11-4, based on the Tukey-Kramer procedure with an
overall level of significance of 0.01, the agronomist would decide that there is a
significant difference between the crop yield of Smith and Trevor seeds.
True or False: As a general rule, one can use the normal distribution to approximate a
binomial distribution whenever n( – 1) is at least 5.
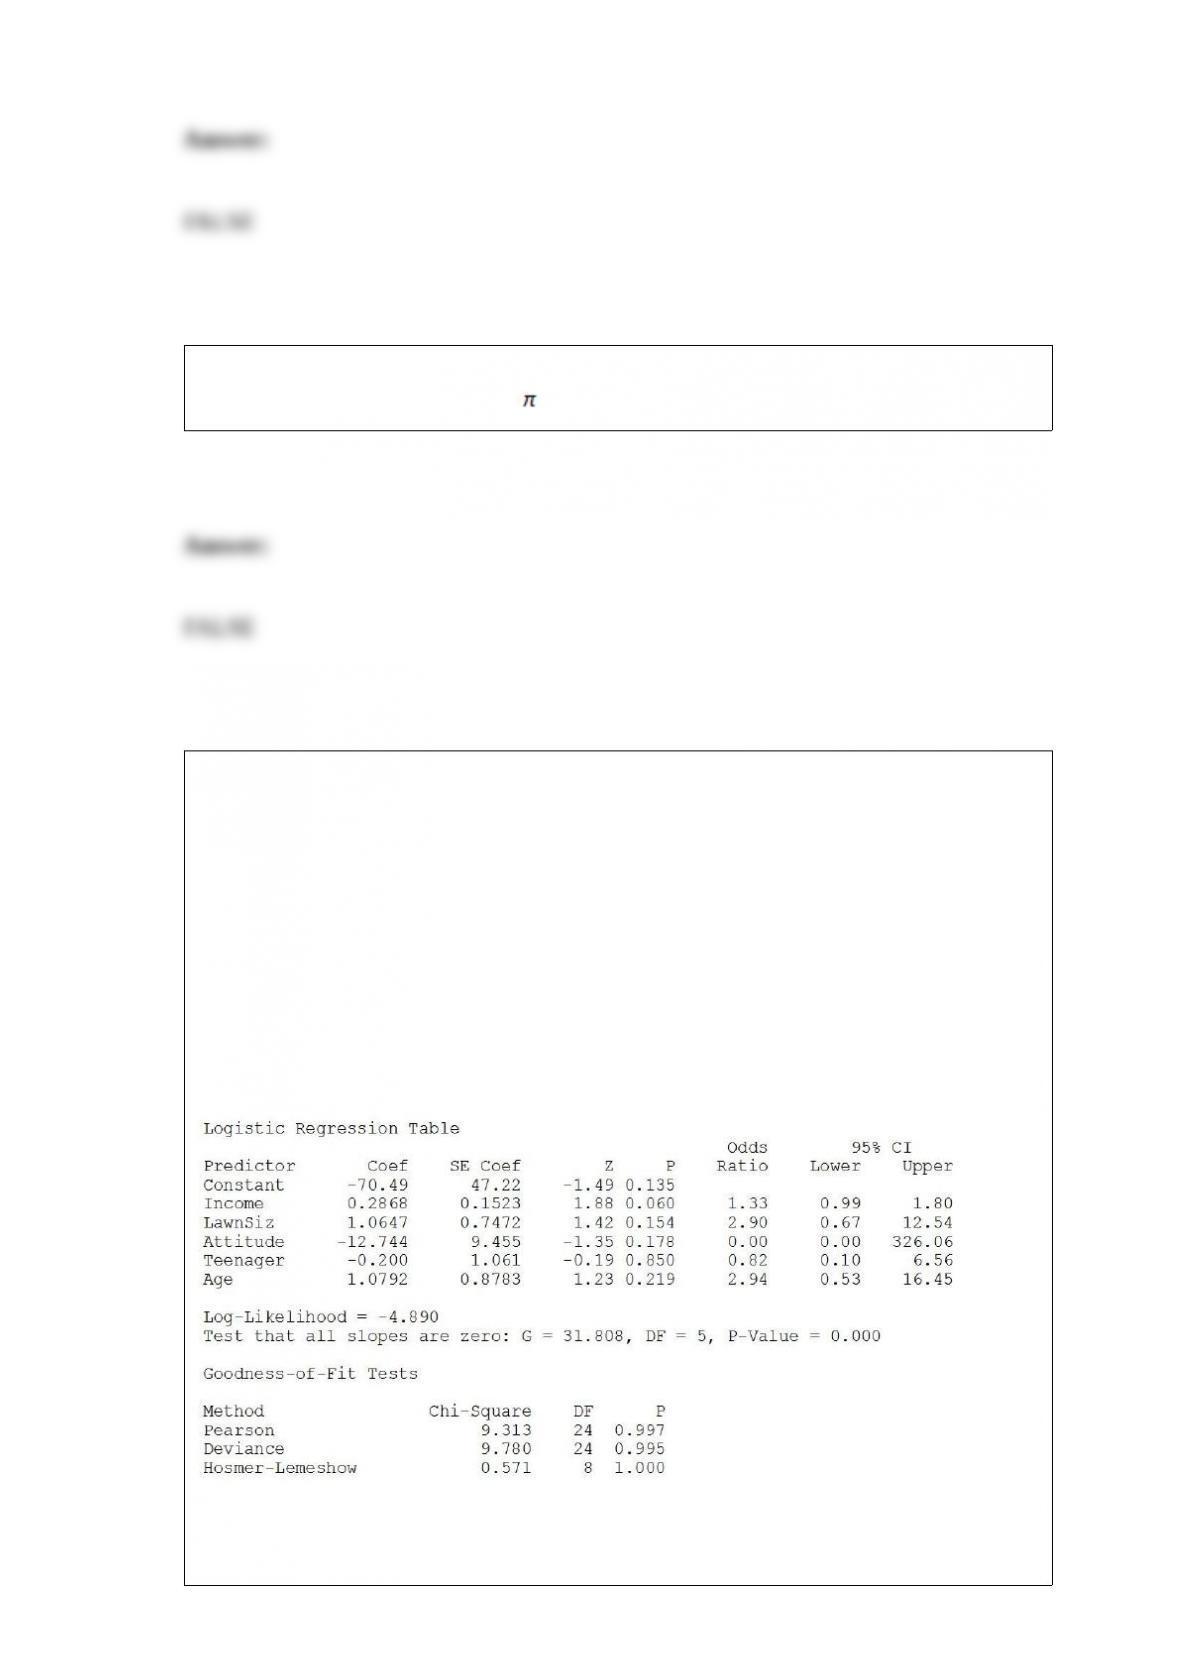
True or False: TABLE 17-12
The marketing manager for a nationally franchised lawn service company would like to
study the characteristics that differentiate home owners who do and do not have a lawn
service. A random sample of 30 home owners located in a suburban area near a large
city was selected; 15 did not have a lawn service (code 0) and 15 had a lawn service
(code 1). Additional information available concerning these 30 home owners includes
family income (Income, in thousands of dollars), lawn size (Lawn Size, in thousands of
square feet), attitude toward outdoor recreational activities (Attitude 0 = unfavorable, 1
= favorable), number of teenagers in the household (Teenager), and age of the head of
the household (Age).
The Minitab output is given below:
Referring to Table 17-12, there is not enough evidence to conclude that Age makes a
significant contribution to the model in the presence of the other independent variables
at a 0.05 level of significance.
TABLE 8-6
After an extensive advertising campaign, the manager of a company wants to estimate
the proportion of potential customers that recognize a new product. She samples 120
potential consumers and finds that 54 recognize this product. She uses this sample
information to obtain a 95% confidence interval that goes from 0.36 to 0.54.
True or False: Referring to Table 8-6, 95% of the people will recognize the product
between 36% and 54% of the time.
True or False: The Central Limit Theorem is considered powerful in statistics because it
works for any population distribution provided the sample size is sufficiently large and
the population mean and standard deviation are known.
True or False: Collinearity is present when there is a high degree of correlation between
the dependent variable and any of the independent variables.
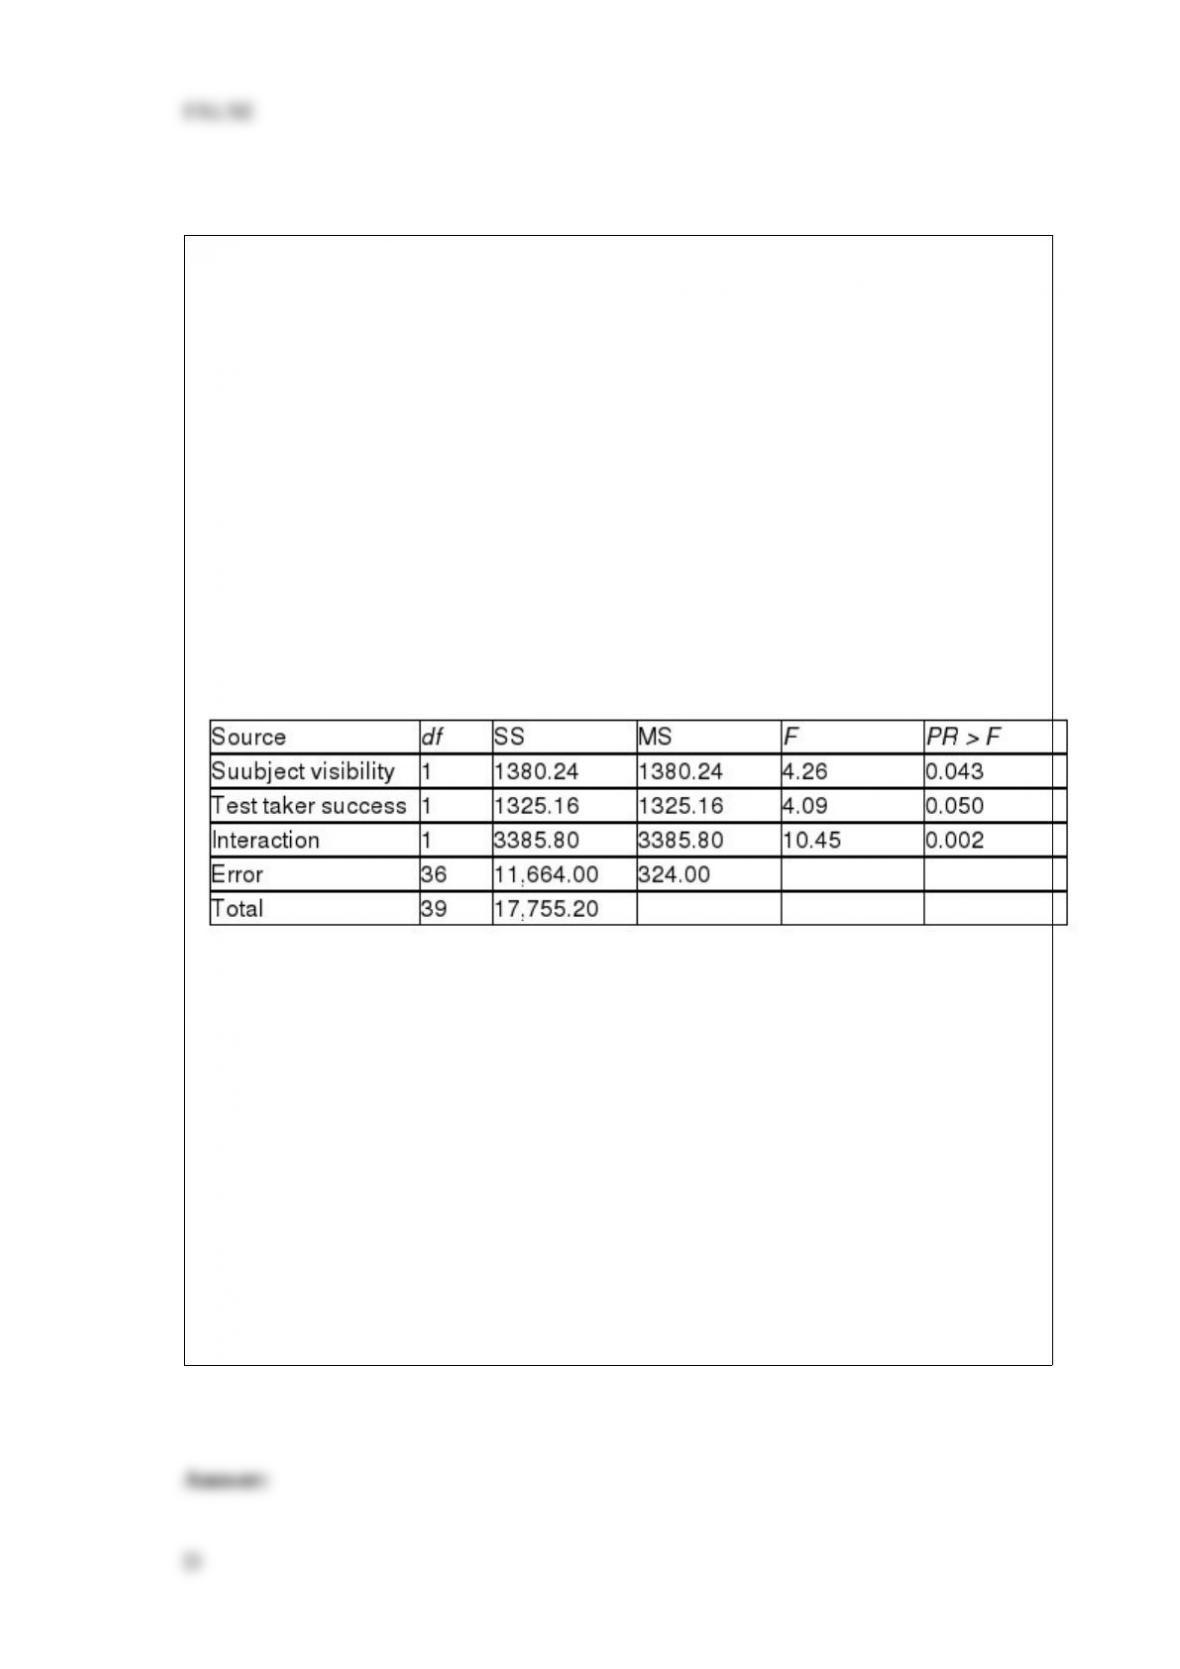
TABLE 11-6
Psychologists have found that people are generally reluctant to transmit bad news to
their peers. This phenomenon has been termed the “MUM effect.” To investigate the
cause of the MUM effect, 40 undergraduates at Duke University participated in an
experiment. Each subject was asked to administer an IQ test to another student and then
provide the test taker with his or her percentile score. Unknown to the subject, the test
taker was a bogus student who was working with the researchers. The experimenters
manipulated two factors: subject visibility and success of test taker, each at two
levels. Subject visibility was either visible or not visible to the test taker. Success of the
test taker was either top 20% or bottom 20%. Ten subjects were randomly assigned to
each of the 2 x 2 = 4 experimental conditions, then the time (in seconds) between the
end of the test and the delivery of the percentile score from the subject to the test taker
was measured. (This variable is called the latency to feedback.) The data were
subjected to appropriate analyses with the following results.
Referring to Table 11-6, in the context of this study, interpret the statement: “Subject
visibility and test taker success interact.”
A) The difference between the mean feedback time for visible and nonvisible subjects
depends on the success of the test taker.
B) The difference between the mean feedback time for test takers scoring in the top
20% and bottom 20% depends on the visibility of the subject.
C) The relationship between feedback time and subject visibility depends on the success
of the test taker.
D) All of the above are correct interpretations.
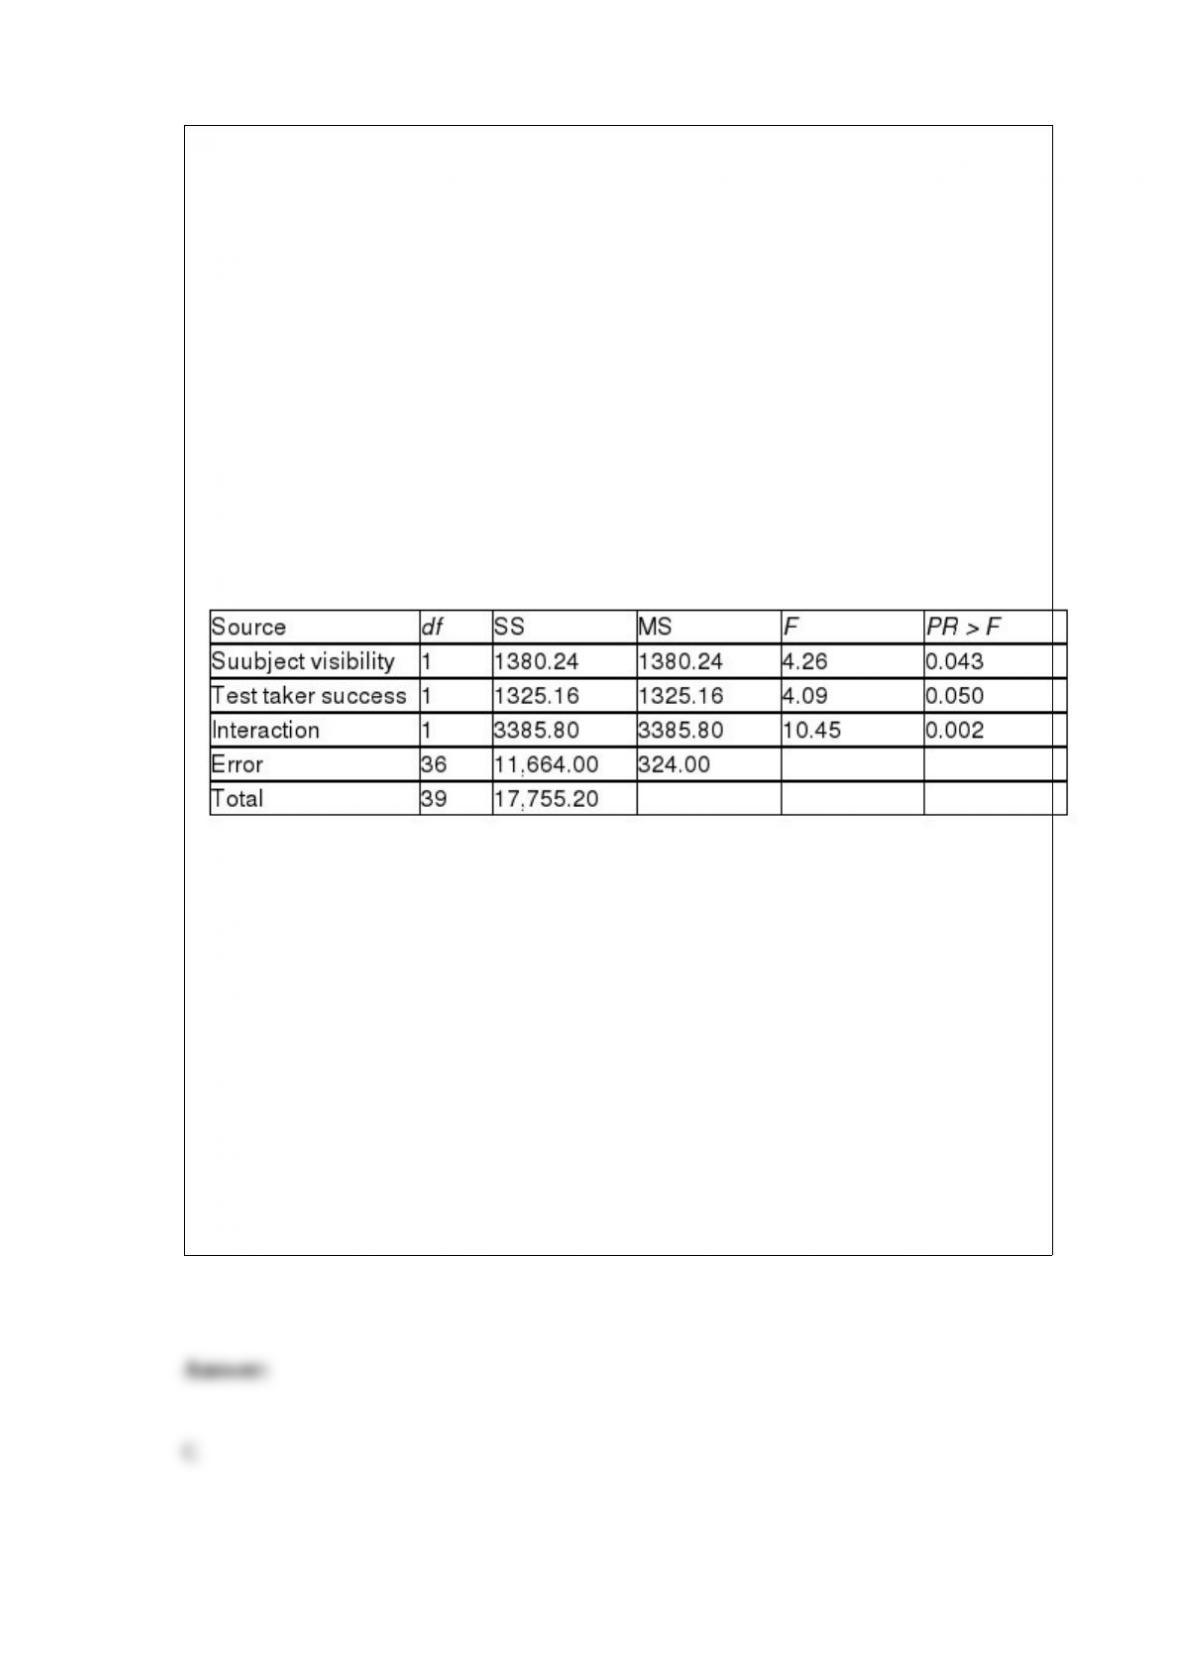
TABLE 11-6
Psychologists have found that people are generally reluctant to transmit bad news to
their peers. This phenomenon has been termed the “MUM effect.” To investigate the
cause of the MUM effect, 40 undergraduates at Duke University participated in an
experiment. Each subject was asked to administer an IQ test to another student and then
provide the test taker with his or her percentile score. Unknown to the subject, the test
taker was a bogus student who was working with the researchers. The experimenters
manipulated two factors: subject visibility and success of test taker, each at two
levels. Subject visibility was either visible or not visible to the test taker. Success of the
test taker was either top 20% or bottom 20%. Ten subjects were randomly assigned to
each of the 2 x 2 = 4 experimental conditions, then the time (in seconds) between the
end of the test and the delivery of the percentile score from the subject to the test taker
was measured. (This variable is called the latency to feedback.) The data were
subjected to appropriate analyses with the following results.
Referring to Table 11-6, at the 0.01 level, what conclusions can you reach from the
analysis?
A) At the 0.01 level, subject visibility and test taker success are significant predictors of
latency feedback.
B) At the 0.01 level, the model is not useful for predicting latency to feedback.
C) At the 0.01 level, there is evidence to indicate that subject visibility and test taker
success interact.
D) At the 0.01 level, there is no evidence of interaction between subject visibility and
test taker success.
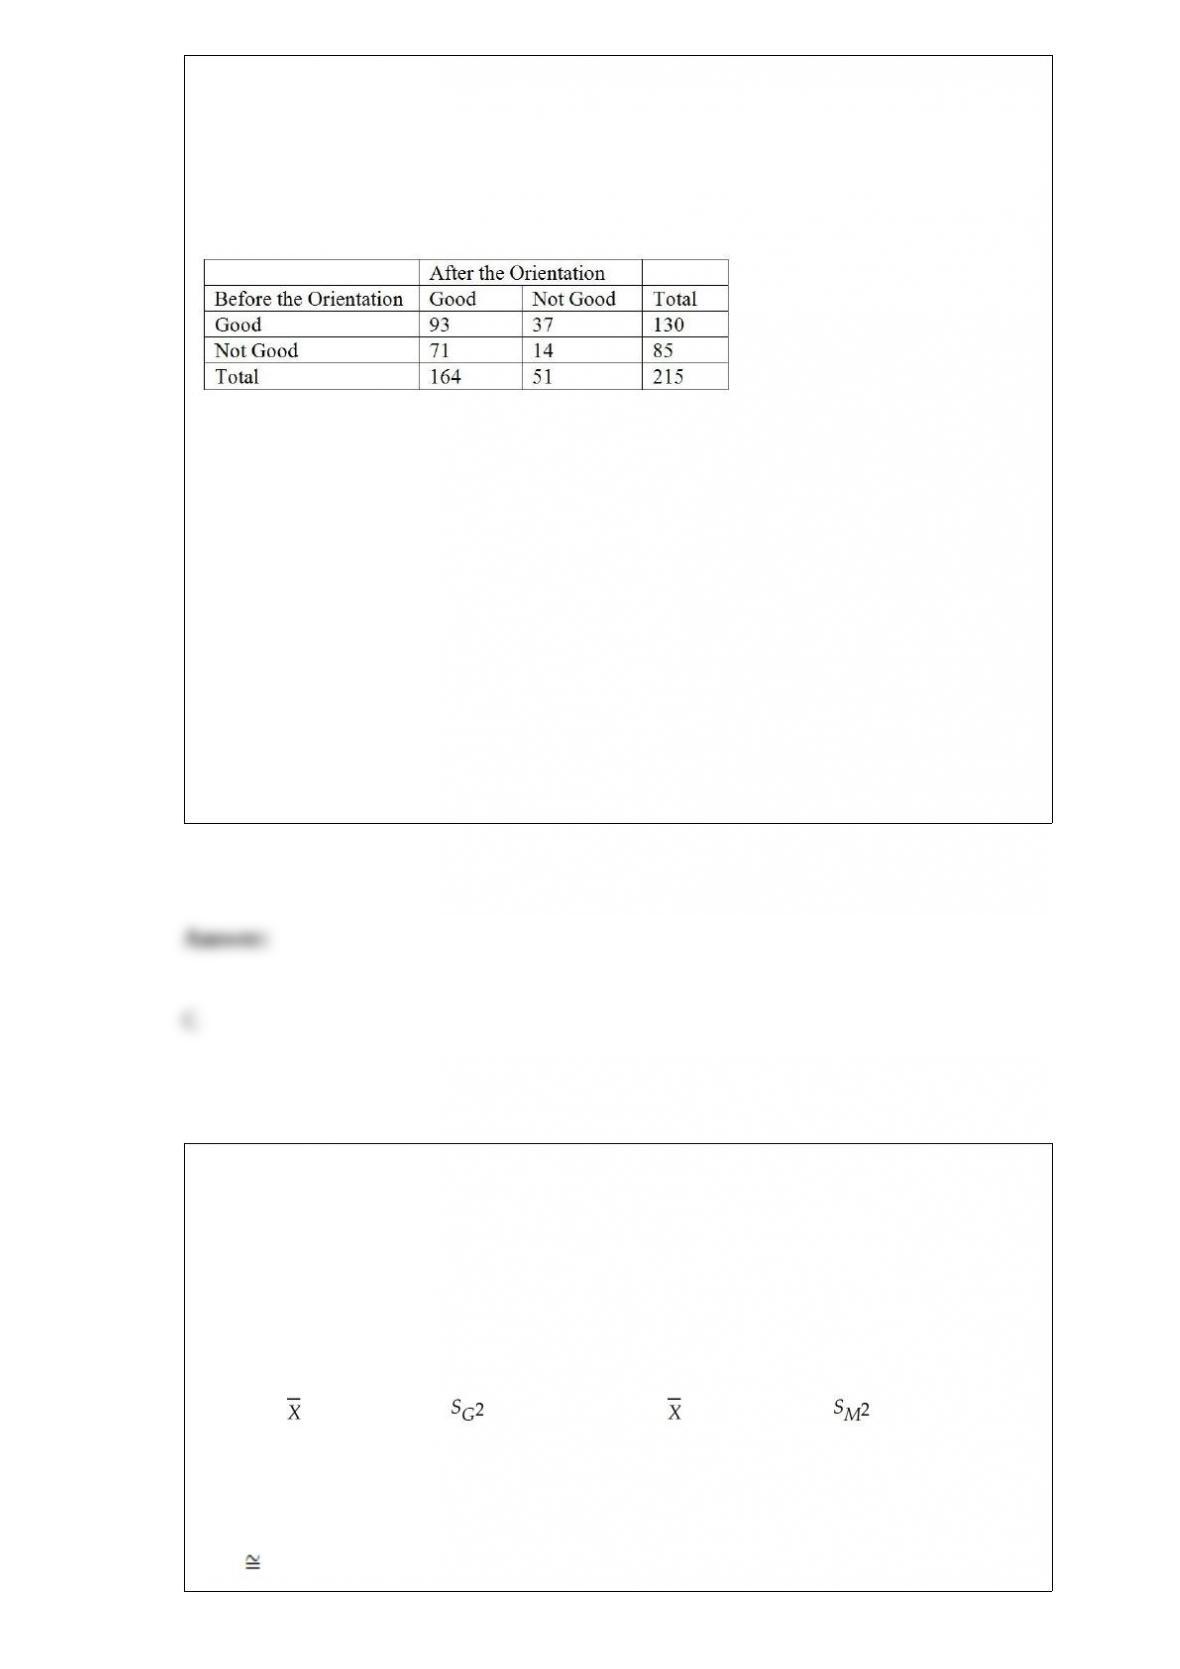
TABLE 12-19
The director of the MBA program of a state university wanted to know if a one-week
orientation would change the proportion among potential incoming students who would
perceive the program as being good. Given below is the result from 215 students’ view
of the program before and after the orientation.
True or False: Referring to Table 12-19, what should be the director’s conclusion?
A) There is sufficient evidence that the proportion of potential incoming students who
perceive the program as being good is the same before and after the orientation.
B) There is insufficient evidence that the proportion of potential incoming students who
perceive the program as being good is the same before and after the orientation.
C) There is sufficient evidence that the proportion of potential incoming students who
perceive the program as being good is not the same before and after the orientation.
D) There is insufficient evidence that the proportion of potential incoming students who
perceive the program as being good is not the same before and after the orientation.
TABLE 10-3
A real estate company is interested in testing whether the mean time that families in
Gotham have been living in their current homes is less than families in Metropolis.
Assume that the two population variances are equal. A random sample of 100 families
from Gotham and a random sample of 150 families in Metropolis yield the following
data on length of residence in current homes.
Gotham: G = 35 months, = 900 Metropolis: M = 50 months, = 1050
Referring to Table 10-3, what is(are) the critical value(s) of the relevant hypothesis test
if the level of significance is 0.05?
A) t Z = -1.645
B) t Z = 1.96
C) t Z = -1.96
D) t Z = -2.080
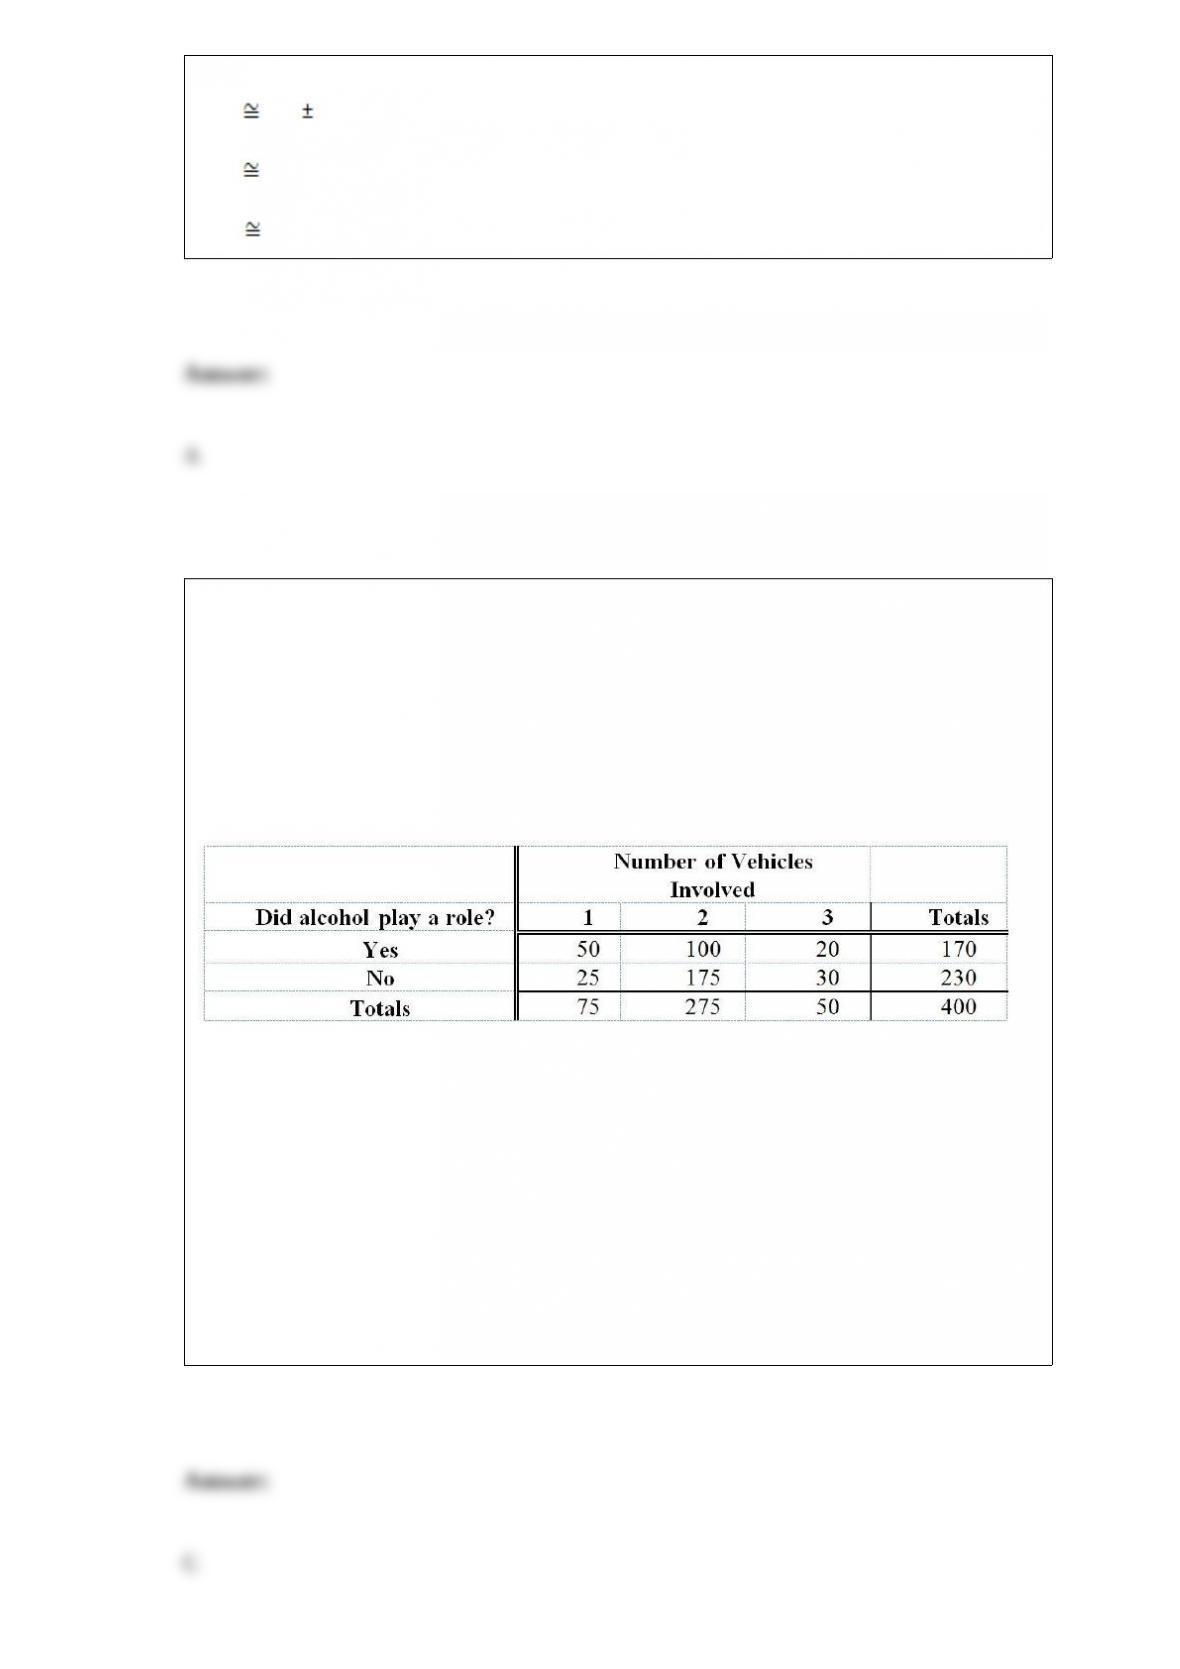
TABLE 4-1
Mothers Against Drunk Driving is a very visible group whose main focus is to educate
the public about the harm caused by drunk drivers. A study was recently done that
emphasized the problem we all face with drinking and driving. Four hundred accidents
that occurred on a Saturday night were analyzed. Two items noted were the number of
vehicles involved and whether alcohol played a role in the accident. The numbers are
shown below:
Referring to Table 4-1, given that alcohol was not involved, what proportion of the
accidents were multiple vehicle?
A) 50/170 or 29.41%
B) 120/170 or 70.59%
C) 205/230 or 89.13%
D) 25/230 or 10.87%
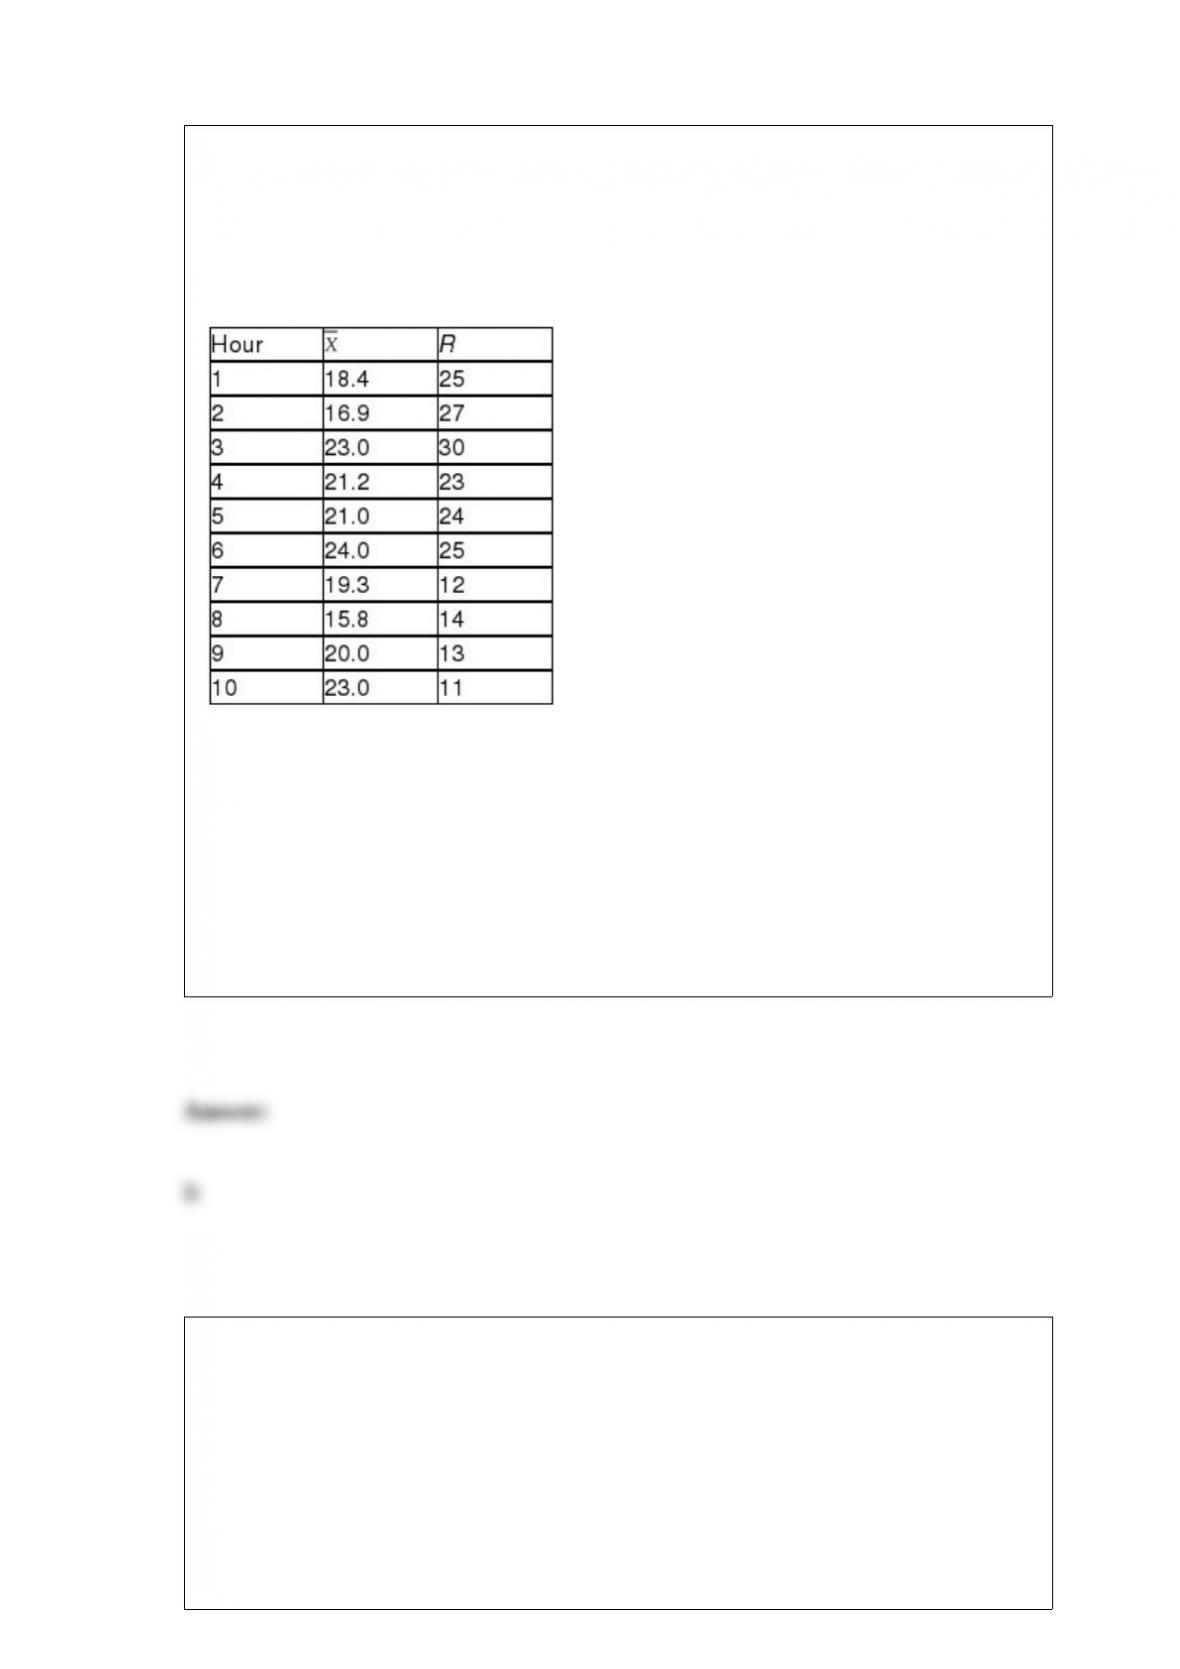
TABLE 18-4
A factory supervisor is concerned that the time it takes workers to complete an
important production task (measured in seconds) is too erratic and adversely affects
expected profits. The supervisor proceeds by randomly sampling 5 individuals per hour
for a period of 10 hours. The sample mean and range for each hour are listed below.
She also decides that lower and upper specification limit for the critical-to-quality
variable should be 10 and 30 seconds, respectively.
Referring to Table 18-4, suppose the sample mean and range data were based on 6
observations per hour instead of 5. How would this change affect the lower and upper
control limits of an R chart?
A) LCL would increase; UCL would decrease.
B) LCL would remain the same; UCL would decrease.
C) Both LCL and UCL would remain the same.
D) LCL would decrease; UCL would increase.
Suppose the probability of finding a defective spot in an area on a piece of glass is the
ratio of that area to the total area of the glass and the probability is the same across the
whole glass. Which of the following distributions would you use to determine the
probability of finding a defective spot in a randomly selected one square inch area on a
piece of 10 feet by 10 feet glass?
A) Normal distribution
B) Poisson distribution

C) Uniform distribution
D) Exponential distribution
Suppose that past history shows that 6% of college students prefer Brand A Cola. A
sample of 10,000 students is to be selected. Which of the following distributions would
you use to compute the probability that at least half of them will prefer Brand A cola?
A) Hypergeometric distribution.
B) Poisson distribution
C) Binomial distribution
D) Uniform distribution
In testing for differences between the means of 2 related populations where the variance
of the differences is unknown, the degrees of freedom are
A) n – 1.
B) n1 + n2 – 1.
C) n1 + n2 – 2.
D) n – 2.
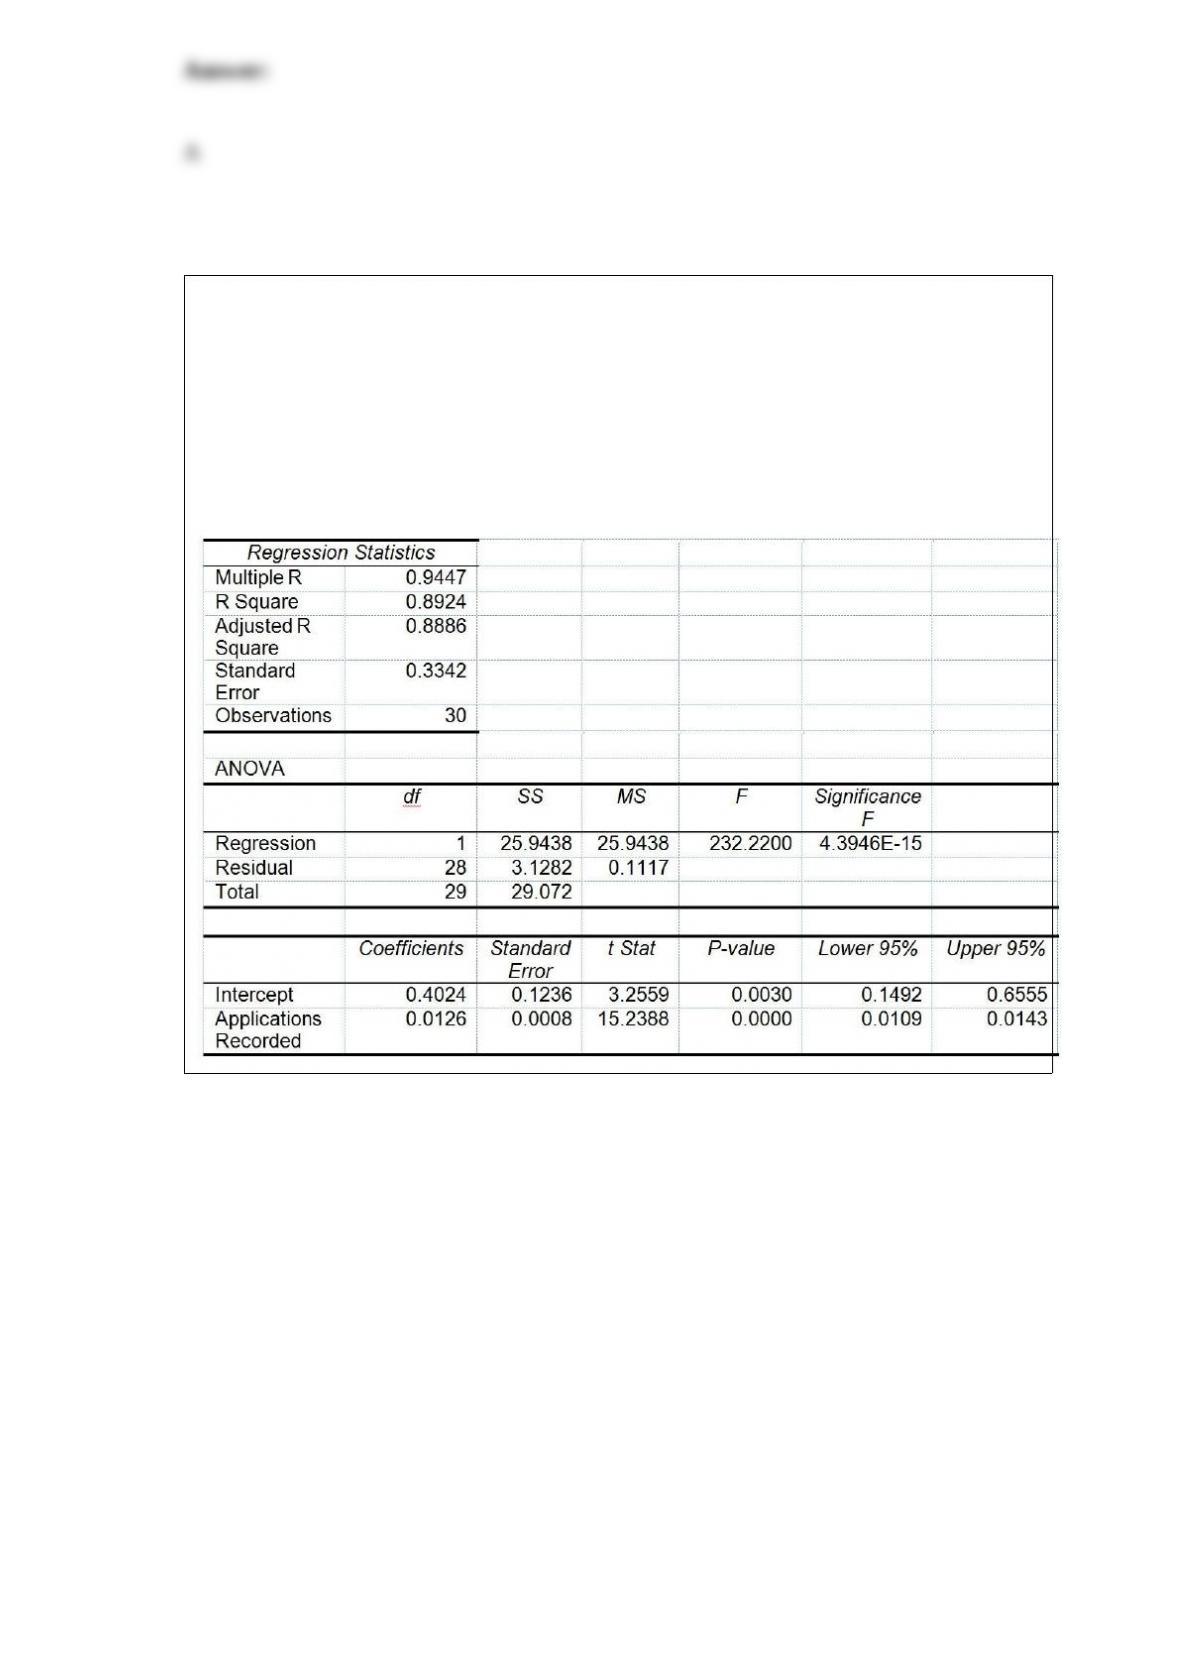
TABLE 13-12
The manager of the purchasing department of a large saving and loan organization
would like to develop a model to predict the amount of time (measured in hours) it
takes to record a loan application. Data are collected from a sample of 30 days, and the
number of applications recorded and completion time in hours is recorded. Below is the
regression output:
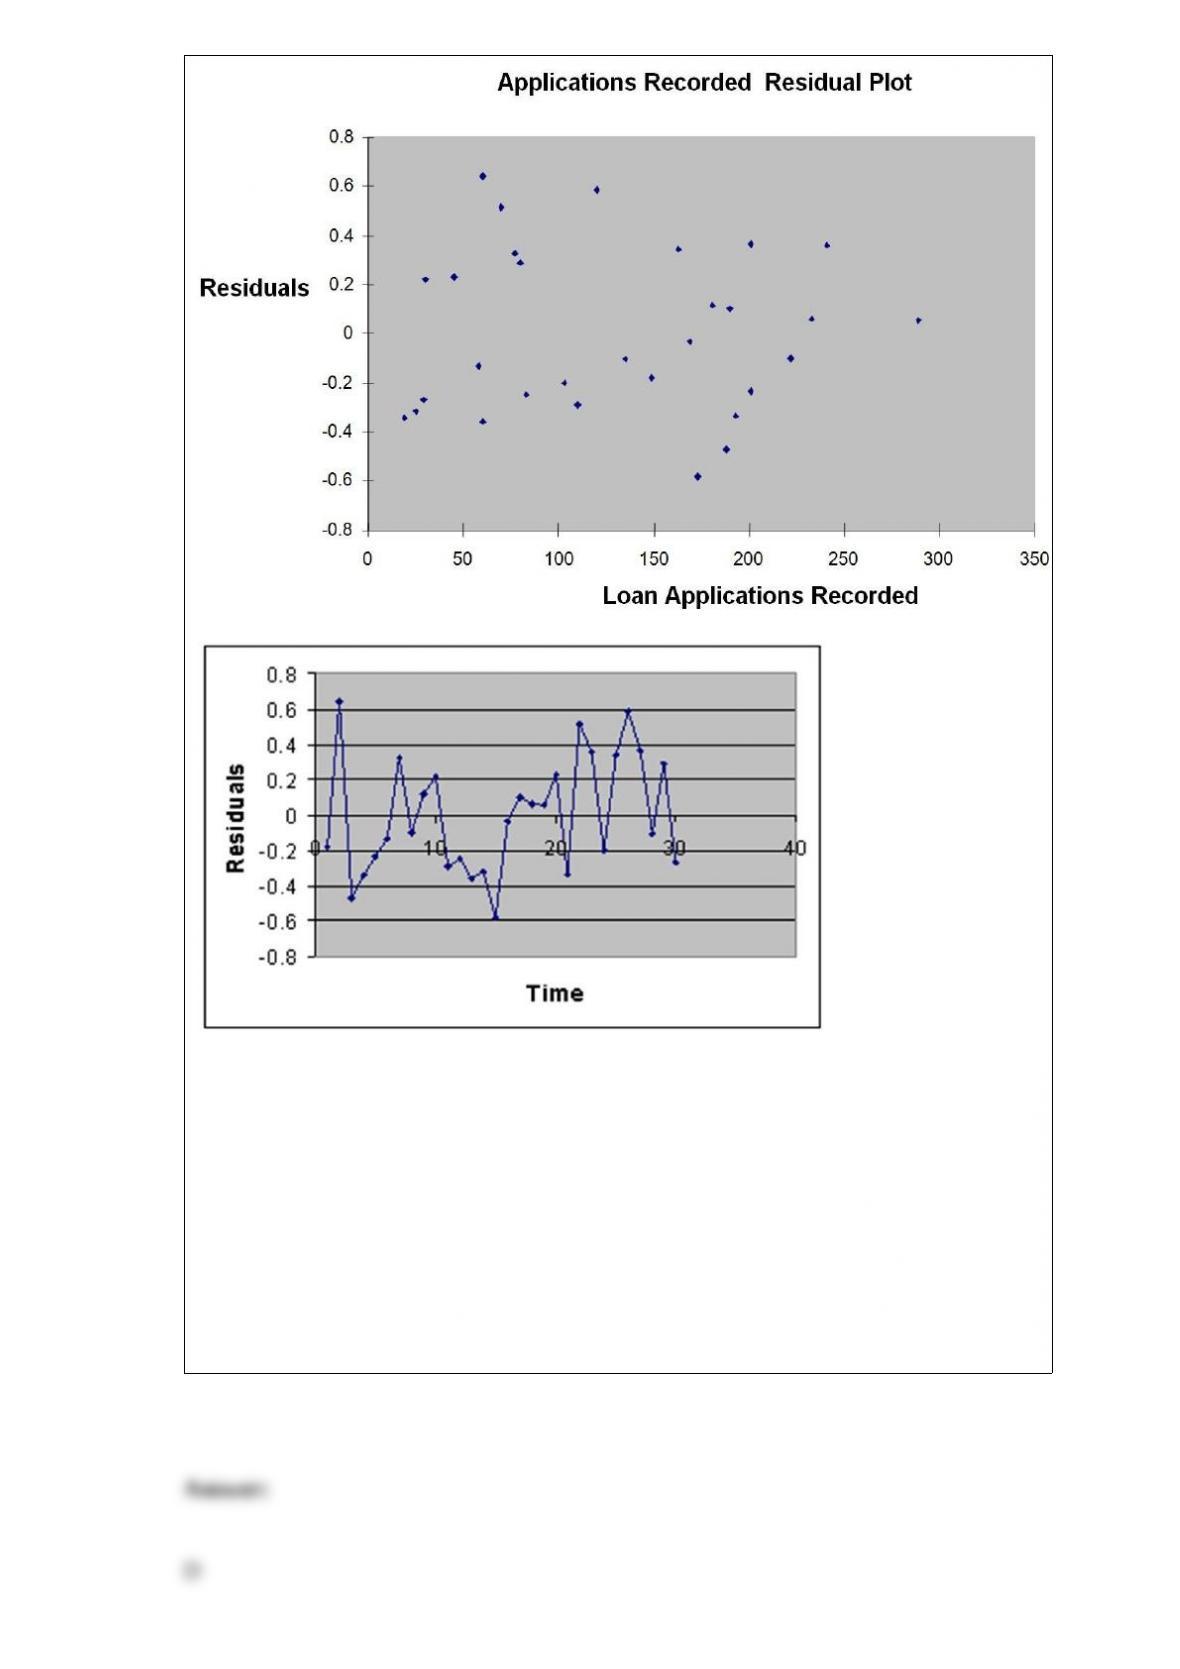
Referring to Table 13-12, the 90% confidence interval for the mean change in the
amount of time needed as a result of recording one additional loan application is
A) wider than [0.1492, 0.6555].
B) narrower than [0.1492, 0.6555].
C) wider than [0.0109, 0.0143].
D) narrower than [0.0109, 0.0143].

Private colleges and universities rely on money contributed by individuals and
corporations for their operating expenses. Much of this money is put into a fund called
an endowment, and the college spends only the interest earned by the fund. A recent
survey of 8 private colleges in the United States revealed the following endowments (in
millions of dollars): 60.2, 47.0, 235.1, 490.0, 122.6, 177.5, 95.4, and 220.0. What value
will be used as the point estimate for the mean endowment of all private colleges in the
United States?
A) $1,447.8
B) $180.975
C) $143.042
D) $8
Those methods involving the collection, presentation, and characterization of a set of
data in order to properly describe the various features of that set of data are called
A) statistical inference.
B) DCOVA framework.
C) operational definition.
D) descriptive statistics.
The smaller the spread of scores around the arithmetic mean,
A) the smaller the interquartile range.
B) the smaller the standard deviation.
C) the smaller the coefficient of variation.
D) All of the above.
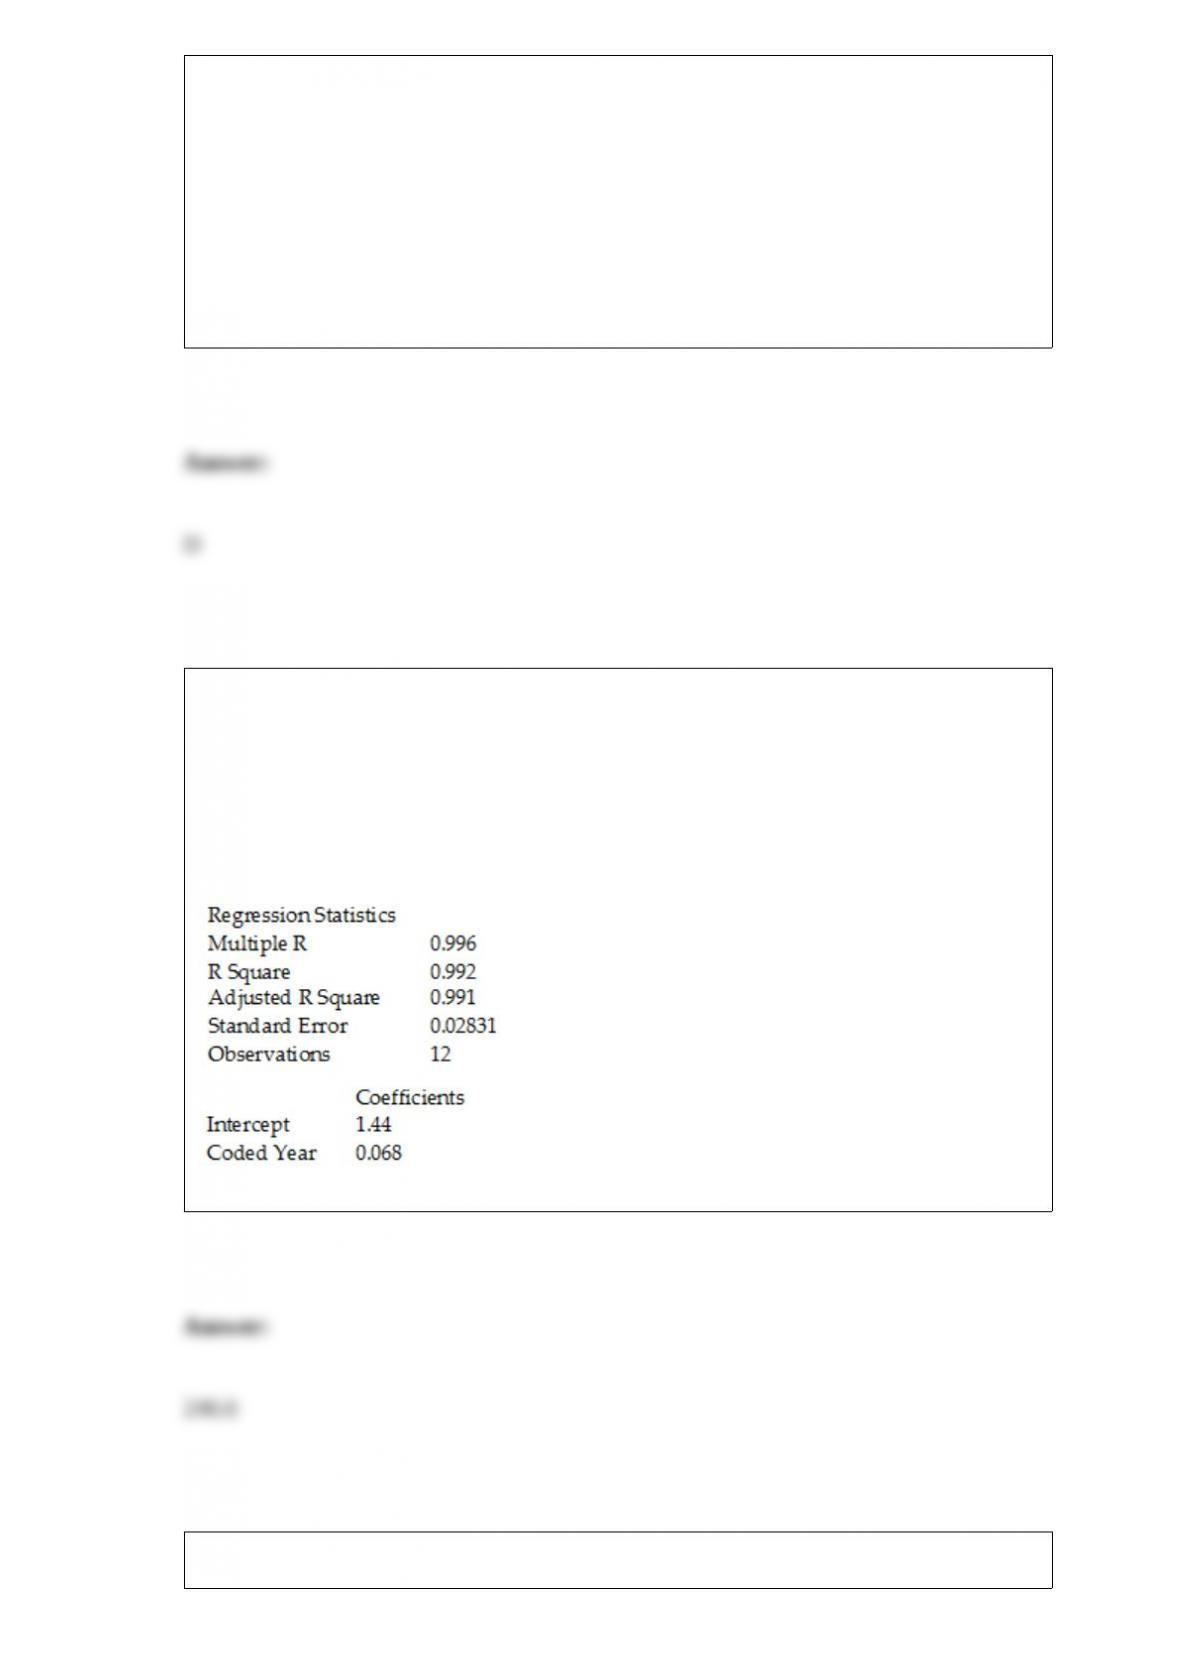
TABLE 16-7
The executive vice-president of a drug manufacturing firm believes that the demand for
the firm’s most popular drug has been evidencing an exponential trend since 1999. She
uses Microsoft Excel to obtain the partial output below. The dependent variable is the
log base 10 of the demand for the drug, while the independent variable is years, where
1999 is coded as 0, 2000 is coded as 1, etc.
SUMMARY OUTPUT
Referring to Table 16-7, the forecast for the demand in 2013 is ________.
Referring to Table 14-4 and allowing for a 1% probability of committing a type I error,
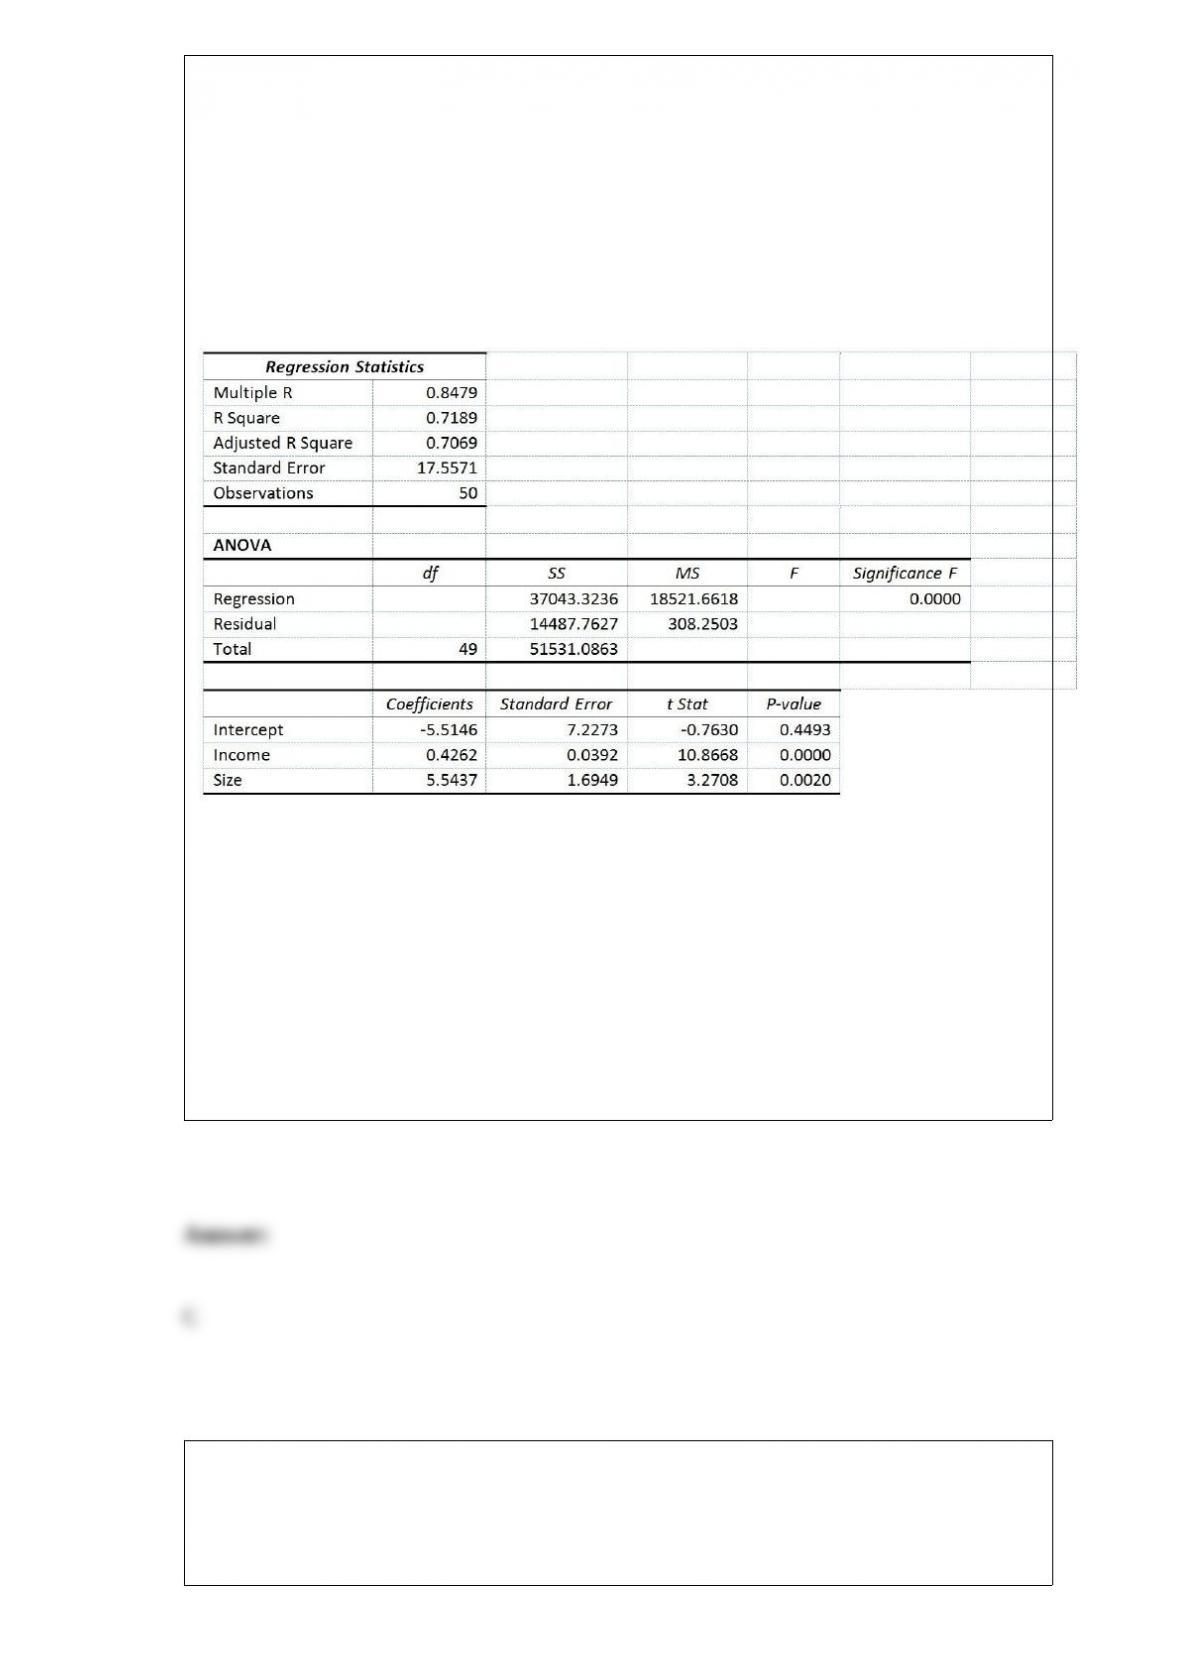
what is the decision and conclusion for the test H0 : β1 = β2 = 0 vs. H1 : At least one βj
≠0, j = 1, 2?
TABLE 14-4
A real estate builder wishes to determine how house size (House) is influenced by
family income (Income) and family size (Size). House size is measured in hundreds of
square feet and income is measured in thousands of dollars. The builder randomly
selected 50 families and ran the multiple regression. Partial Microsoft Excel output is
provided below:
Also SSR (X1∣ X2) = 36400.6326 and SSR (X2∣ X1) = 3297.7917
A) Do not reject H0 and conclude that the 2 independent variables taken as a group
have significant linear effects on house size.
B) Do not reject H0 and conclude that the 2 independent variables taken as a group do
not have significant linear effects on house size.
C) Reject H0 and conclude that the 2 independent variables taken as a group have
significant linear effects on house size.
D) Reject H0 and conclude that the 2 independent variables taken as a group do not
have significant linear effects on house size.
TABLE 4-2
An alcohol awareness task force at a Big-Ten university sampled 200 students after the
midterm to ask them whether they went bar hopping the weekend before the midterm or
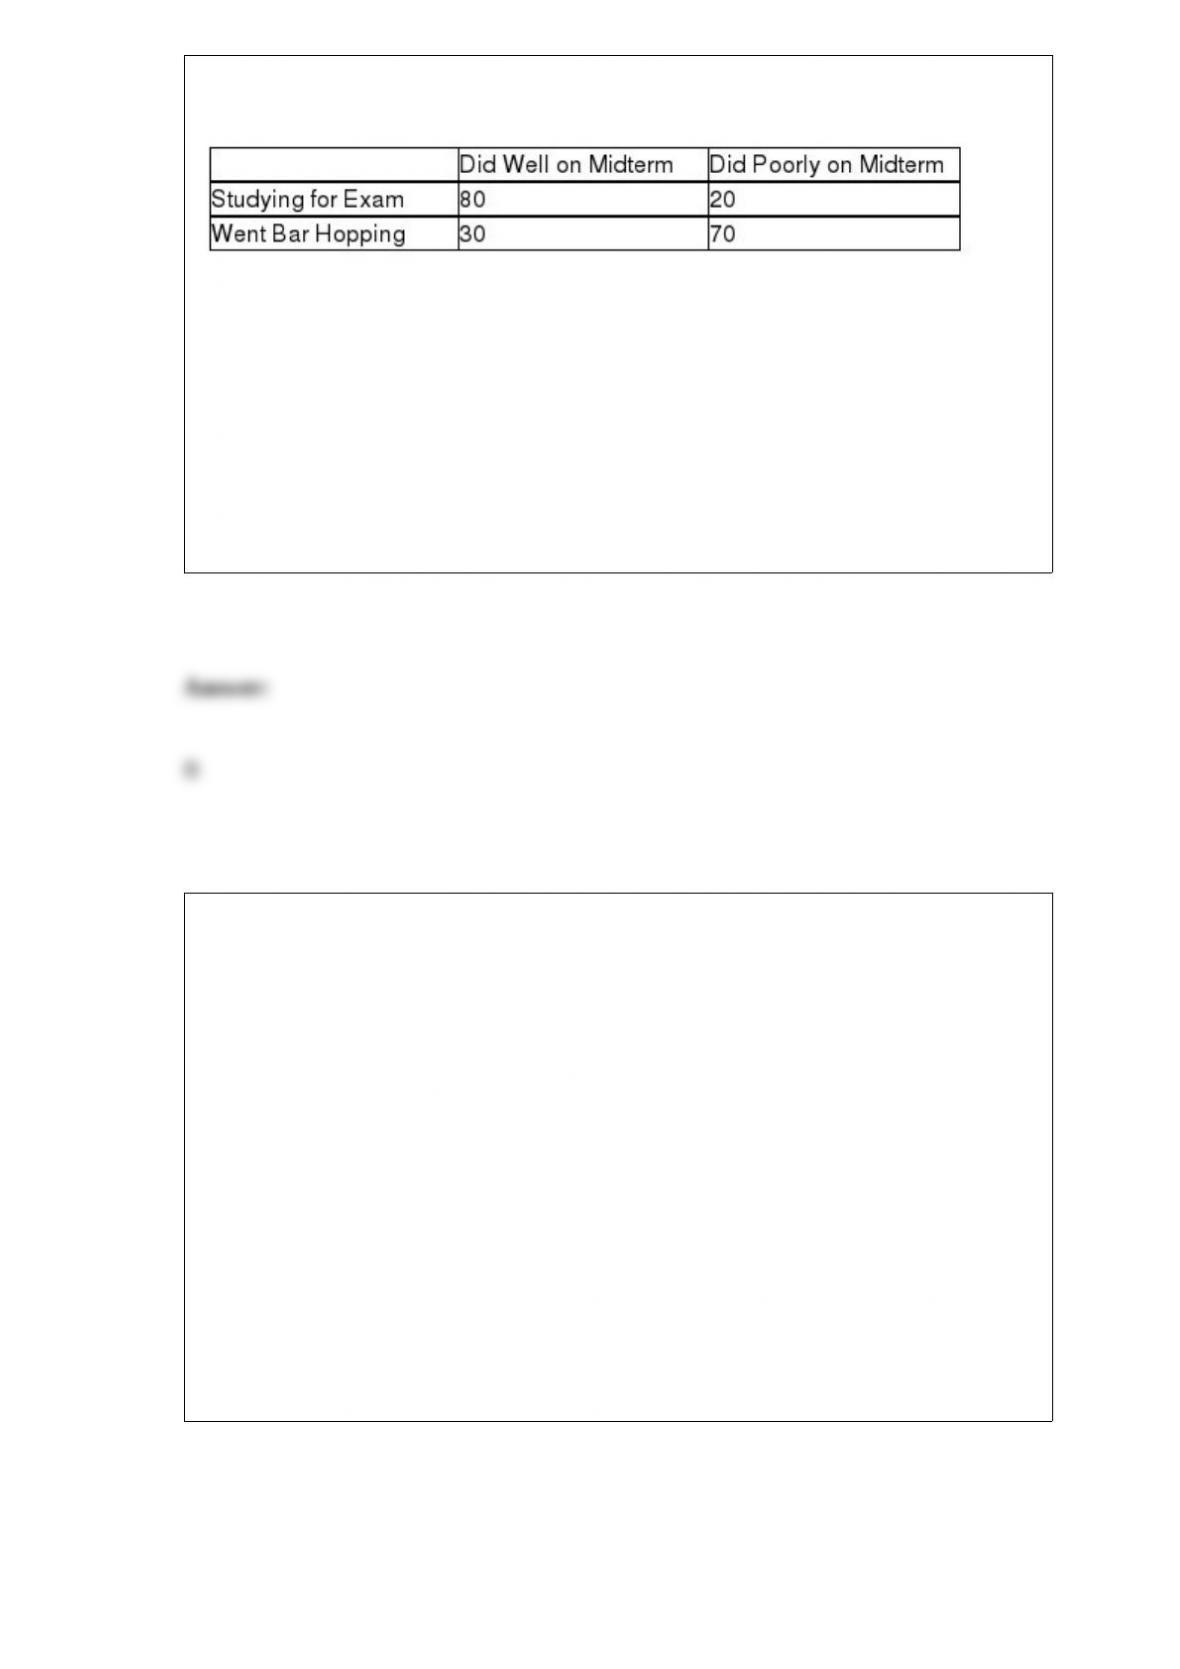
spent the weekend studying, and whether they did well or poorly on the midterm. The
following result was obtained.
Referring to Table 4-2, the events “Did Well on Midterm” and “Studying for Exam” are
A) not dependent.
B) not mutually exclusive.
C) collectively exhaustive.
D) None of the above.
TABLE 11-8
A physician and president of a Tampa Health Maintenance Organization (HMO) are
attempting to show the benefits of managed health care to an insurance company. The
physician believes that certain types of doctors are more cost-effective than others. One
theory is that Primary Specialty is an important factor in measuring the
cost-effectiveness of physicians. To investigate this, the president obtained independent
random samples of 20 HMO physicians from each of 4 primary specialties – General
Practice (GP), Internal Medicine (IM), Pediatrics (PED), and Family Physicians (FP) –
and recorded the total charges per member per month for each. A second factor which
the president believes influences total charges per member per month is whether the
doctor is a foreign or USA medical school graduate. The president theorizes that foreign
graduates will have higher mean charges than USA graduates. To investigate this, the
president also collected data on 20 foreign medical school graduates in each of the 4
primary specialty types described above. So information on charges for 40 doctors (20
foreign and 20 USA medical school graduates) was obtained for each of the 4
specialties. The results for the ANOVA are summarized in the following table.
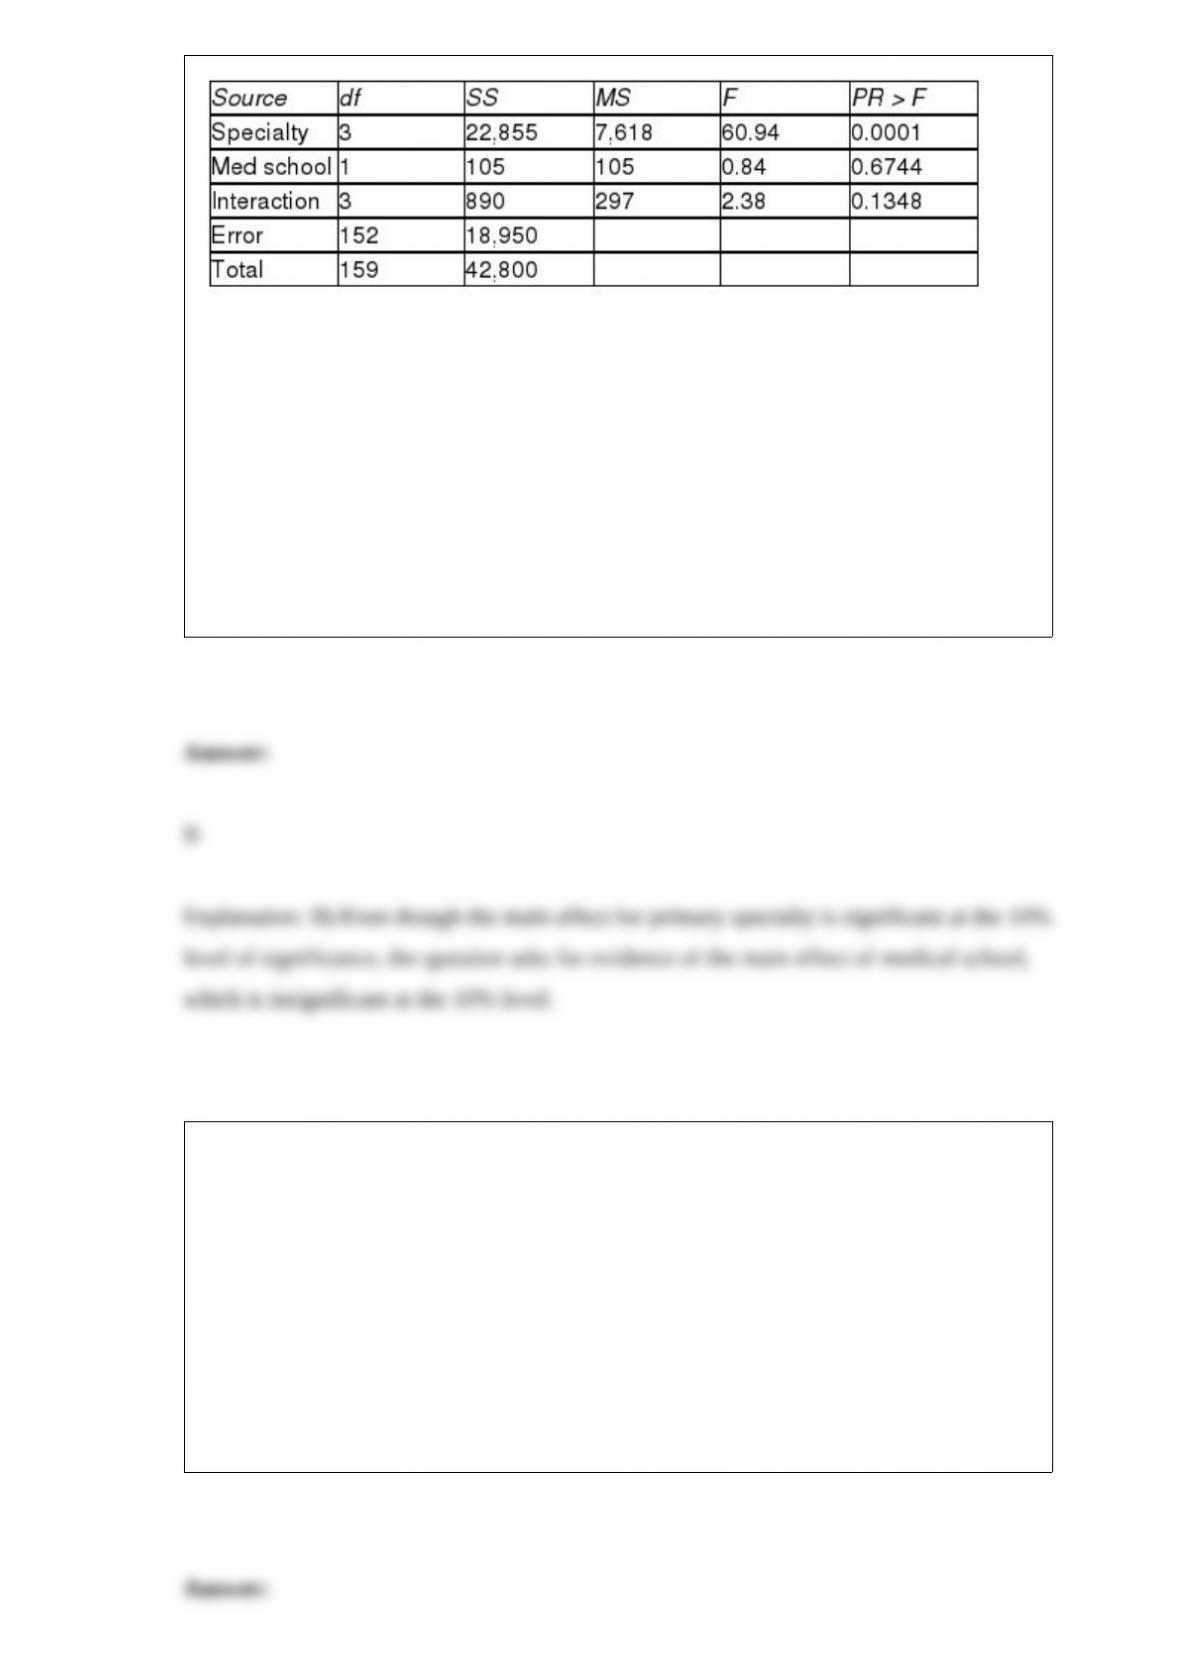
Referring to Table 11-8, is there evidence of a difference between the mean charges of
foreign and USA medical school graduates?
A) Yes, the test for the main effect for primary specialty is significant at α = 0.10.
B) No, the test for the main effect for medical school is not significant at α = 0.10.
C) No, the test for the interaction is not significant at α = 0.10.
D) Maybe, but we need information on the β-estimates to fully answer the question.
Suppose that past history shows that 60% of college students prefer Coca-Cola. A
sample of 10 students is to be selected. Which of the following distributions would you
use to figure out the probability that at least half of them will prefer Coca-Cola?
A) Binomial distribution
B) Poisson distribution
C) Normal distribution
D) Hypergeometric distribution

A researcher randomly sampled 30 graduates, 18 males and 12 females, of an MBA
program and recorded data concerning their starting salaries. Of primary interest to the
researcher was the effect of gender on starting salaries. Statistics of the mean salaries of
the females and males in the sample were computed. The sample standard deviations
suggest that the variability of starting salaries of the two groups is almost the same.
Suppose the starting salaries from both groups can be considered as normally
distributed. Which of the following tests will be the most appropriate?
A) Pooled-variance t test
B) Separate-variance t test
C) Paired t test
D) Wilcoxon rank sum test.
Suppose that past history shows that 60% of college students prefer Brand C cola. A
sample of 5 students is to be selected. The probability that at least 1 prefers brand C is
________.
TABLE 3-7
In a recent academic year, many public universities in the United States raised tuition
and fees due to a decrease in state subsidies. The change in the cost of tuition, a shared
dormitory room, and the most popular meal plan from the previous academic year for a
sample of 10 public universities were as follows: $1,589, $593, $1,223, $869, $423,
$1,720, $708, $1,425, $922 and $308.
Referring to Table 3-7, what is the kurtosis statistic of the change in the cost?
TABLE 15-6
Given below are results from the regression analysis on 40 observations where the
dependent variable is the number of weeks a worker is unemployed due to a layoff (Y)
and the independent variables are the age of the worker (X1), the number of years of
education received (X2), the number of years at the previous job (X3), a dummy variable
for marital status (X4: 1 = married, 0 = otherwise), a dummy variable for head of
household (X5: 1 = yes, 0 = no) and a dummy variable for management position (X6: 1
= yes, 0 = no).
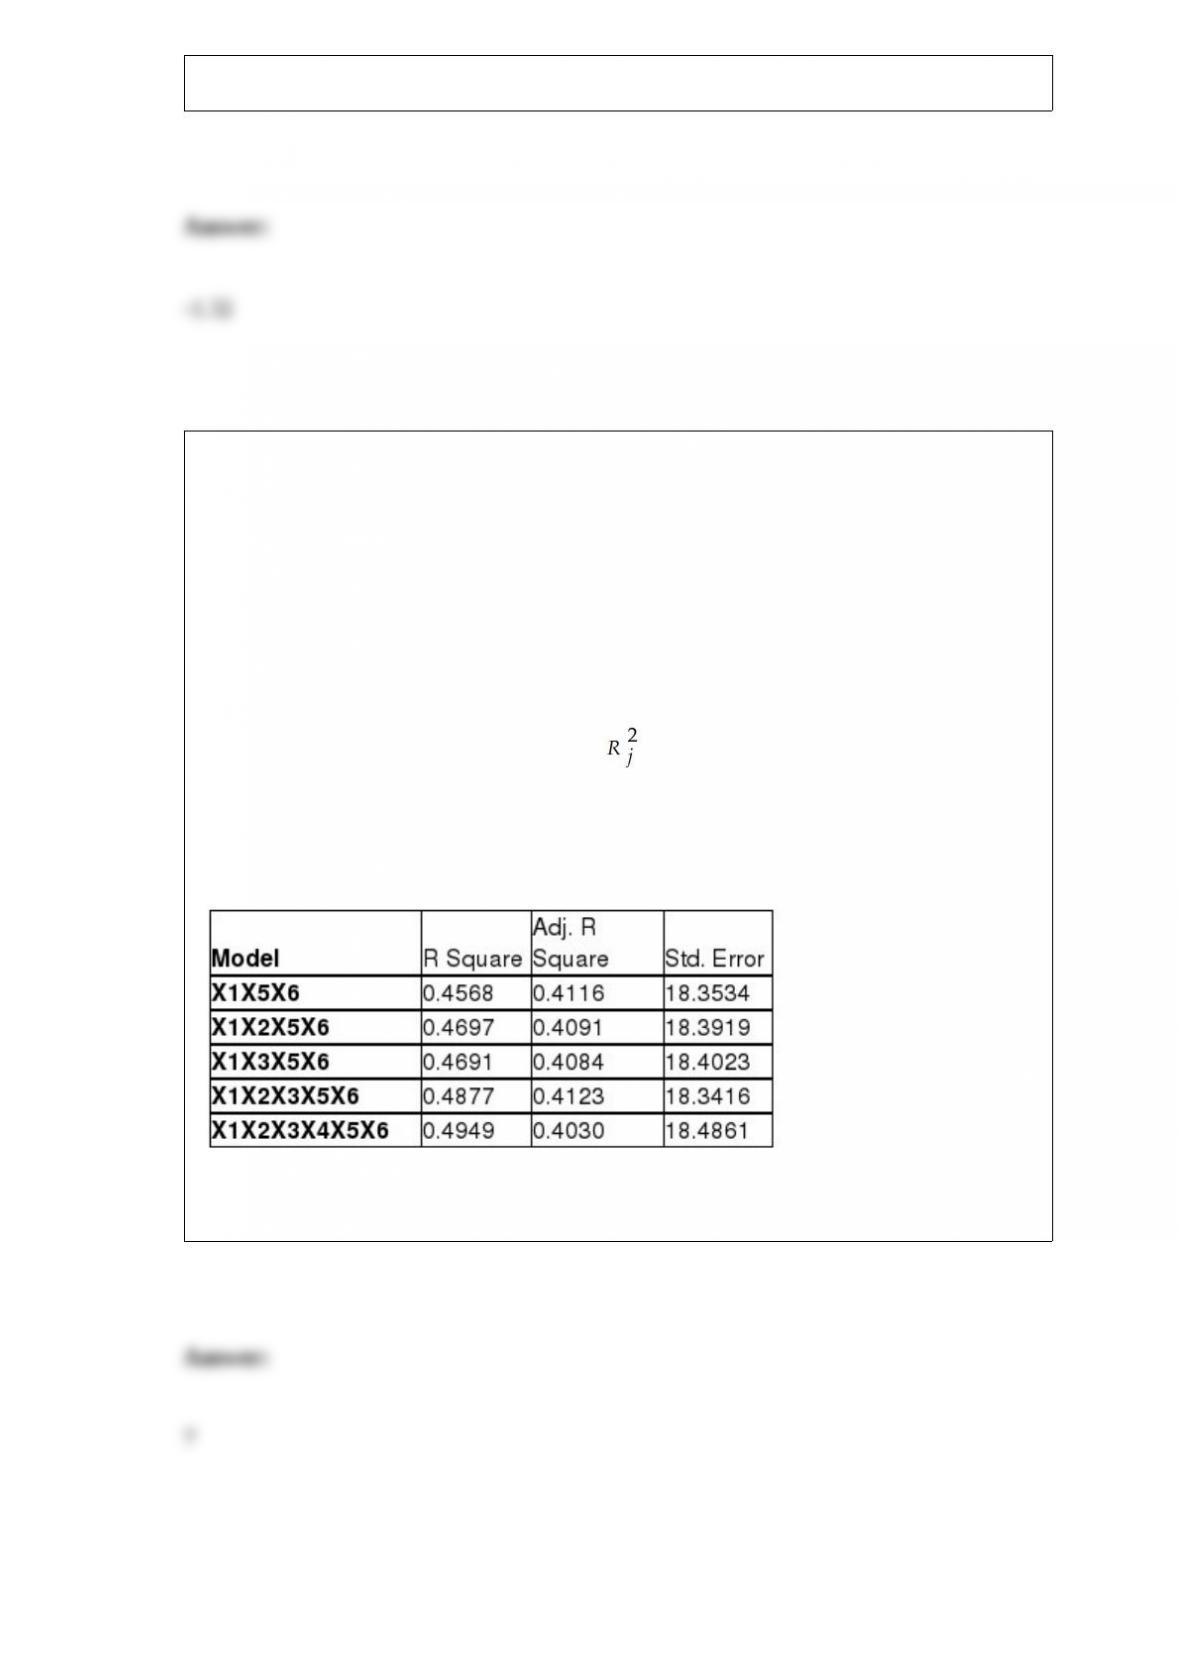
The coefficient of multiple determination ( ) for the regression model using each of
the 6 variables Xj as the dependent variable and all other X variables as independent
variables are, respectively, 0.2628, 0.1240, 0.2404, 0.3510, 0.3342 and 0.0993.
The partial results from best-subset regression are given below:
Referring to Table 15-6, what is the value of the Mallow’s Cp statistic for the model that
includes all the six independent variables?
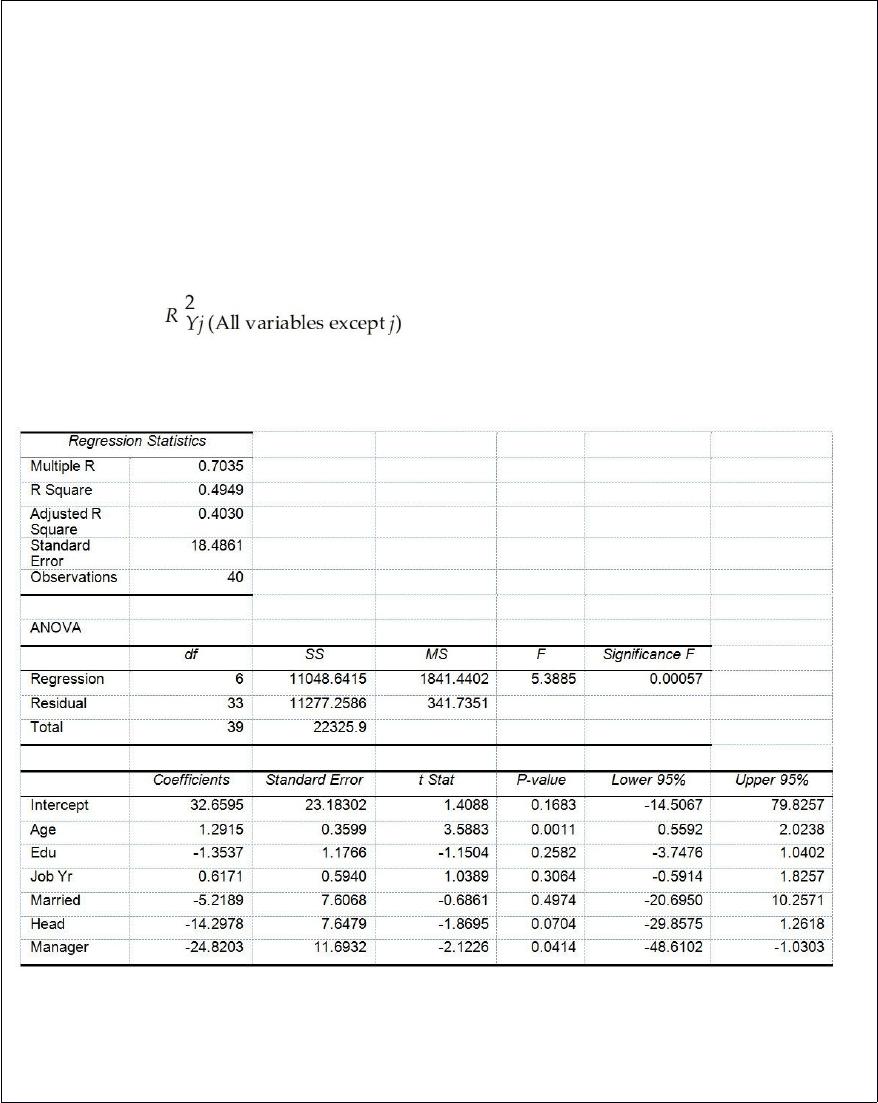
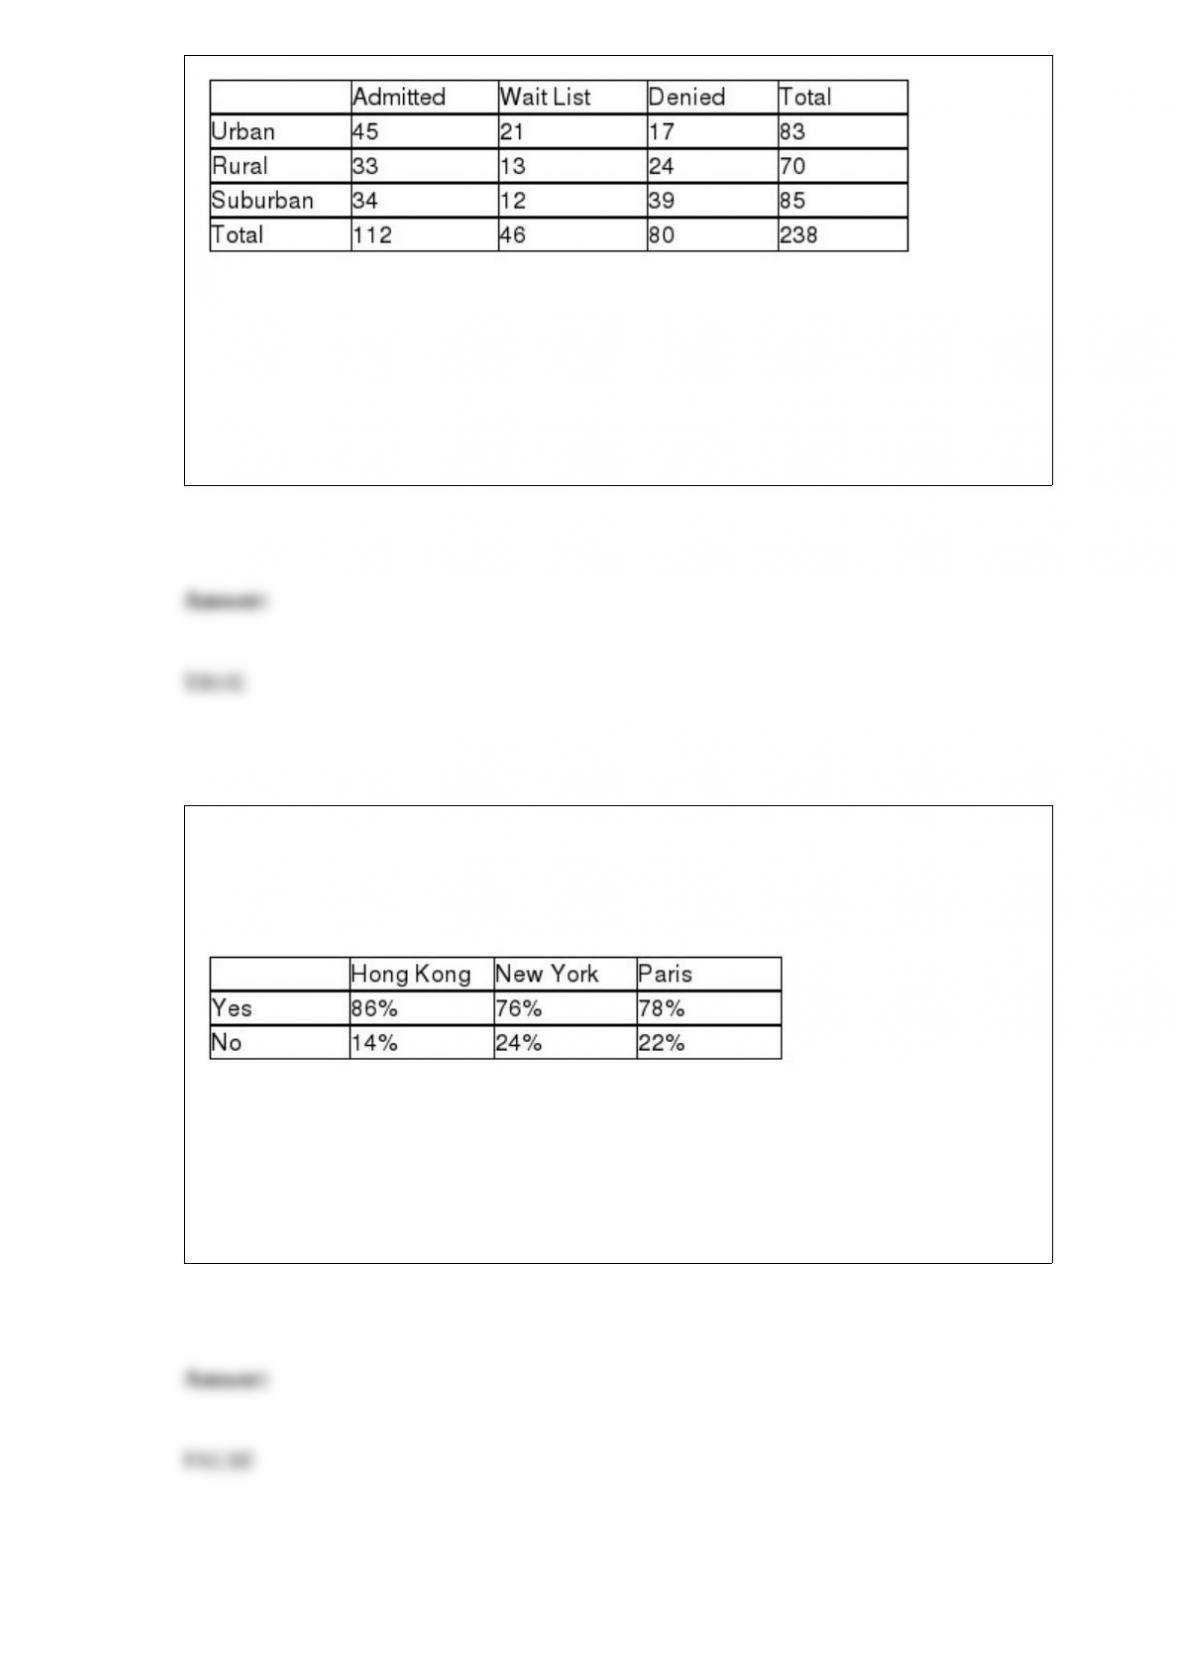
TABLE 17-10
Given below are results from the regression analysis where the dependent variable is
the number of weeks a worker is unemployed due to a layoff (Unemploy) and the
independent variables are the age of the worker (Age), the number of years of education
received (Edu), the number of years at the previous job (Job Yr), a dummy variable for
marital status (Married: 1 = married, 0 = otherwise), a dummy variable for head of
household (Head: 1 = yes, 0 = no) and a dummy variable for management position
(Manager: 1 = yes, 0 = no). We shall call this Model 1. The coefficient of partial
determination ( ) of each of the 6 predictors are, respectively,
0.2807, 0.0386, 0.0317, 0.0141, 0.0958, and 0.1201.
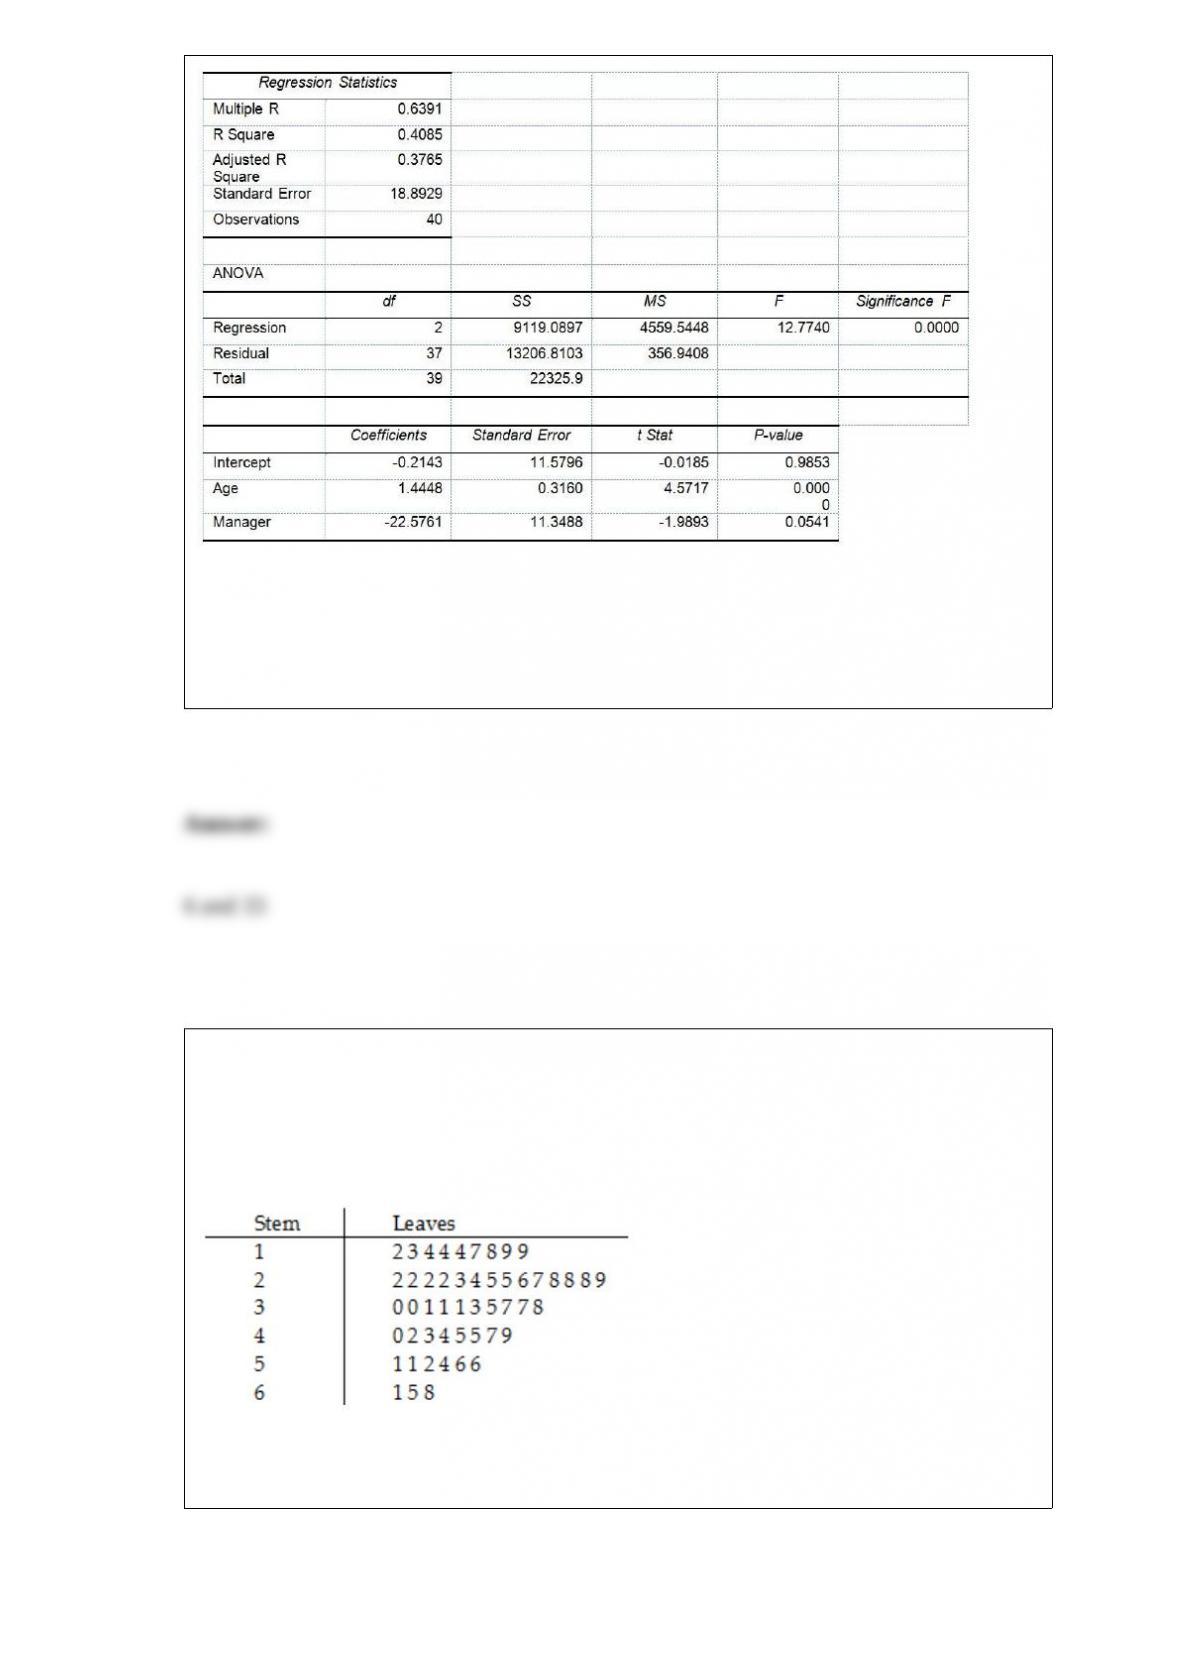
Model 2 is the regression analysis where the dependent variable is Unemploy and the
independent variables are Age and Manager. The results of the regression analysis are
given below:
Referring to Table 17-10, Model 1, what are the numerator and denominator degrees of
freedom, respectively, for the test statistic to determine whether there is a significant
relationship between the number of weeks a worker is unemployed due to a layoff and
the entire set of explanatory variables?
TABLE 2-7
The Stem-and-Leaf display below contains data on the number of months between the
date a civil suit is filed and when the case is actually adjudicated for 50 cases heard in
superior court.
Referring to Table 2-7, ________ percent of the cases were not adjudicated within the
first 4 years.
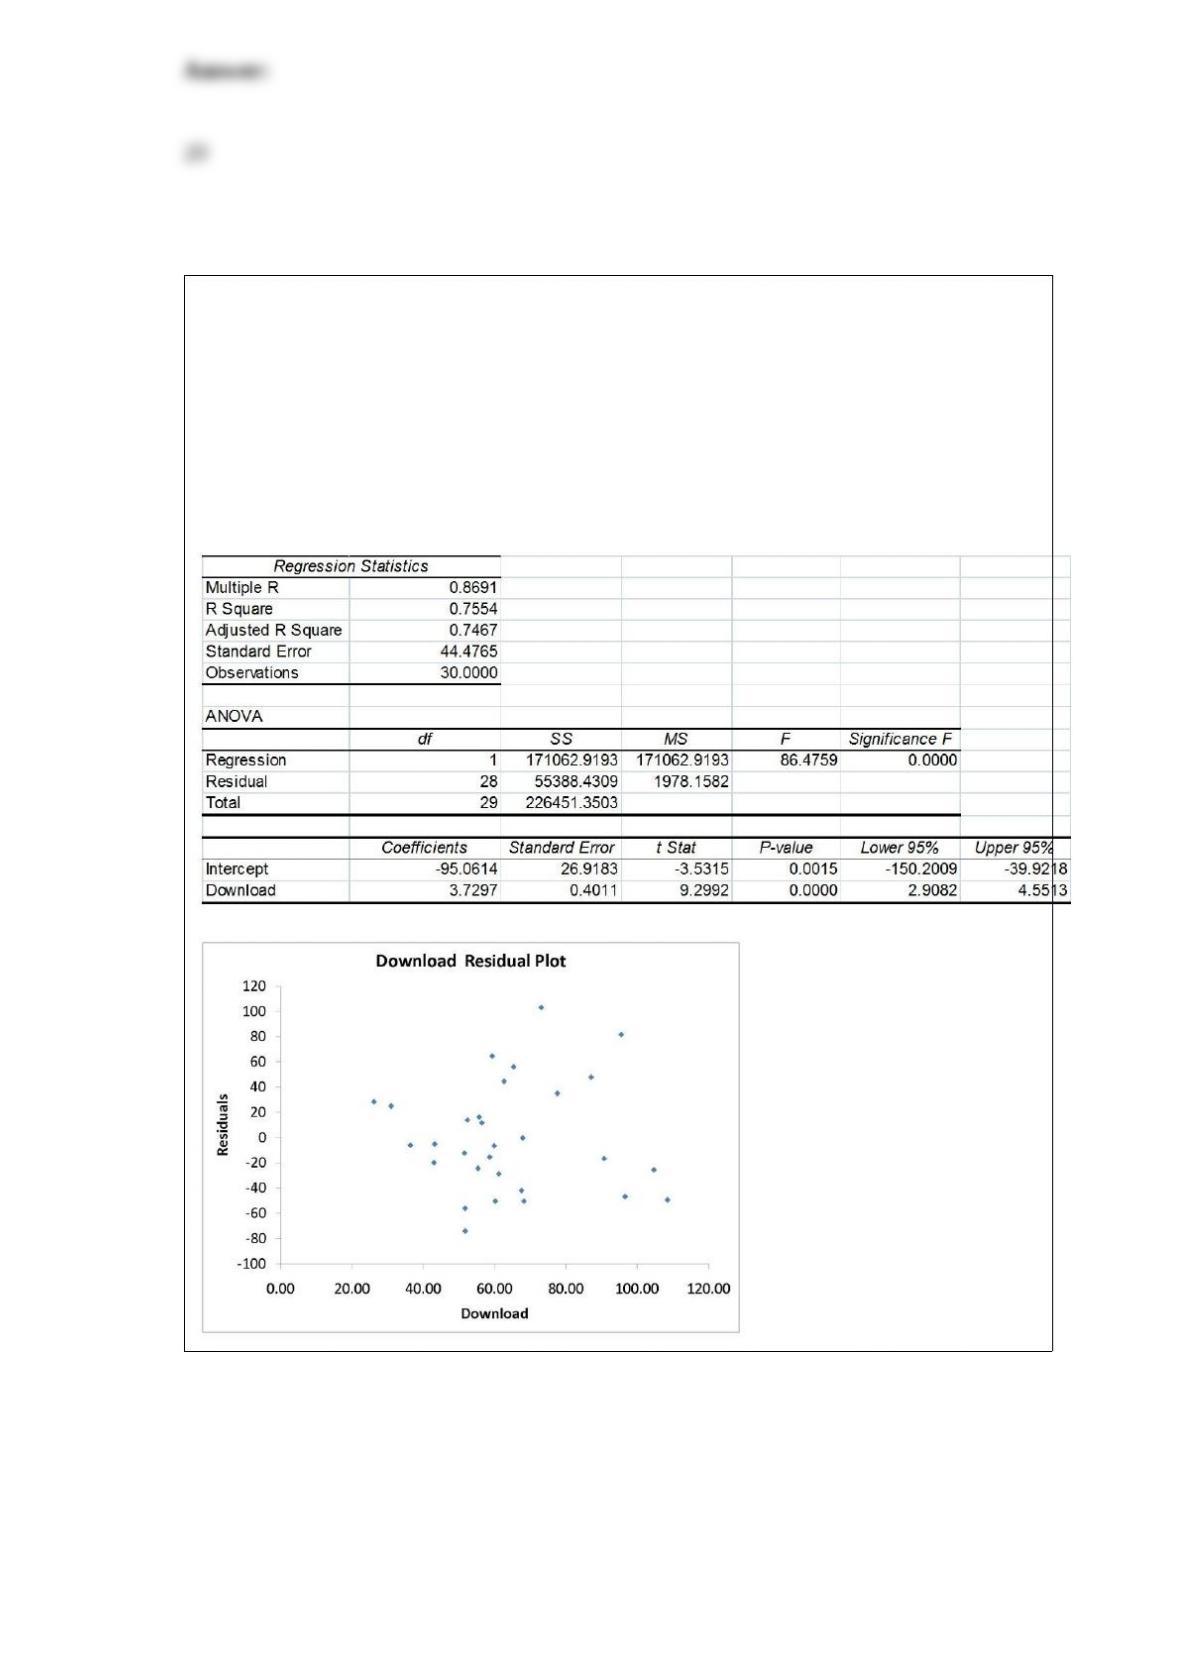
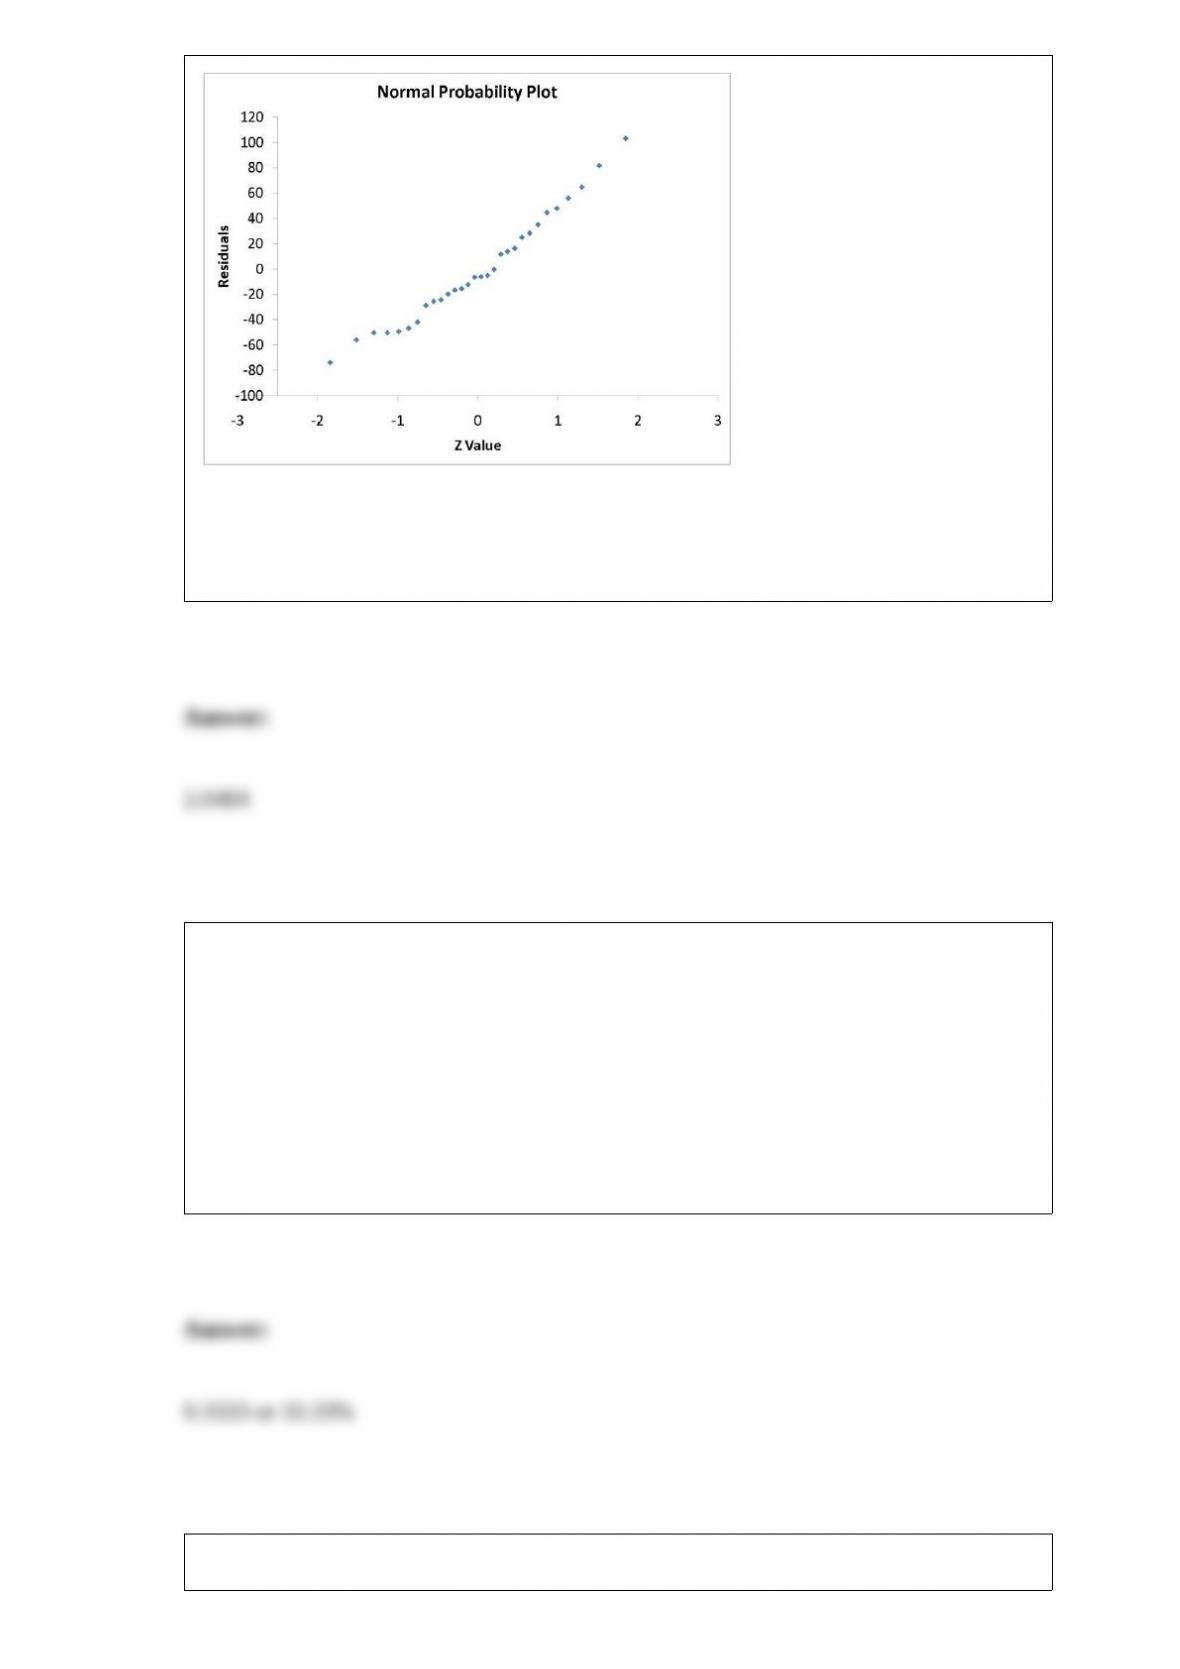
TABLE 13-11
A computer software developer would like to use the number of downloads (in
thousands) for the trial version of his new shareware to predict the amount of revenue
(in thousands of dollars) he can make on the full version of the new shareware.
Following is the output from a simple linear regression along with the residual plot and
normal probability plot obtained from a data set of 30 different sharewares that he has
developed:
Referring to Table 13-11, what is the critical value for testing whether there is a linear
relationship between revenue and the number of downloads at a 5% level of
significance?
TABLE 4-12
Jake woke up late in the morning on the day that he has to go to school to take an
important test. He can either take the shuttle bus which is usually running late 20% of
the time or ride his unreliable motorcycle which breaks down 40% of the time. He
decides to toss a fair coin to make his choice.
Referring to Table 4-12, if Jake is late to the test, what is the probability that he took the
bus?
The sampling process begins by locating appropriate data sources called ________.

TABLE 5-8
Two different designs on a new line of winter jackets for the coming winter are
available for your manufacturing plants. Your profit (in thousands of dollars) will
depend on the taste of the consumers when winter arrives. The probability of the three
possible different tastes of the consumers and the corresponding profits are presented in
the following table.
Referring to Table 5-8, if you decide to choose Design A for 70% of the production
lines and Design B for the remaining production lines, what is the risk of your
investment?
TABLE 2-7
The Stem-and-Leaf display below contains data on the number of months between the
date a civil suit is filed and when the case is actually adjudicated for 50 cases heard in
superior court.

Referring to Table 2-7, if a frequency distribution with equal sized classes was made
from this data, and the first class was “10 but less than 20,” the frequency of that class
would be ________.
TABLE 9-10
A manufacturer produces light bulbs that have a mean life of at least 500 hours when
the production process is working properly. Based on past experience, the population
standard deviation is 50 hours and the light bulb life is normally distributed. The
operations manager stops the production process if there is evidence that the population
mean light bulb life is below 500 hours.
Referring to Table 9-10, if you select a sample of 100 light bulbs and are willing to have
a level of significance of 0.01, the probability of the operations manager failing to stop
the process if the population mean bulb life is 490 hours is ________.