True or False: TABLE 17-9
What are the factors that determine the acceleration time (in sec.) from 0 to 60 miles per
hour of a car? Data on the following variables for 171 different vehicle models were
collected:
Accel Time: Acceleration time in sec.
Cargo Vol: Cargo volume in cu. ft.
HP: Horsepower
MPG: Miles per gallon
SUV: 1 if the vehicle model is an SUV with Coupe as the base when SUV and Sedan
are both 0
Sedan: 1 if the vehicle model is a sedan with Coupe as the base when SUV and Sedan
are both 0
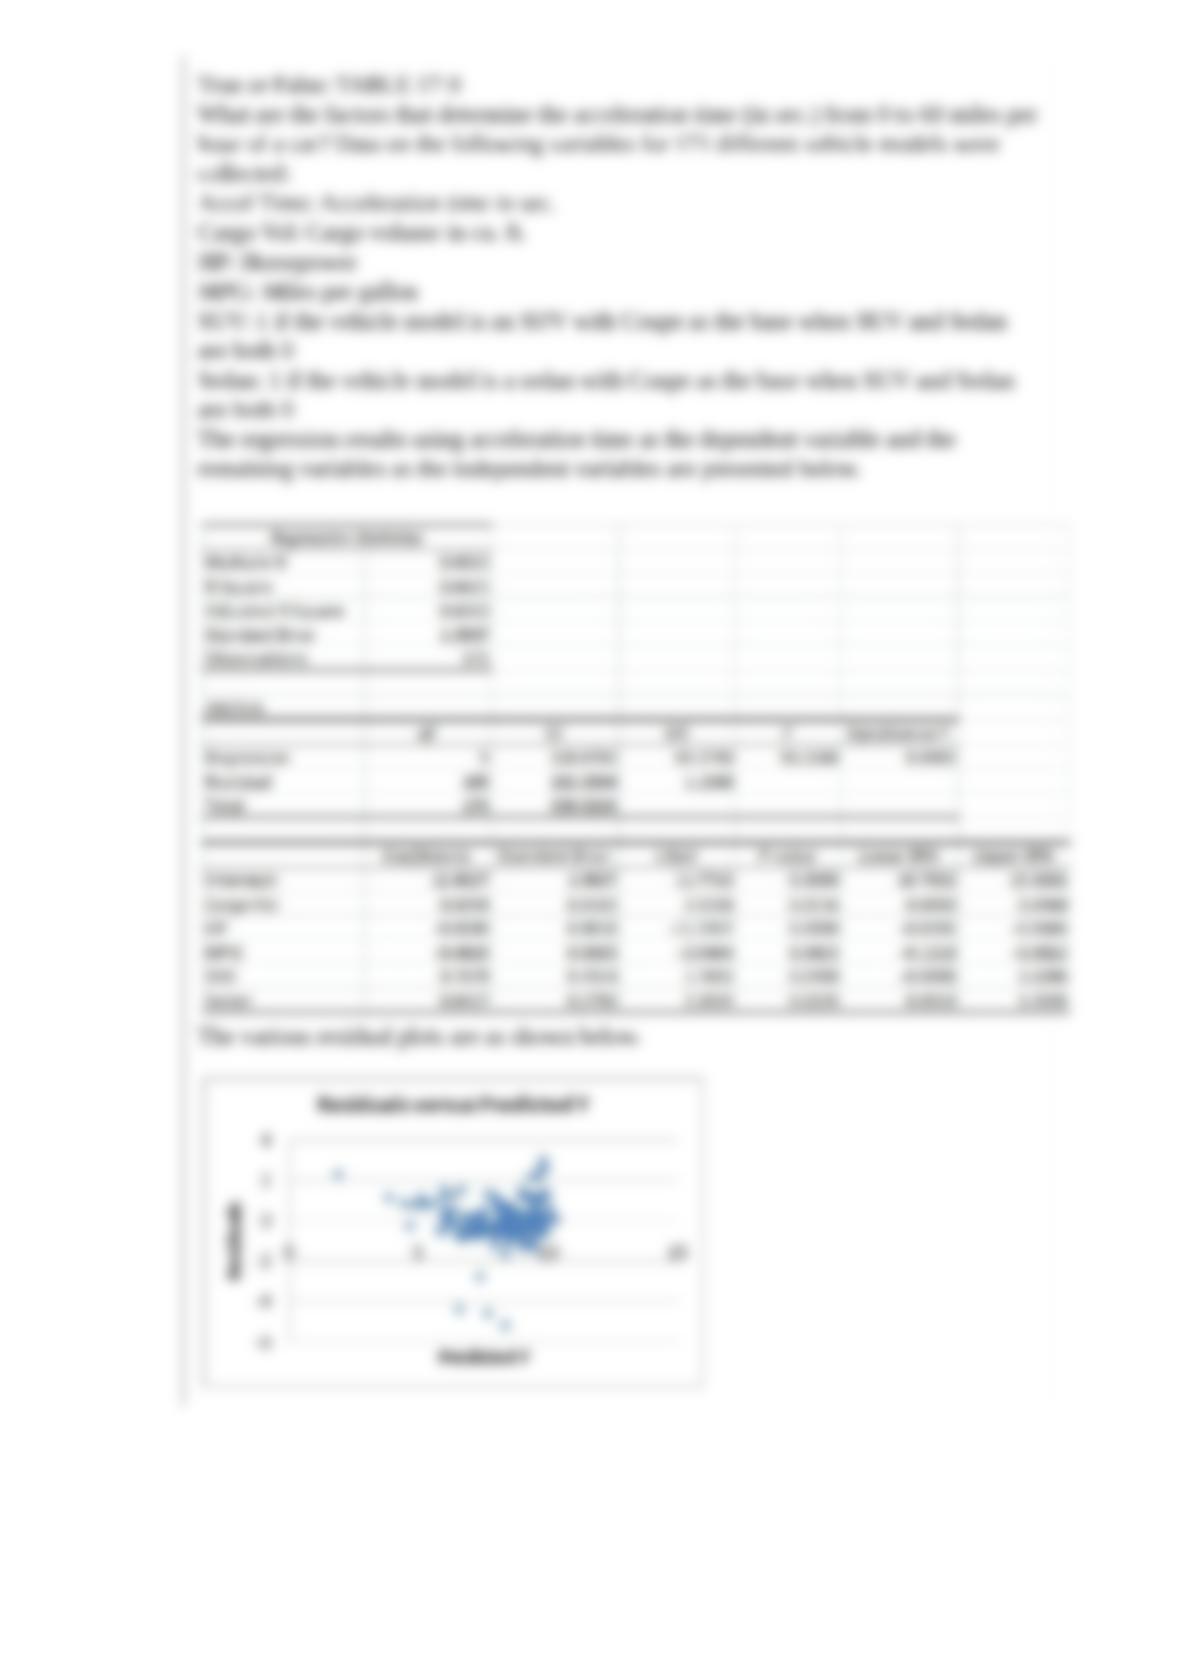
The regression results using acceleration time as the dependent variable and the
remaining variables as the independent variables are presented below.
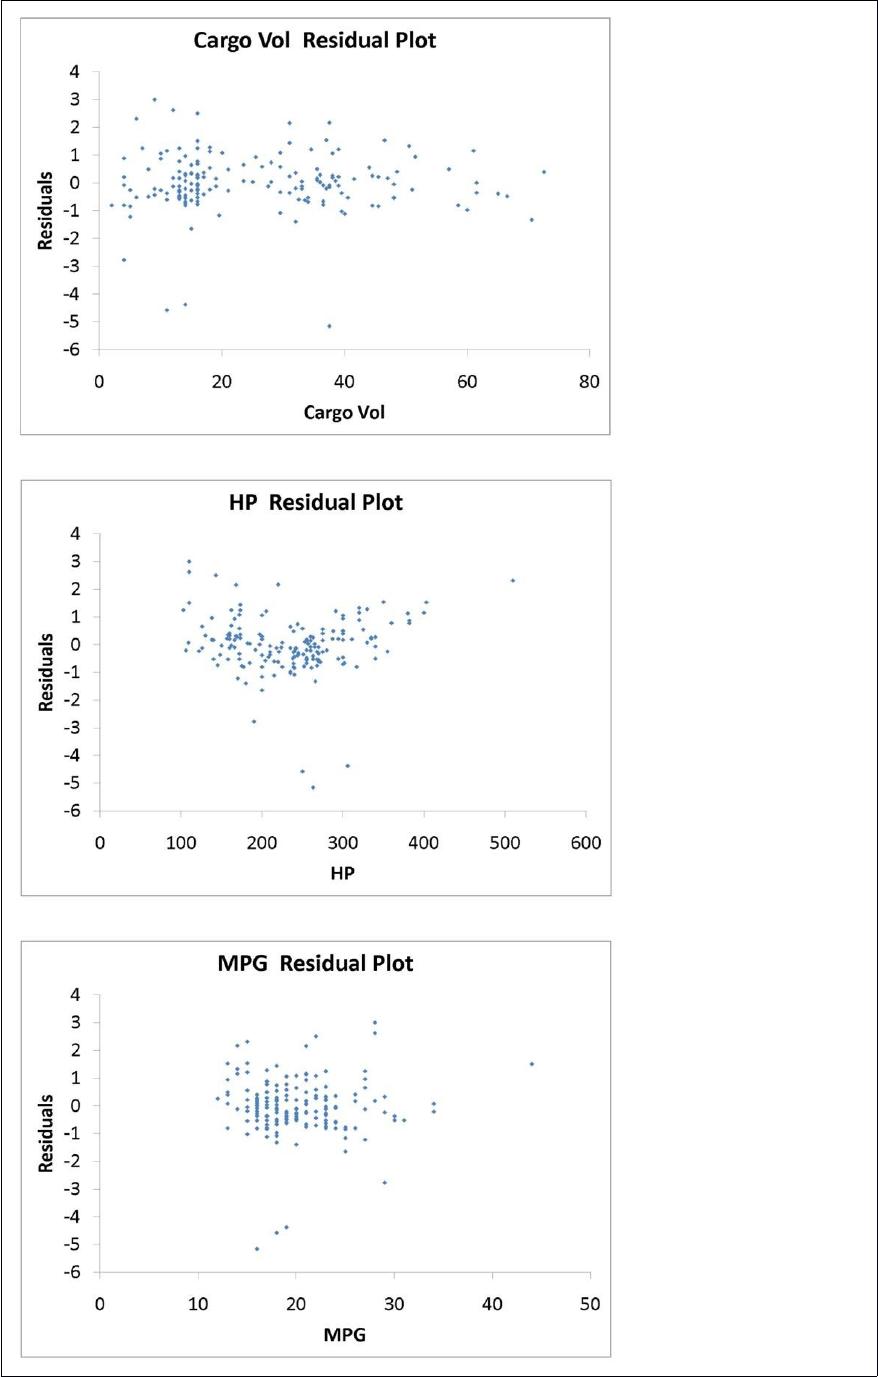
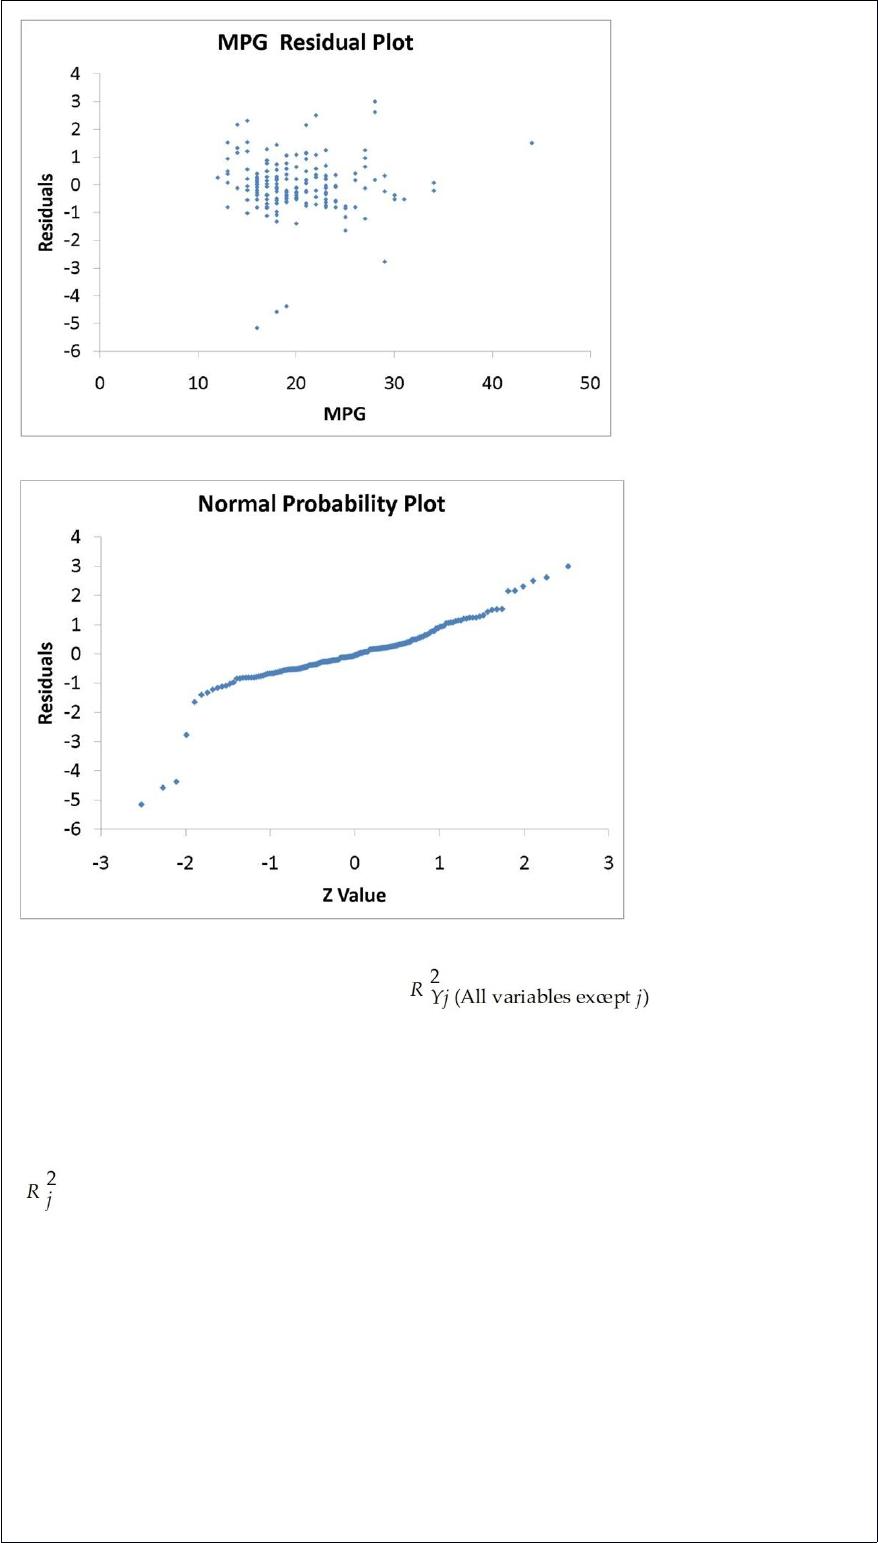
The various residual plots are as shown below.
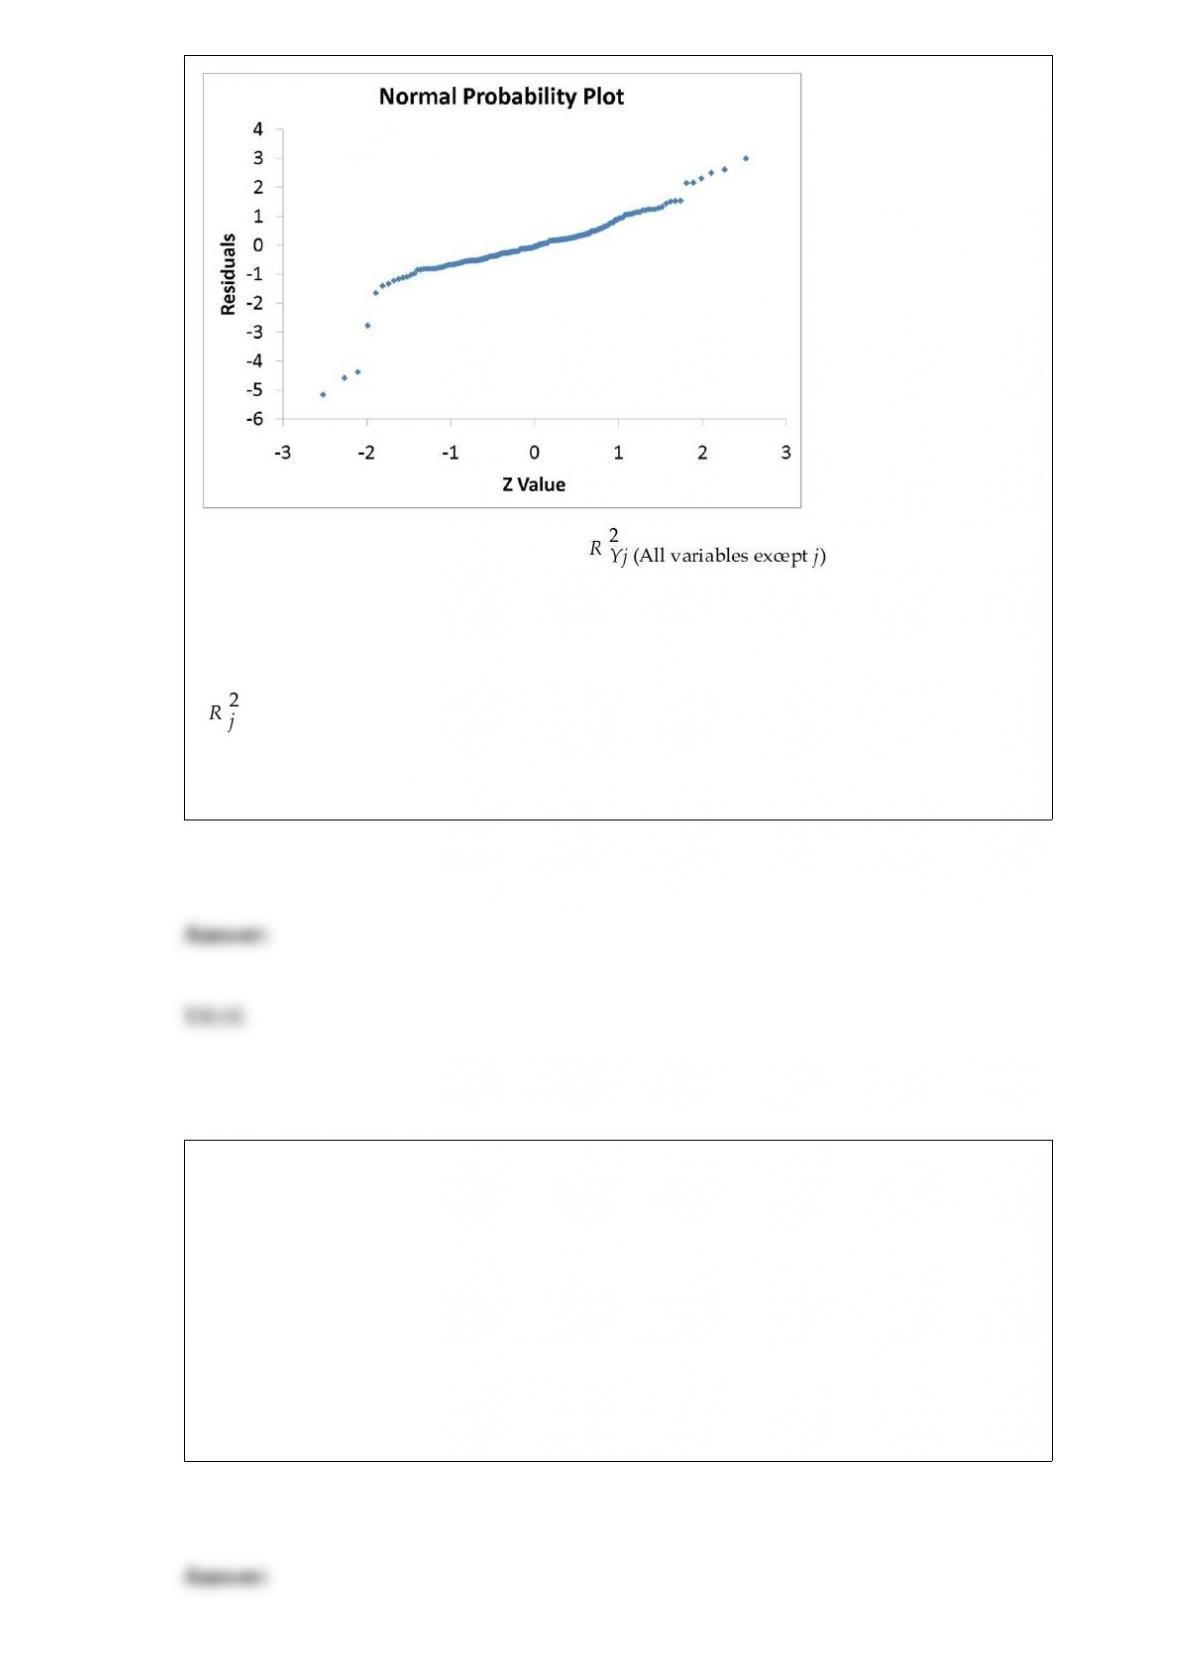
The coefficient of partial determination ( ) of each of the 5
predictors are, respectively, 0.0380, 0.4376, 0.0248, 0.0188, and 0.0312.
The coefficient of multiple determination for the regression model using each of the 5
variables Xj as the dependent variable and all other X variables as independent variables
( ) are, respectively, 0.7461, 0.5676, 0.6764, 0.8582, 0.6632.
Referring to Table 17-9, the 0 to 60 miles per hour acceleration time of a coupe is
predicted to be 0.6427 seconds lower than that of a sedan.
TABLE 8-16
The president of a university is concerned that the percentage of students who have
cheated on an exam is higher than the 1% acceptable level. A confidential random
sample of 1,000 students from a population of 7,000 revealed that 6 of them said that
they had cheated on an exam during the last semester.
True or False: Referring to Table 8-16, using the 90% one-sided confidence interval, the
president can be 95% confident that no more than 1% of the students at the university
had cheated on an exam during the last semester.
True or False: TABLE 17-8
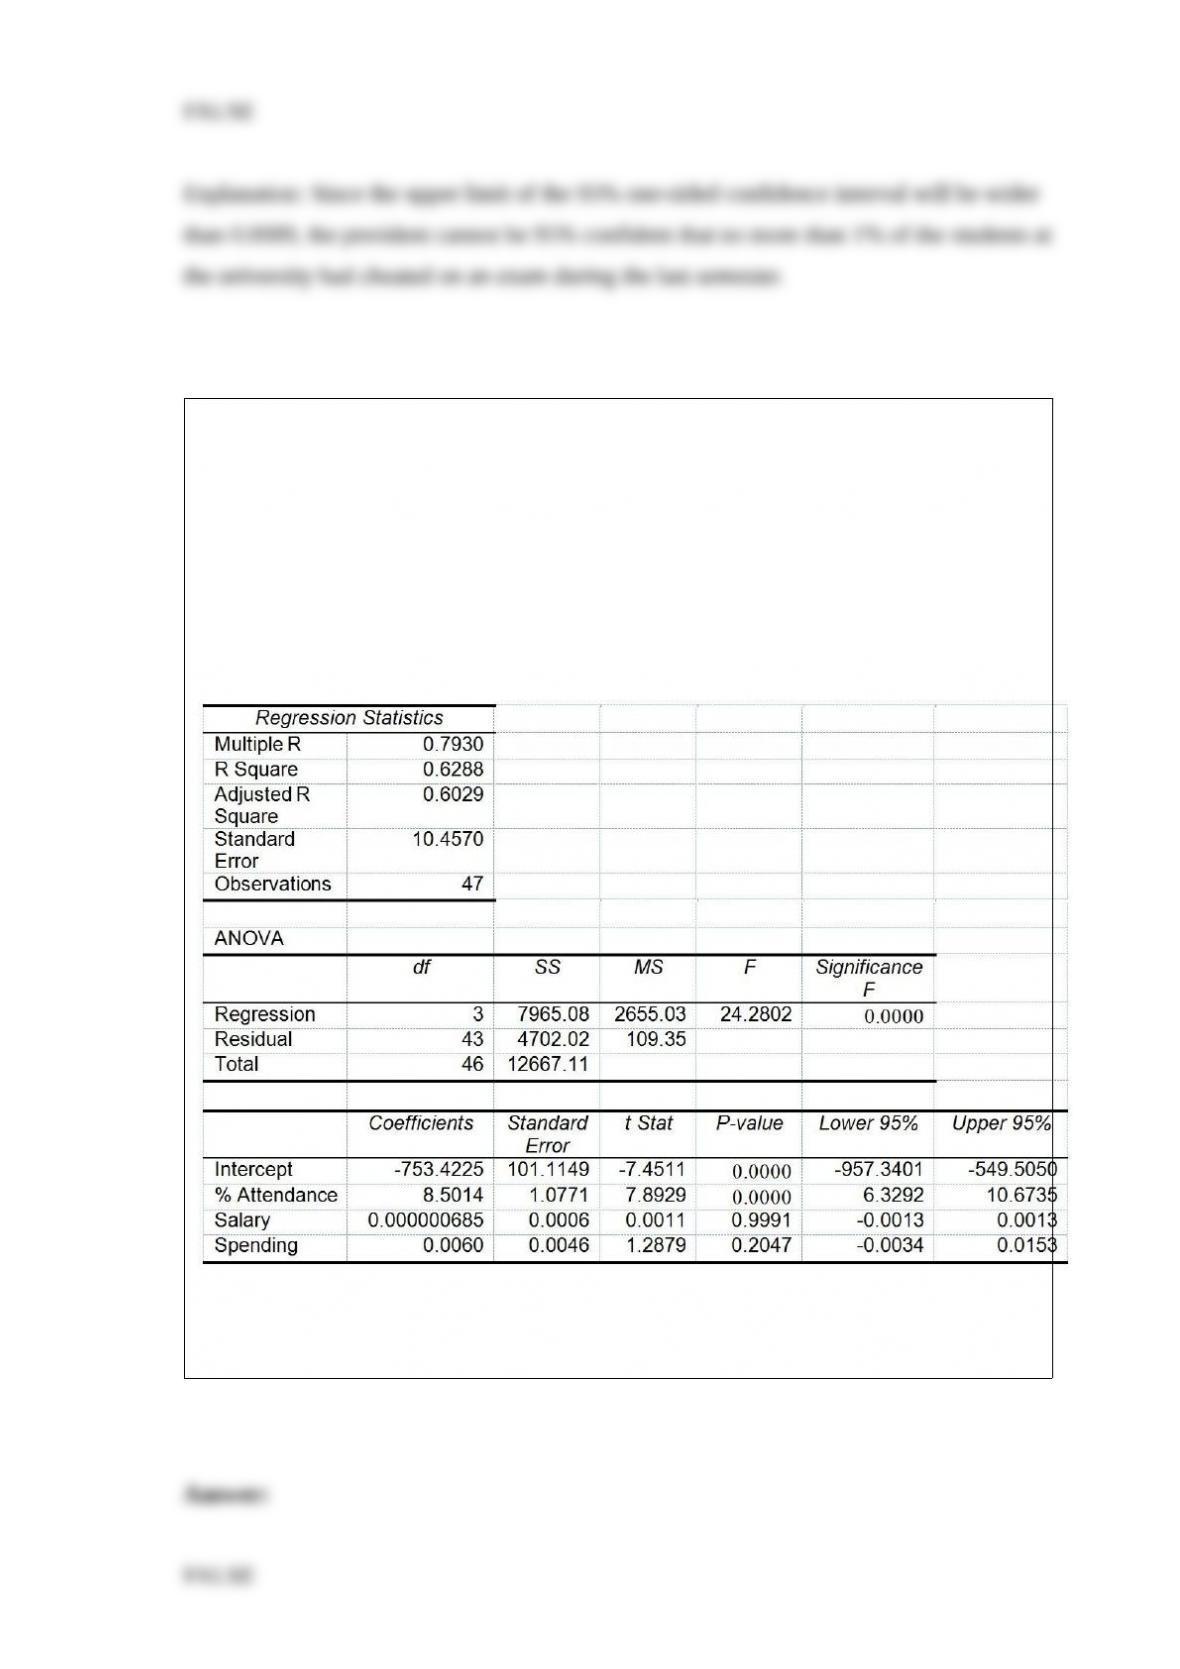
The superintendent of a school district wanted to predict the percentage of students
passing a sixth-grade proficiency test. She obtained the data on percentage of students
passing the proficiency test (% Passing), daily mean of the percentage of students
attending class (% Attendance), mean teacher salary in dollars (Salaries), and
instructional spending per pupil in dollars (Spending) of 47 schools in the state.
Following is the multiple regression output with Y = % Passing as the dependent
variable, X1 = % Attendance, X2 = Salaries and X3 = Spending:
Referring to Table 17-8, the alternative hypothesis H1 : At least one of βj ≠0 for j =
1, 2, 3 implies that the percentage of students passing the proficiency test is related to
all of the explanatory variables.
True or False: The probability that a standard normal variable, Z, falls between -2.00
and -0.44 is 0.6472.
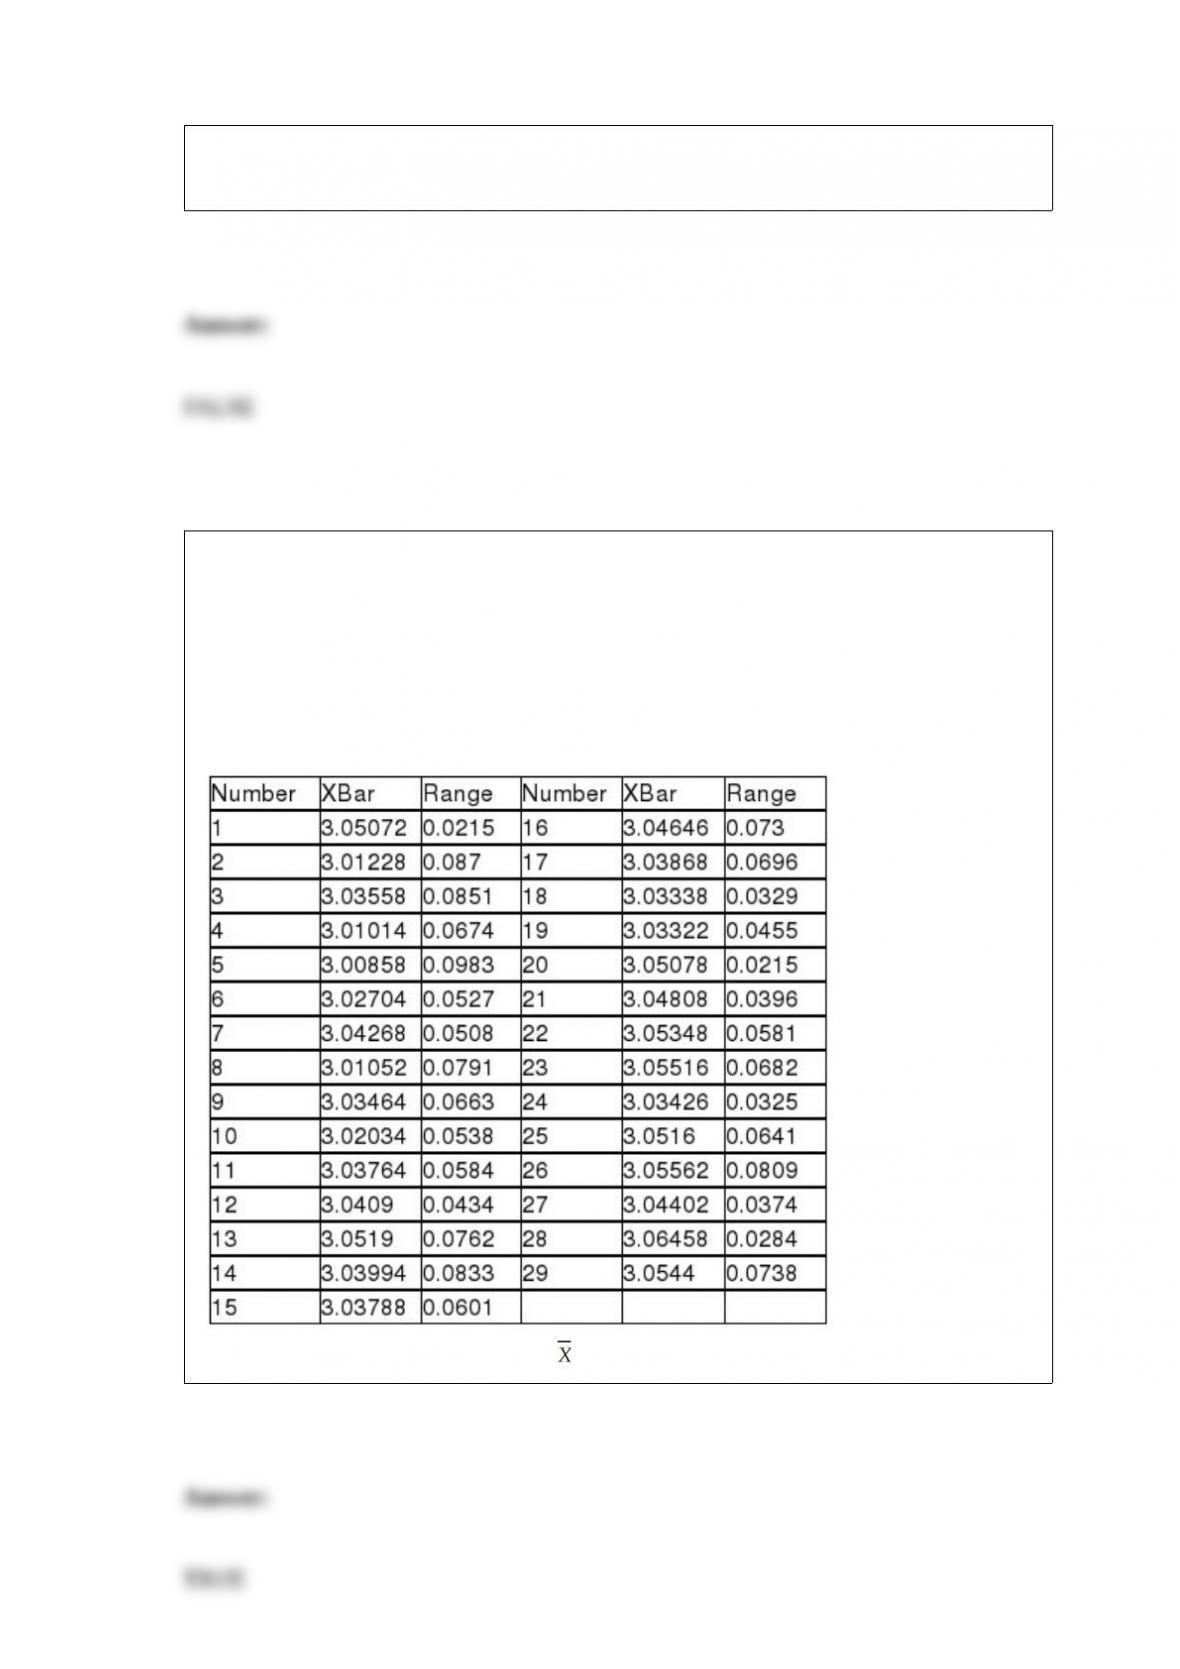
True or False: TABLE 18-9
The manufacturer of canned food constructed control charts and analyzed several
quality characteristics. One characteristic of interest is the weight of the filled cans. The
lower specification limit for weight is 2.95 pounds. The table below provides the range
and mean of the weights of five cans tested every fifteen minutes during a day’s
production.
Referring to Table 18-9, based on the chart, it appears that the process is in control.
In a local cellular phone area, company A accounts for 60% of the cellular phone
market, while company B accounts for the remaining 40% of the market. Of the cellular
calls made with company A, 1% of the calls will have some sort of interference, while
2% of the cellular calls with company B will have interference. If a cellular call is
selected at random, the probability that it will have interference is
A) 0.014.
B) 0.028.
C) 0.14.
D) 0.986.
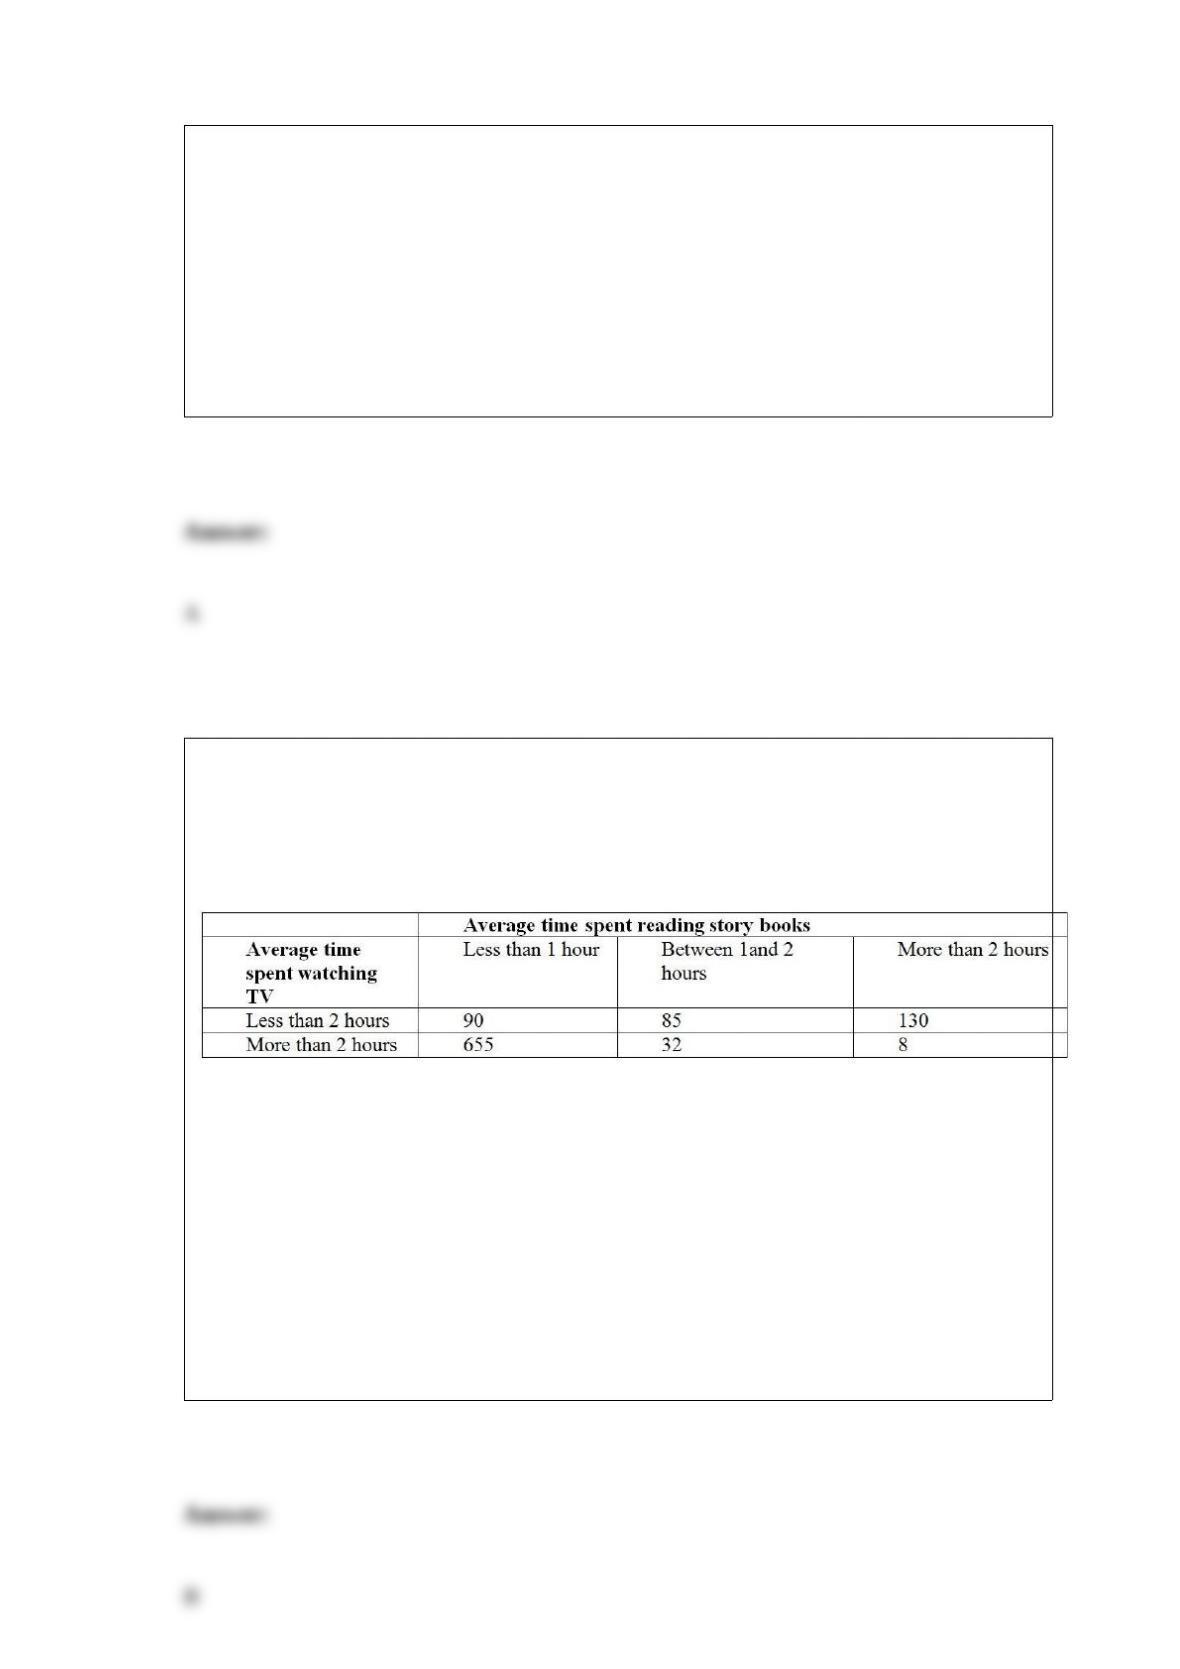
TABLE 12-12
Parents complain that children read too few storybooks and watch too much television
nowadays. A survey of 1,000 children reveals the following information on average
time spent watching TV and average time spent reading storybooks.
Referring to Table 12-12, how many children in the survey spent less than 2 hours
watching TV and more than 2 hours reading story books on average?
A) 8
B) 130
C) 175
D) 687
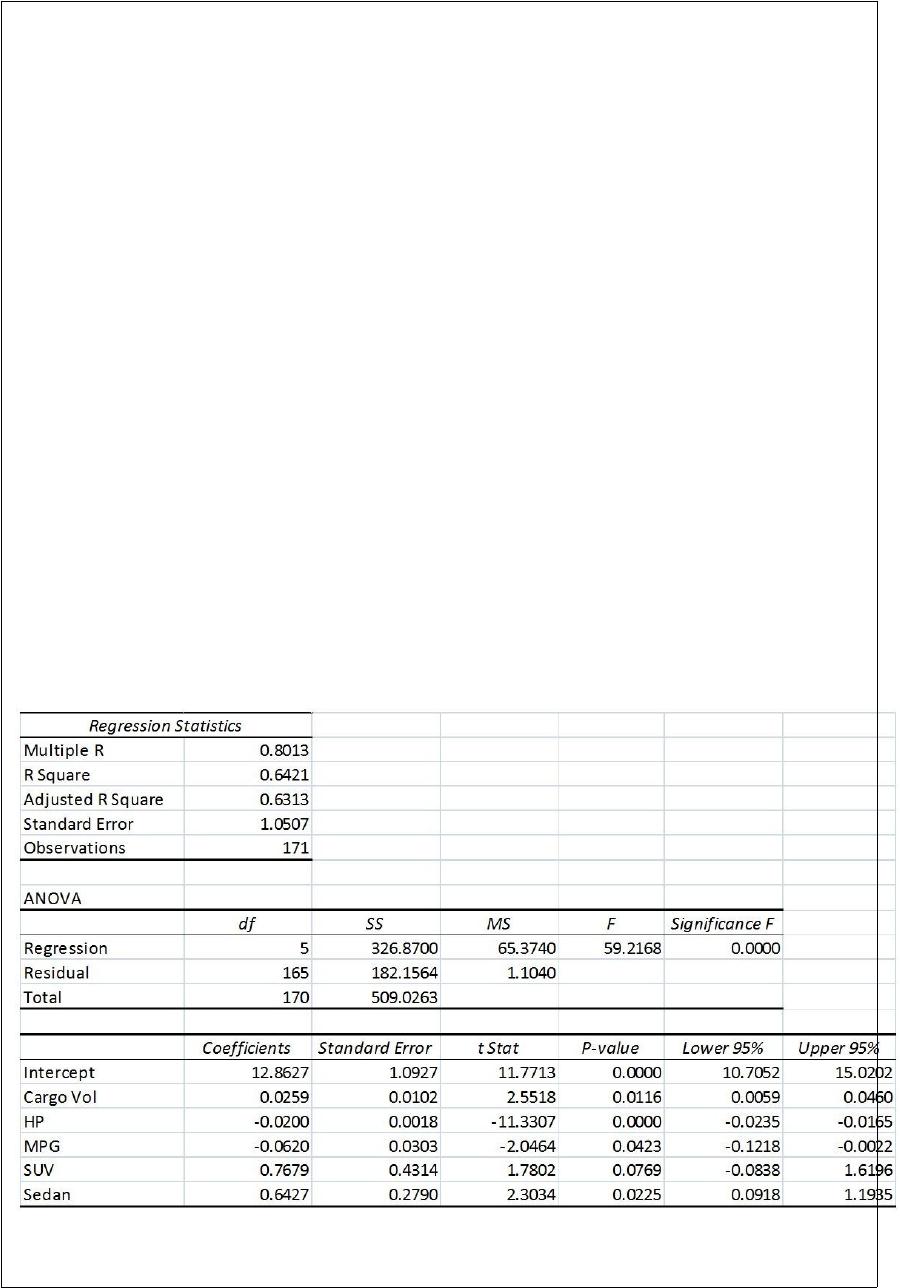
TABLE 17-9
What are the factors that determine the acceleration time (in sec.) from 0 to 60 miles per
hour of a car? Data on the following variables for 171 different vehicle models were
collected:
Accel Time: Acceleration time in sec.
Cargo Vol: Cargo volume in cu. ft.
HP: Horsepower
MPG: Miles per gallon
SUV: 1 if the vehicle model is an SUV with Coupe as the base when SUV and Sedan
are both 0
Sedan: 1 if the vehicle model is a sedan with Coupe as the base when SUV and Sedan
are both 0
The regression results using acceleration time as the dependent variable and the
remaining variables as the independent variables are presented below.
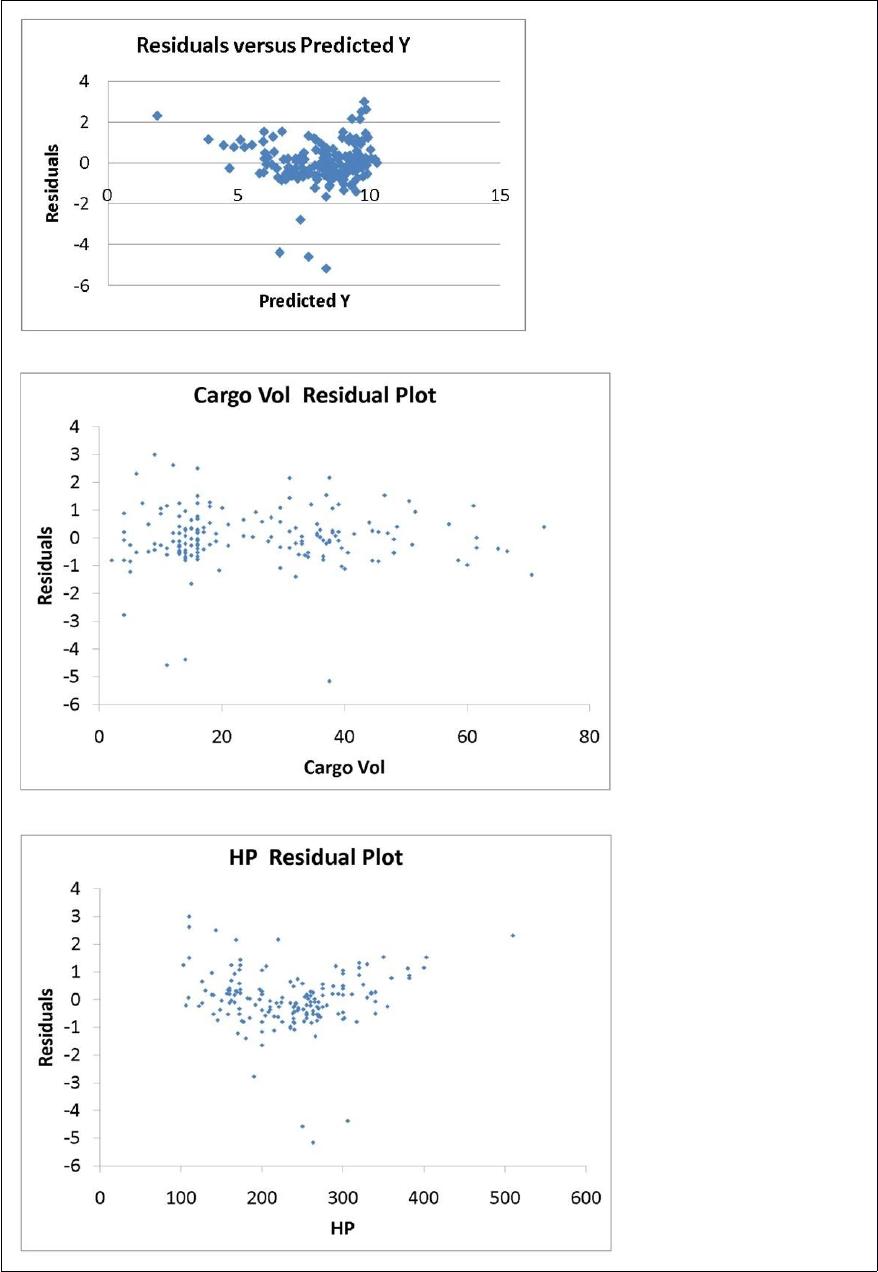
The various residual plots are as shown below.
The coefficient of partial determination ( ) of each of the 5
predictors are, respectively, 0.0380, 0.4376, 0.0248, 0.0188, and 0.0312.
The coefficient of multiple determination for the regression model using each of the 5
variables Xj as the dependent variable and all other X variables as independent variables
( ) are, respectively, 0.7461, 0.5676, 0.6764, 0.8582, 0.6632.
Referring to Table 17-9, which of the following assumptions is most likely violated
based on the normal probability plot?
A) Linearity
B) Normality of errors
C) Equal variance
D) None of the above
A catalog company that receives the majority of its orders by telephone conducted a
study to determine how long customers were willing to wait on hold before ordering a
product. The length of waiting time was found to be a variable best approximated by an
exponential distribution with a mean length of waiting time equal to 3 minutes (i.e. the
mean number of calls answered in a minute is ). What proportion of customers having
to hold more than 1.5 minutes will hang up before placing an order?
A) 0.86466
B) 0.60653
C) 0.39347
D) 0.13534
Which famous statistician developed the 14 Points of Quality?
A) Shewhart
B) Deming
C) Chebyshev
D) Taguchi
Which of the following is an assumption required by the Analysis of Means (ANOM)?
A) The variance of the groups is different.
B) The observations from each of the groups are assumed to be approximately normally
distributed.
C) The shape of the distribution of the observations from the groups is different.
D) The number of observations in each group has to be at least 30.
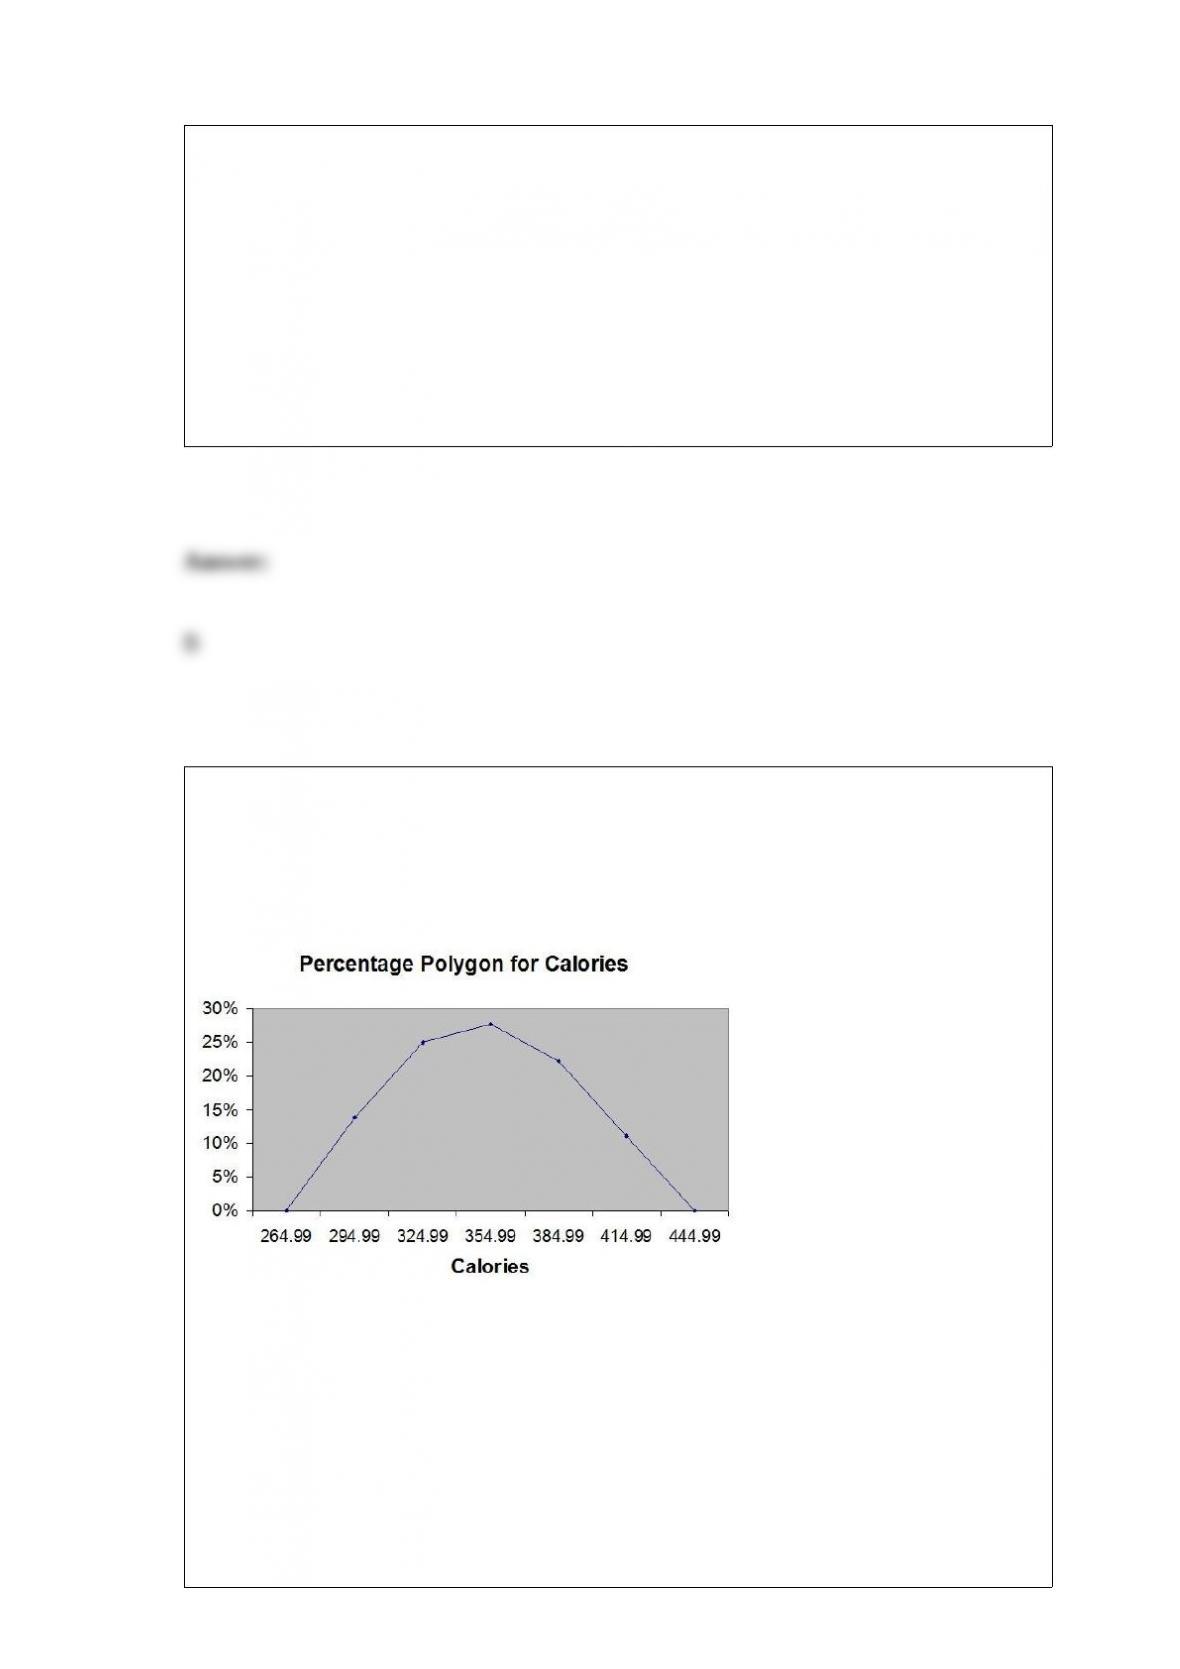
TABLE 2-16
The figure below is the percentage polygon for the amount of calories for a sample of
36 pizza products where the upper limits of the intervals are: 310, 340, 370, 400 and
430.
Referring to Table 2-16, roughly what percentage of pizza products contains between
400 and 430 calories?
A) 0%
B) 11%
C) 89%
D) 100%
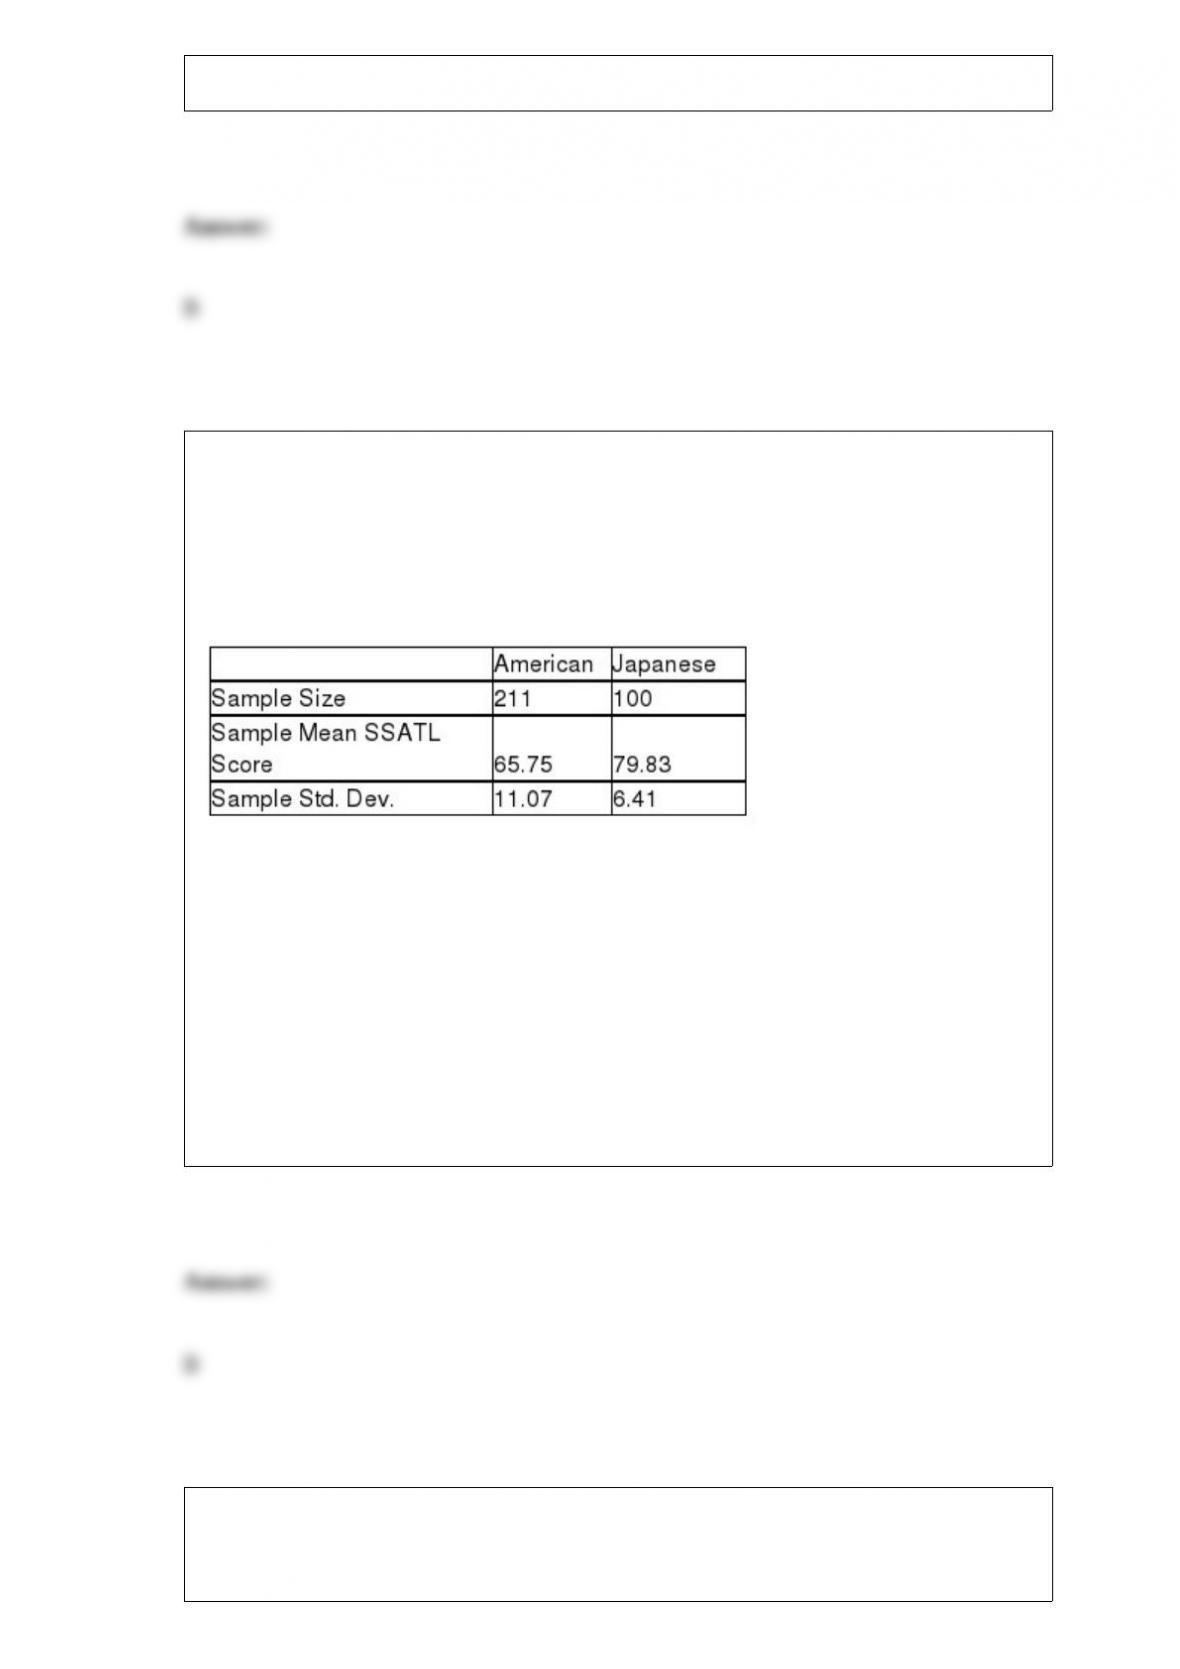
TABLE 10-1
Are Japanese managers more motivated than American managers? A randomly selected
group of each were administered the Sarnoff Survey of Attitudes Toward Life (SSATL),
which measures motivation for upward mobility. The SSATL scores are summarized
below.
Referring to Table 10-1, judging from the way the data were collected, which test would
likely be most appropriate to employ?
A) Paired t test
B) Pooled-variance t test for the difference between two means
C) F test for the ratio of two variances
D) Z test for the difference between two proportions
The Central Limit Theorem is important in statistics because
A) for a large n, it says the population is approximately normal.

B) for any population, it says the sampling distribution of the sample mean is
approximately normal, regardless of the sample size.
C) for a large n, it says the sampling distribution of the sample mean is approximately
normal, regardless of the shape of the population.
D) for any sized sample, it says the sampling distribution of the sample mean is
approximately normal.
Whenever = 0.5, the binomial distribution will
A) always be symmetric.
B) be symmetric only if n is large.
C) be right-skewed.
D) be left-skewed.
TABLE 1-1
The manager of the customer service division of a major consumer electronics company
is interested in determining whether the customers who have purchased a Blu-ray
player made by the company over the past 12 months are satisfied with their products.
Referring to Table 1-1, the possible responses to the question “How much time do you
use the Blu-ray player every week on the average?” are values from a
A) discrete numerical variable.
B) continuous numerical variable.
C) categorical variable.
D) table of random numbers.
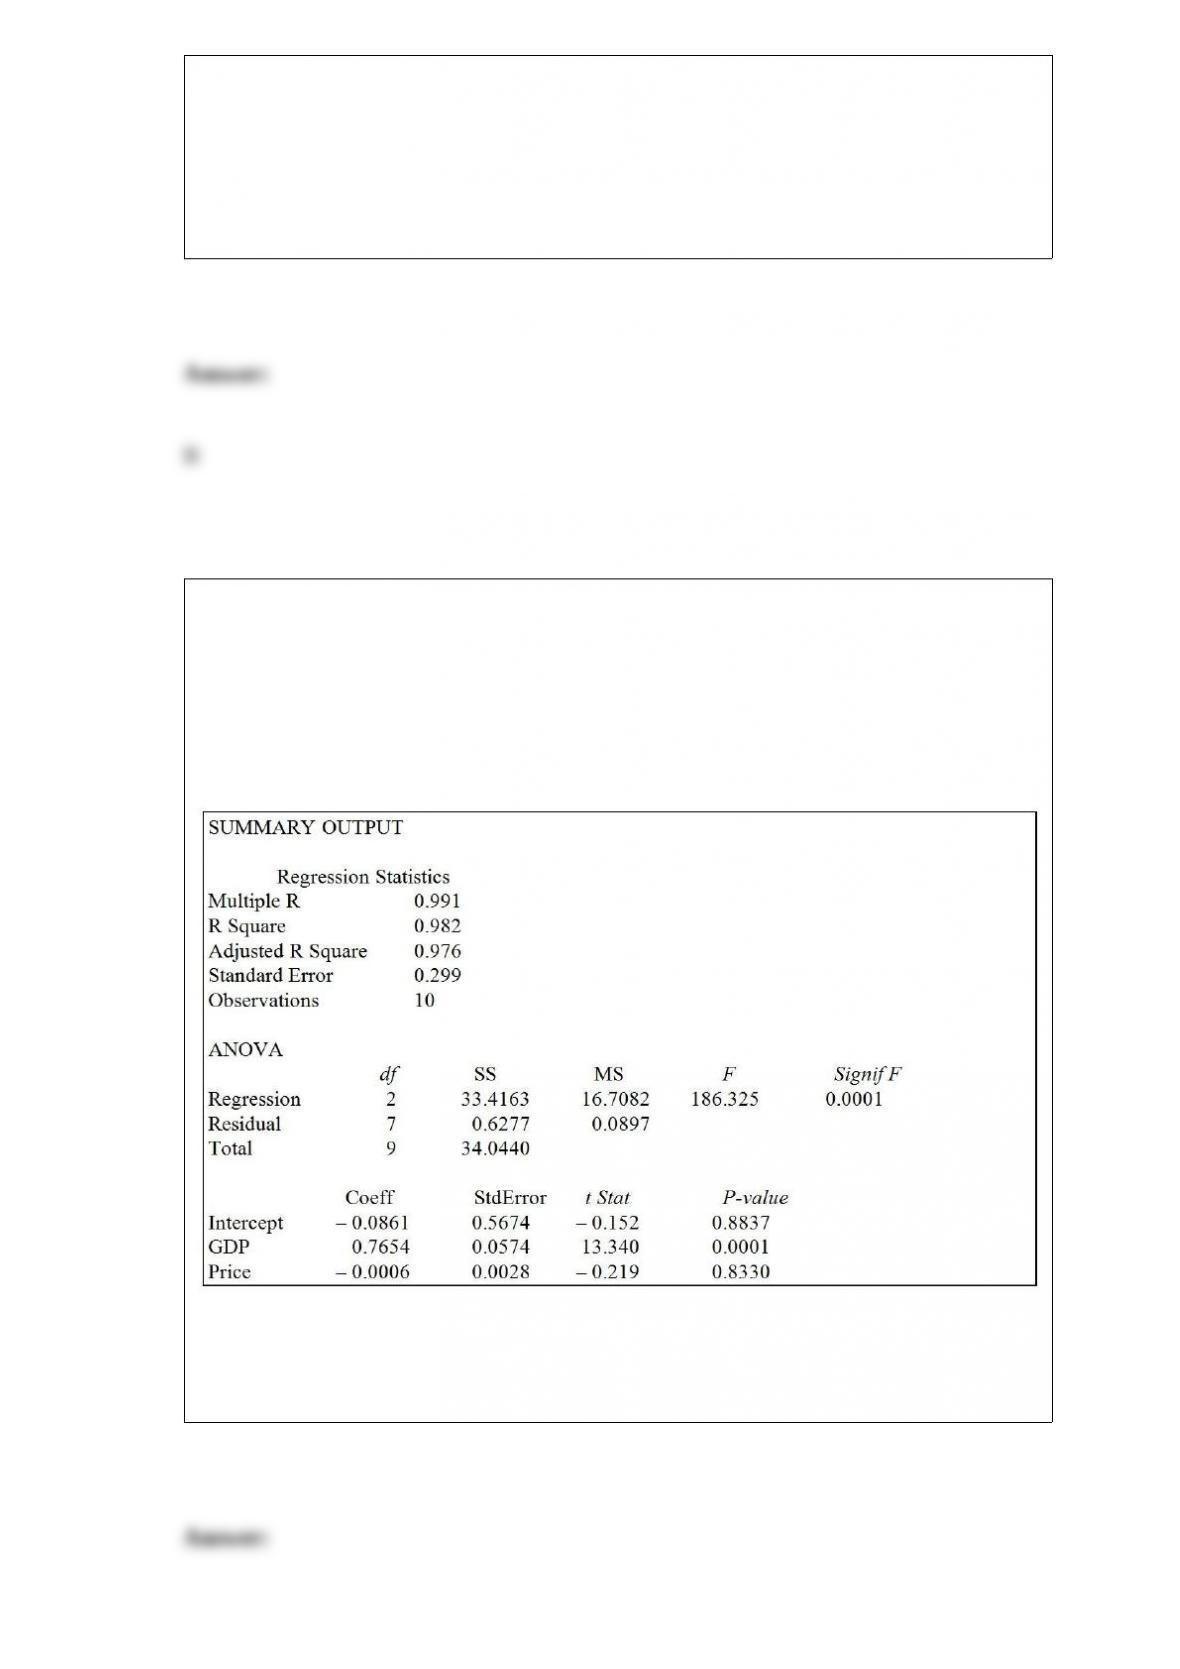
Referring to Table 14-3, to test for the significance of the coefficient on aggregate price
index, the value of the relevant t-statistic is
TABLE 14-3
An economist is interested to see how consumption for an economy (in $ billions) is
influenced by gross domestic product ($ billions) and aggregate price (consumer price
index). The Microsoft Excel output of this regression is partially reproduced below.
A) 2.365.
B) 0.143.
C) -0.219.
D) -1.960.
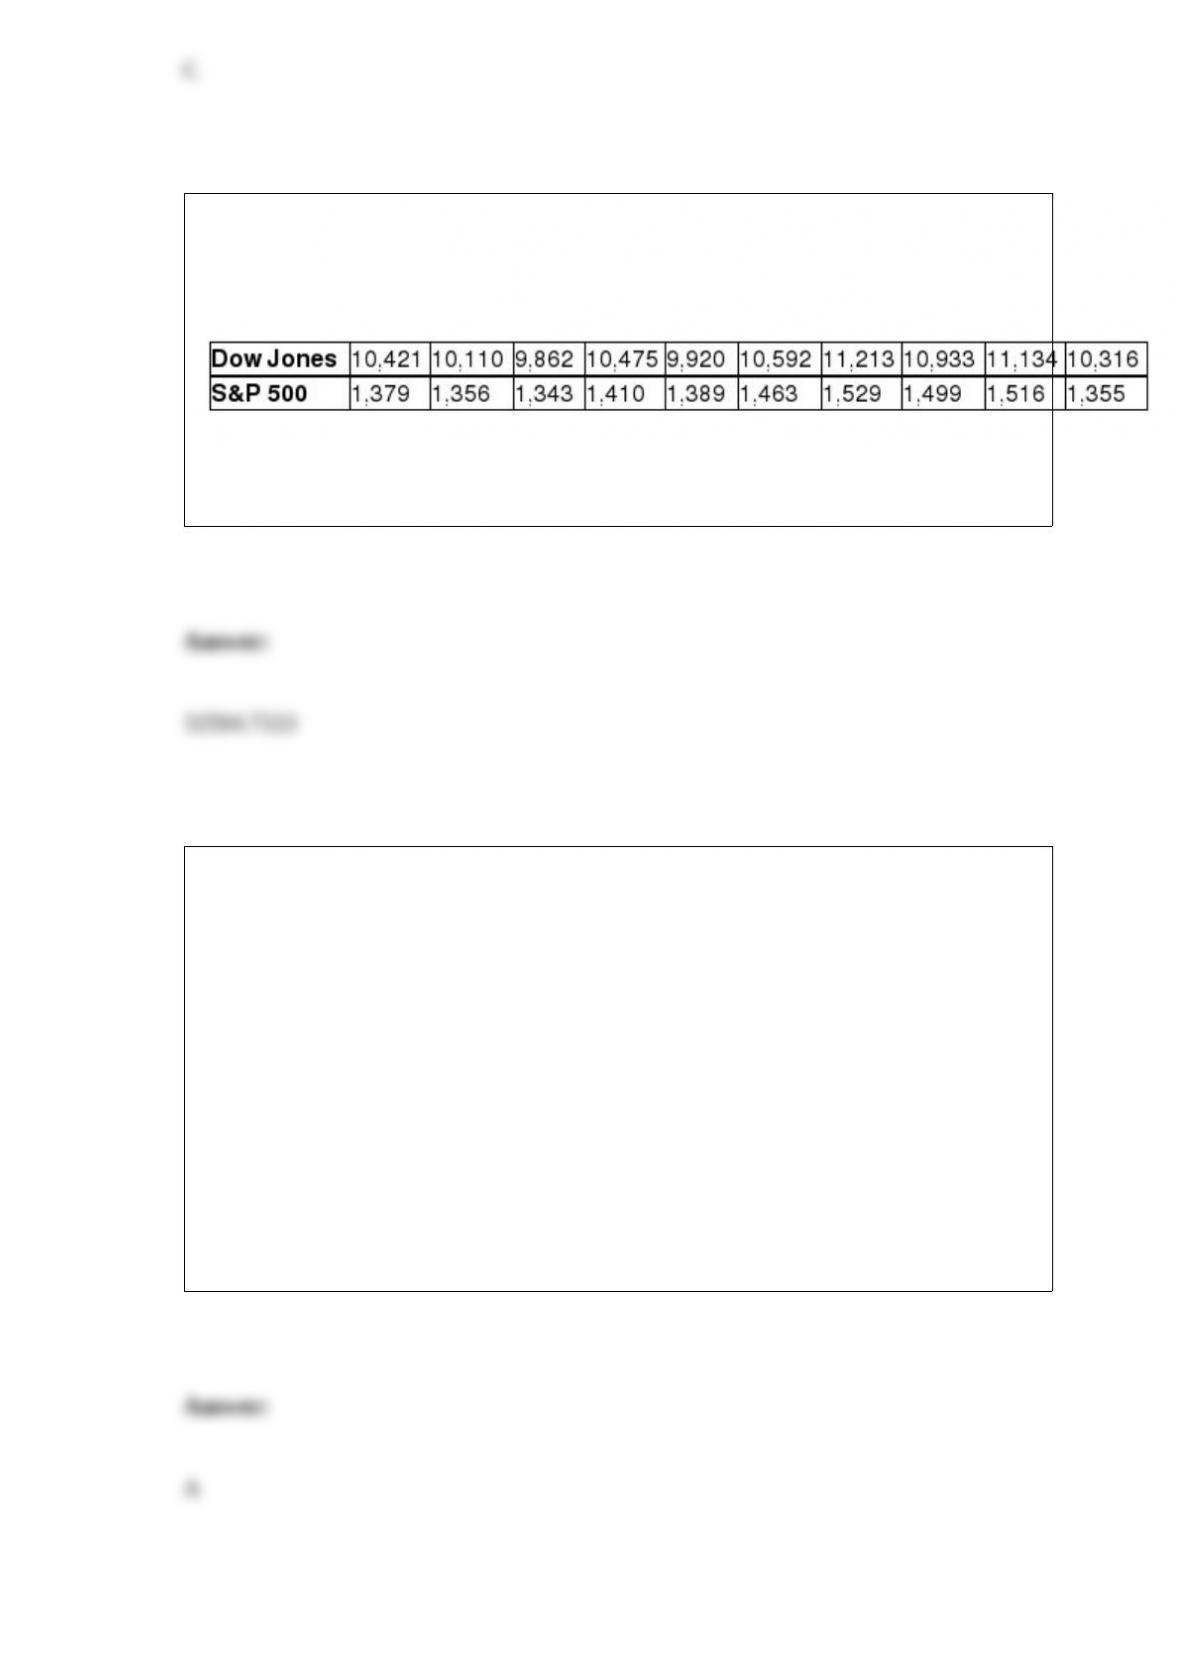
TABLE 3-11
Given below are the closing prices for the Dow Jones Industrial Average (DJIA) and the
Standard & Poor’s (S&P) 500 Index over 10 weeks.
Referring to Table 3-11, what is the sample covariance between the DJIA and the S&P
500 index?
TABLE 17-4
You decide to predict gasoline prices in different cities and towns in the United States
for your term project. Your dependent variable is price of gasoline per gallon and your
explanatory variables are per capita income, the number of firms that manufacture
automobile parts in and around the city, the number of new business starts in the last
year, population density of the city, percentage of local taxes on gasoline, and the
number of people using public transportation. You collected data of 32 cities and
obtained a regression sum of squares SSR= 122.8821. Your computed value of standard
error of the estimate is 1.9549.
Referring to Table 17-4, the value of adjusted r2 is
A) 0.4576.
B) 0.5626.
C) 0.6472.
D) 95.5414.
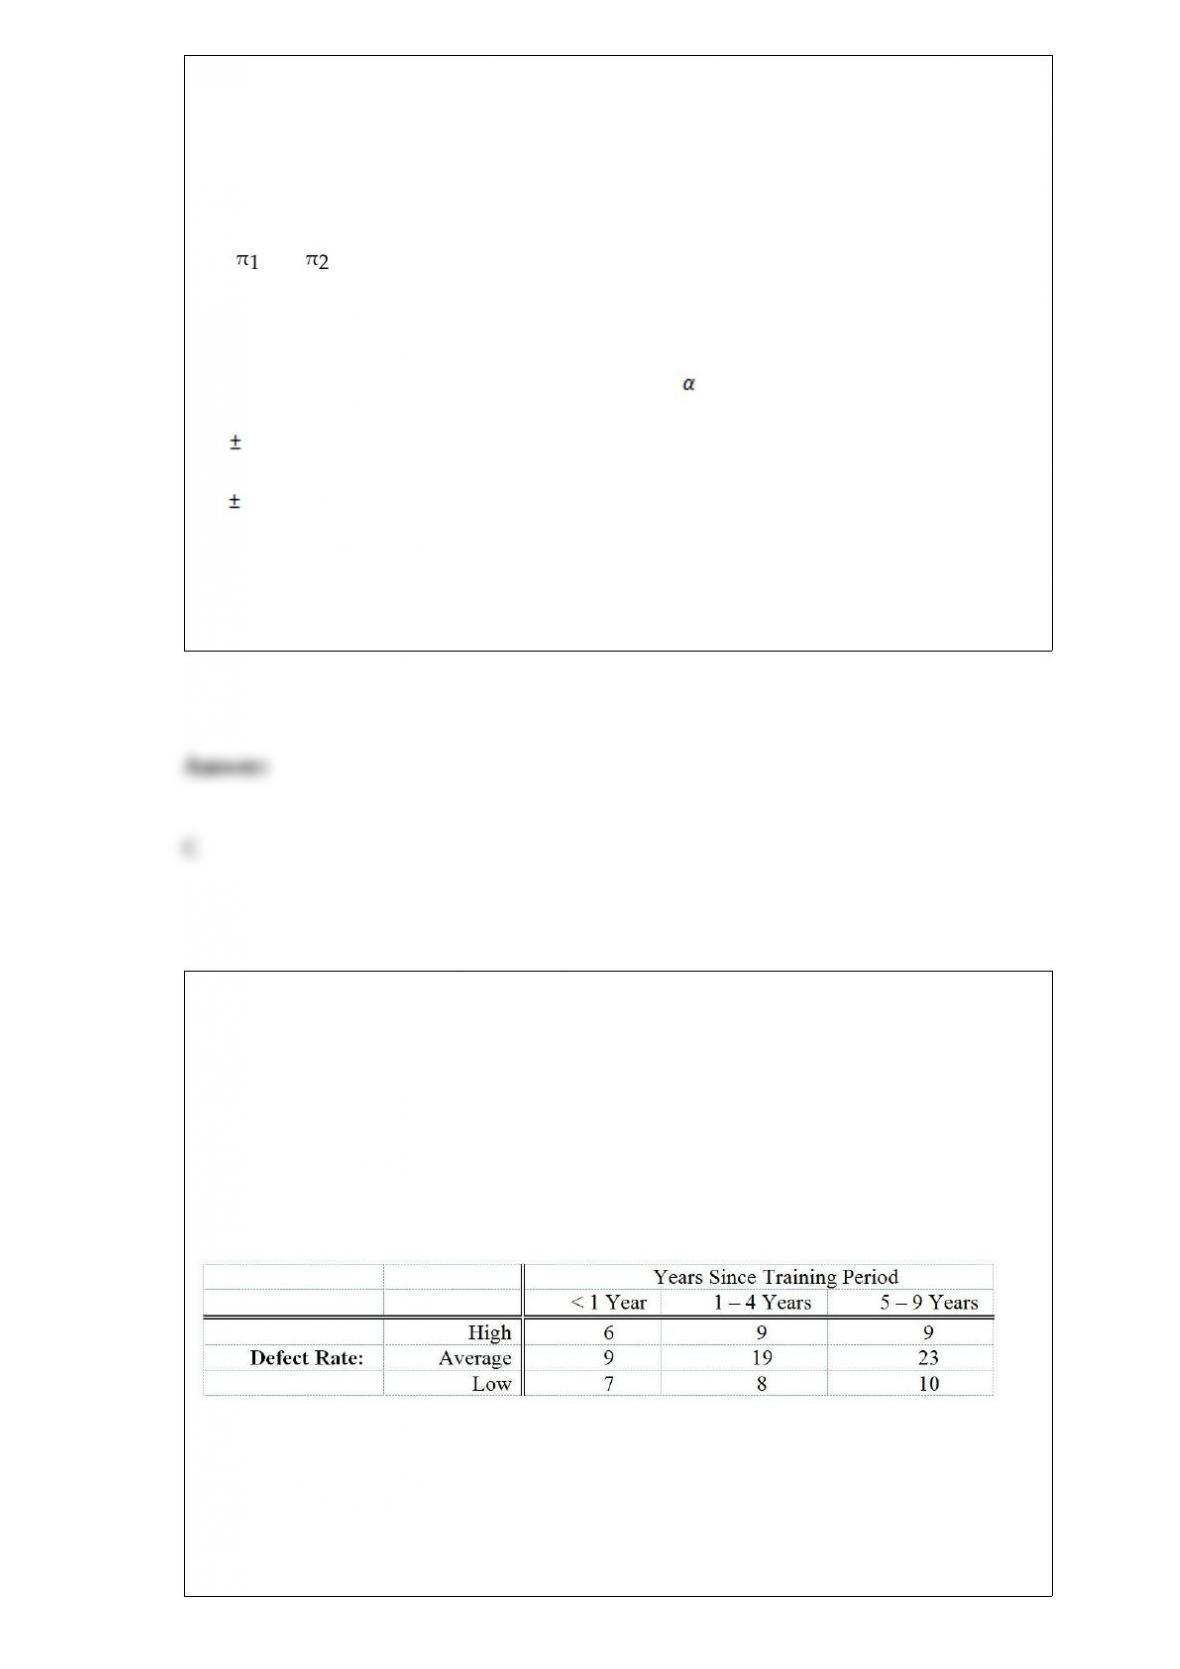
TABLE 12-1
A corporation randomly selects 150 salespeople and finds that 66% who have never
taken a self-improvement course would like such a course. The firm did a similar study
10 years ago in which 60% of a random sample of 160 salespeople wanted a
self-improvement course. The groups are assumed to be independent random samples.
Let and represent the true proportion of workers who would like to attend a
self-improvement course in the recent study and the past study, respectively.
Referring to Table 12-1, what is the critical value when performing a chi-square test on
whether the population proportions are different if = 0.05?
A) 1.645
B) 1.96
C) 3.841
D) 2.706
TABLE 12-10
One criterion used to evaluate employees in the assembly section of a large factory is
the number of defective pieces per 1,000 parts produced. The quality control
department wants to find out whether there is a relationship between years of
experience and defect rate. Since the job is repetitious, after the initial training period
any improvement due to a learning effect might be offset by a loss of motivation. A
defect rate is calculated for each worker in a yearly evaluation. The results for 100
workers are given in the table below.
Referring to Table 12-10, which test would be used to properly analyze the data in this
experiment to determine whether there is a relationship between defect rate and years of
experience?
A) X2 test for independence
B) X2 test for differences among more than two proportions
C) Wilcoxon rank sum test for independent populations
D) Kruskal-Wallis rank test
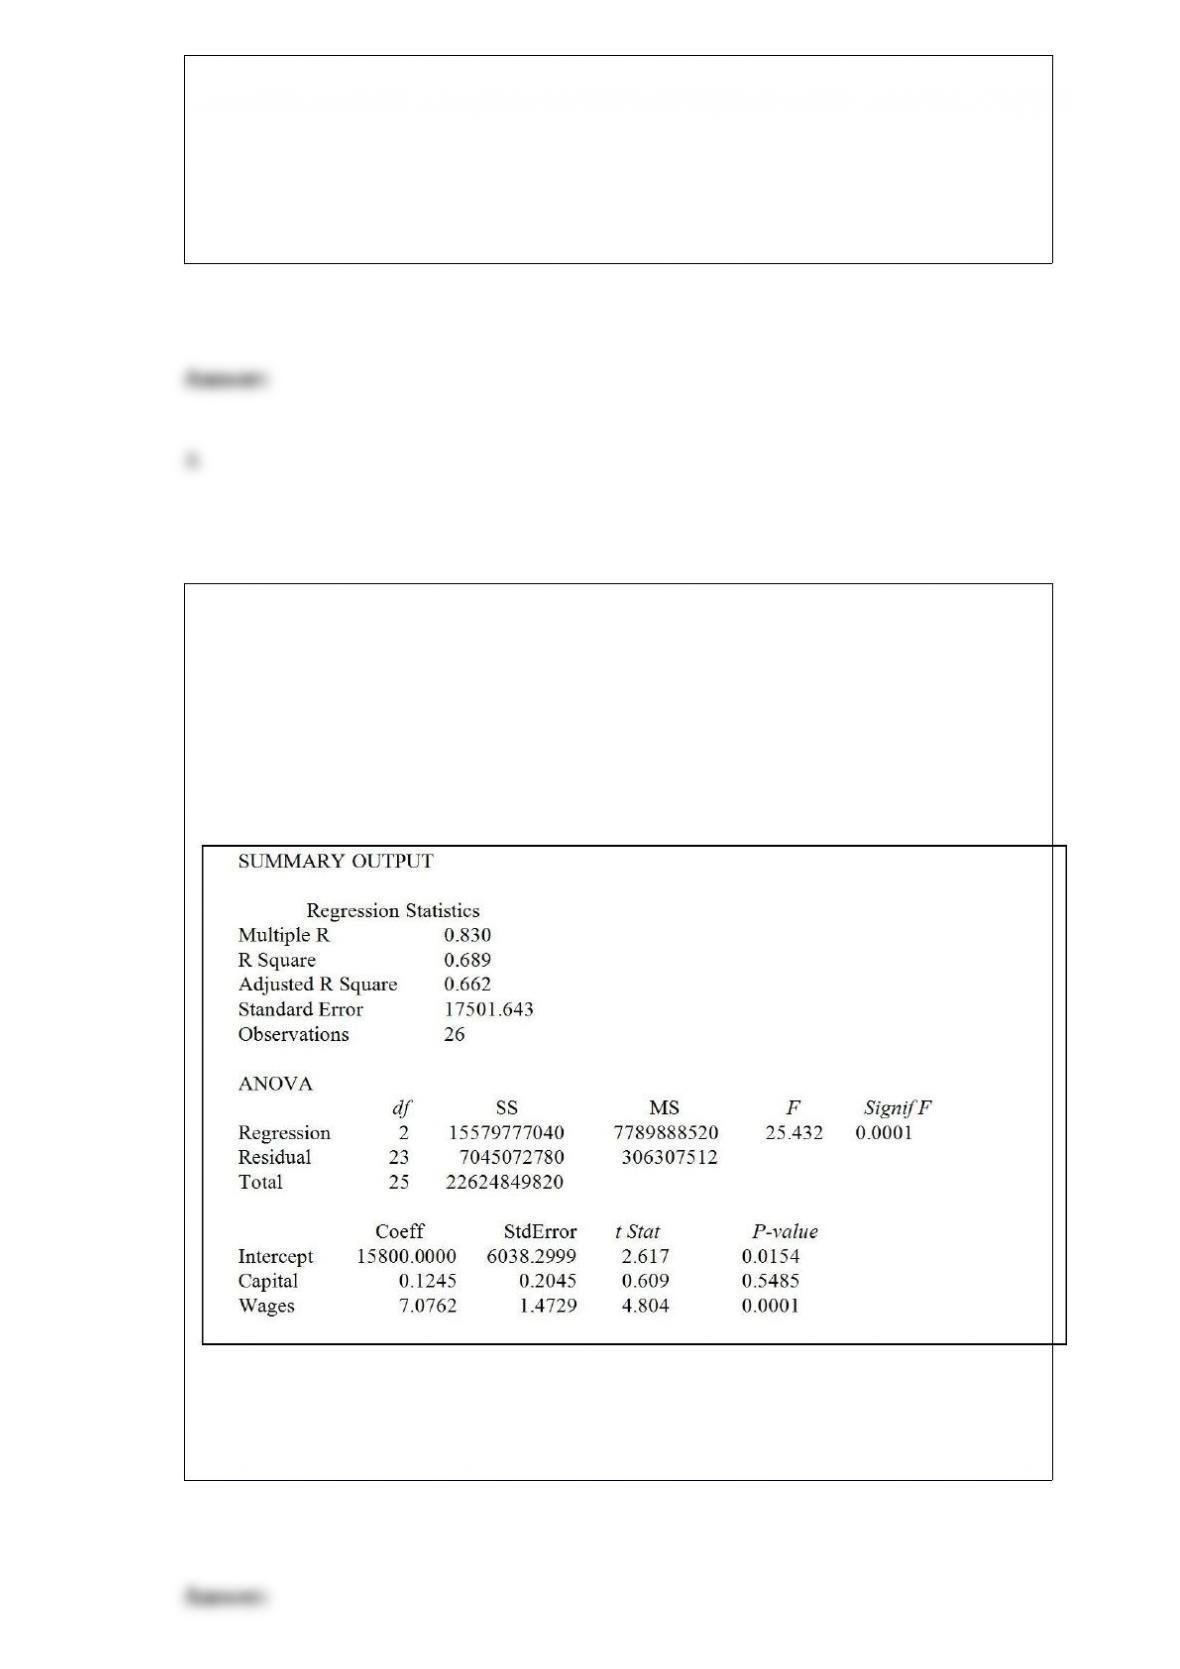
Referring to Table 14-5, what is the p-value for testing whether Capital has a negative
influence on corporate sales?
TABLE 14-5
A microeconomist wants to determine how corporate sales are influenced by capital and
wage spending by companies. She proceeds to randomly select 26 large corporations
and record information in millions of dollars. The Microsoft Excel output below shows
results of this multiple regression.
A) 0.05
B) 0.2743
C) 0.5485
D) 0.7258
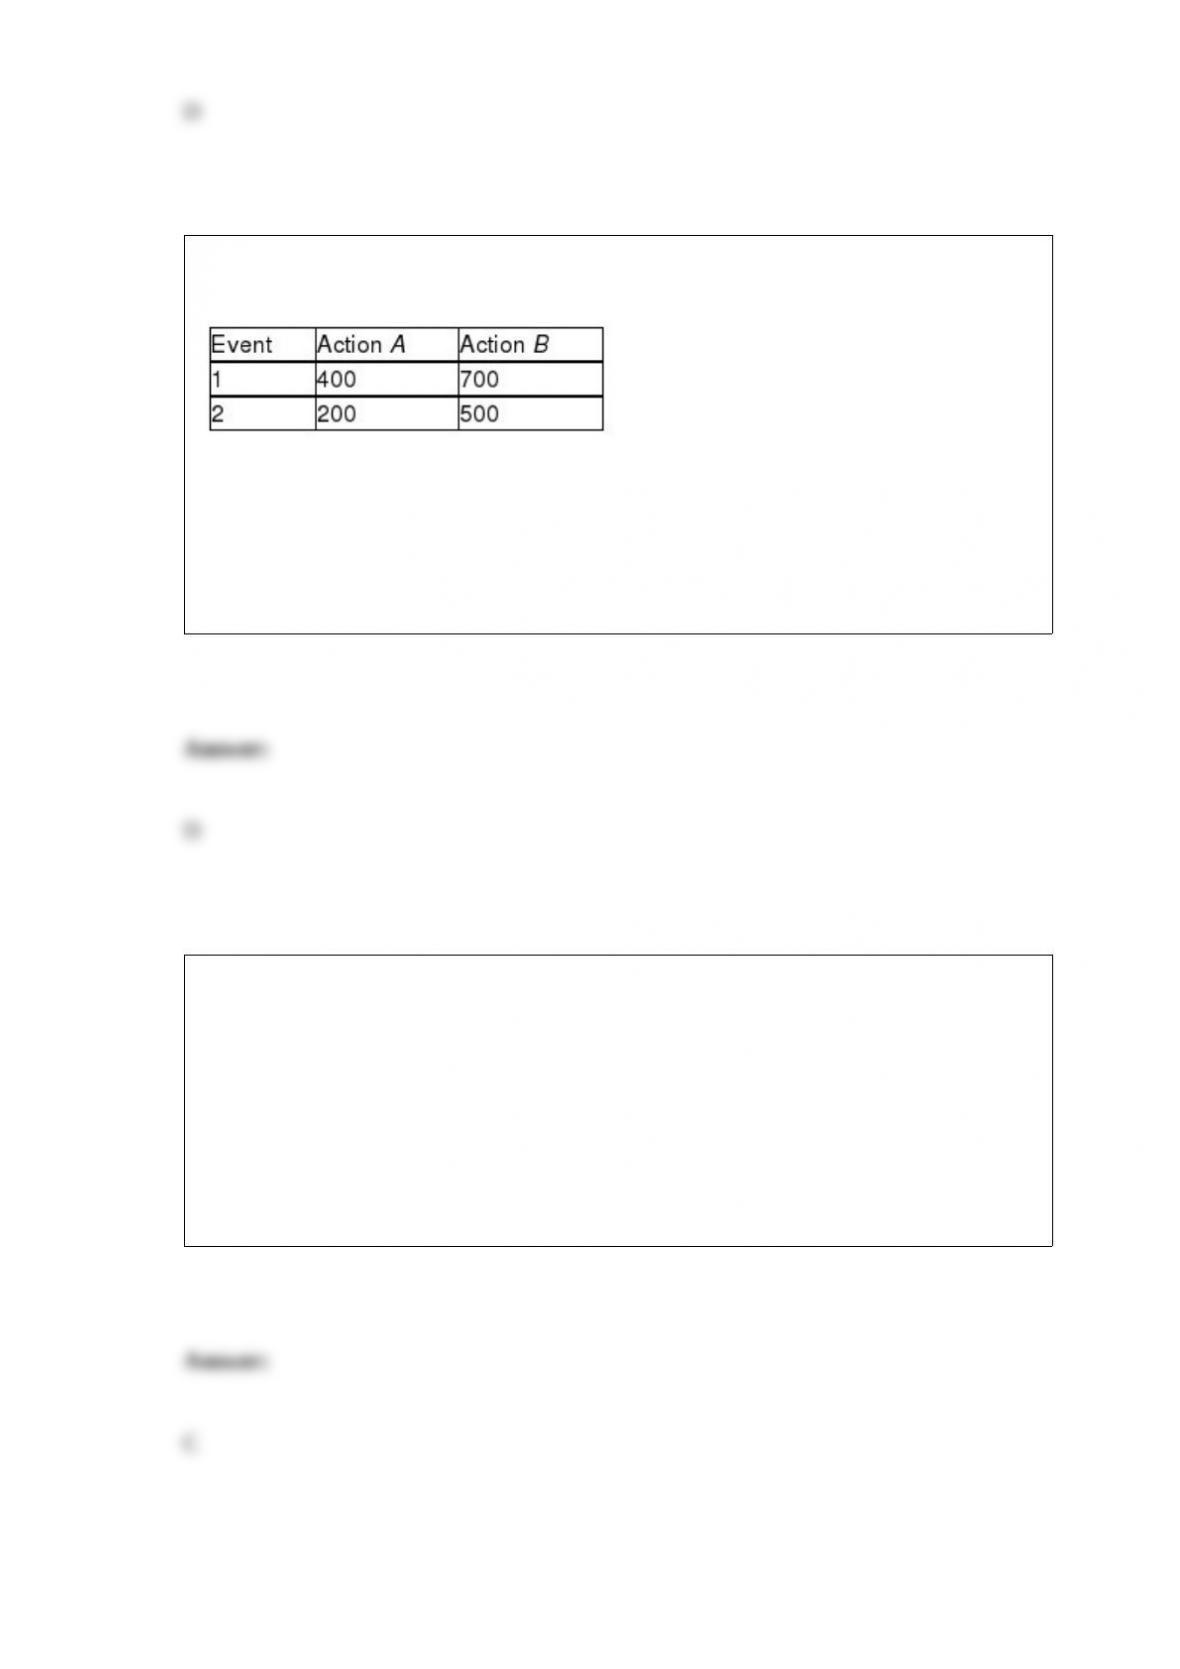
TABLE 19-2
The following payoff matrix is given in dollars.
Suppose the probability of Event 1 is 0.5 and Event 2 is 0.5.
Referring to Table 19-2, the EOL for Action A is
A) 0.
B) 100.
C) 200.
D) 300.
The F test statistic in a one-way ANOVA is
A) MSW/MSA.
B) SSW/SSA.
C) MSA/MSW.
D) SSA/SSW.
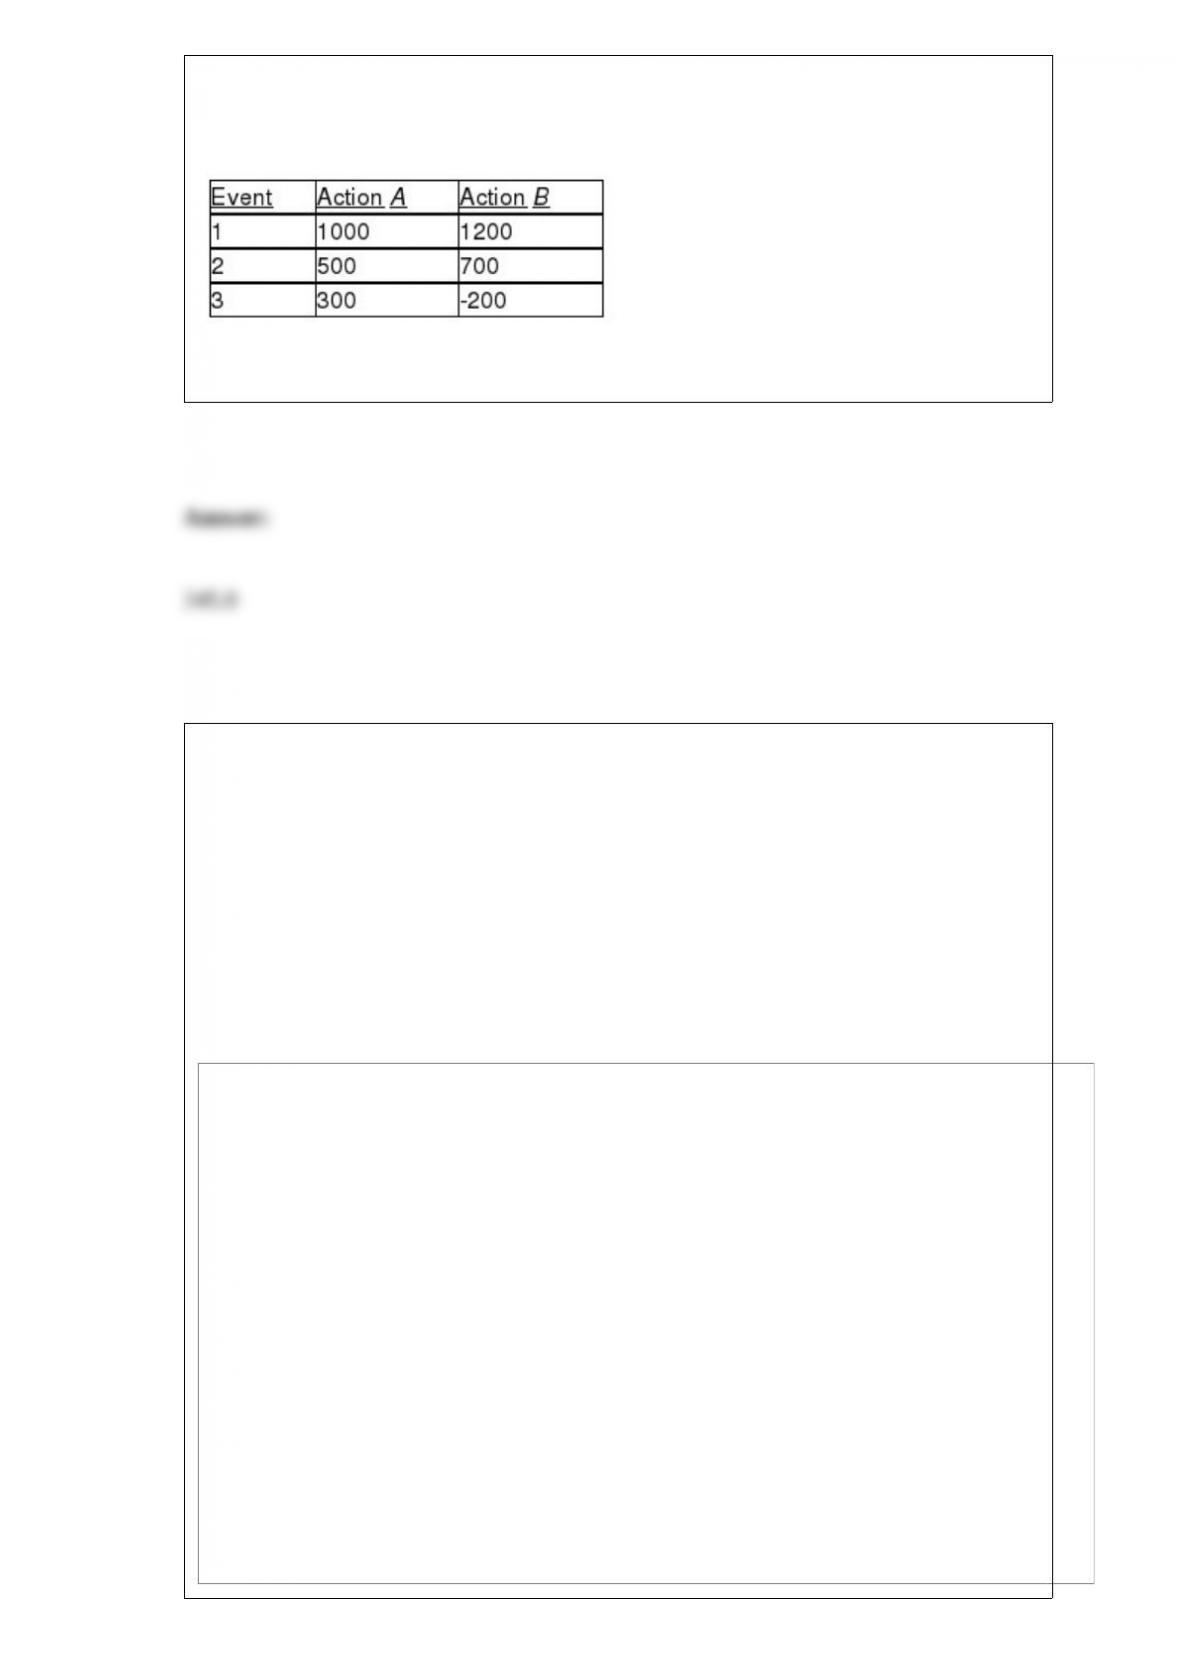
TABLE 19-5
The following payoff table shows profits associated with a set of 2 alternatives under 3
possible events.
Suppose that the probability of Event 1 is 0.2, Event 2 is 0.5, and Event 3 is 0.3.
Referring to Table 19-5, what is the standard deviation for Action A?
Referring to Table 14-7, the department head wants to test H0 : β1 =
β2 = 0. The p-value of the test is ________.
TABLE 14-7
The department head of the accounting department wanted to see if
she could predict the GPA of students using the number of course
units (credits) and total SAT scores of each. She takes a sample of
students and generates the following Microsoft Excel output:
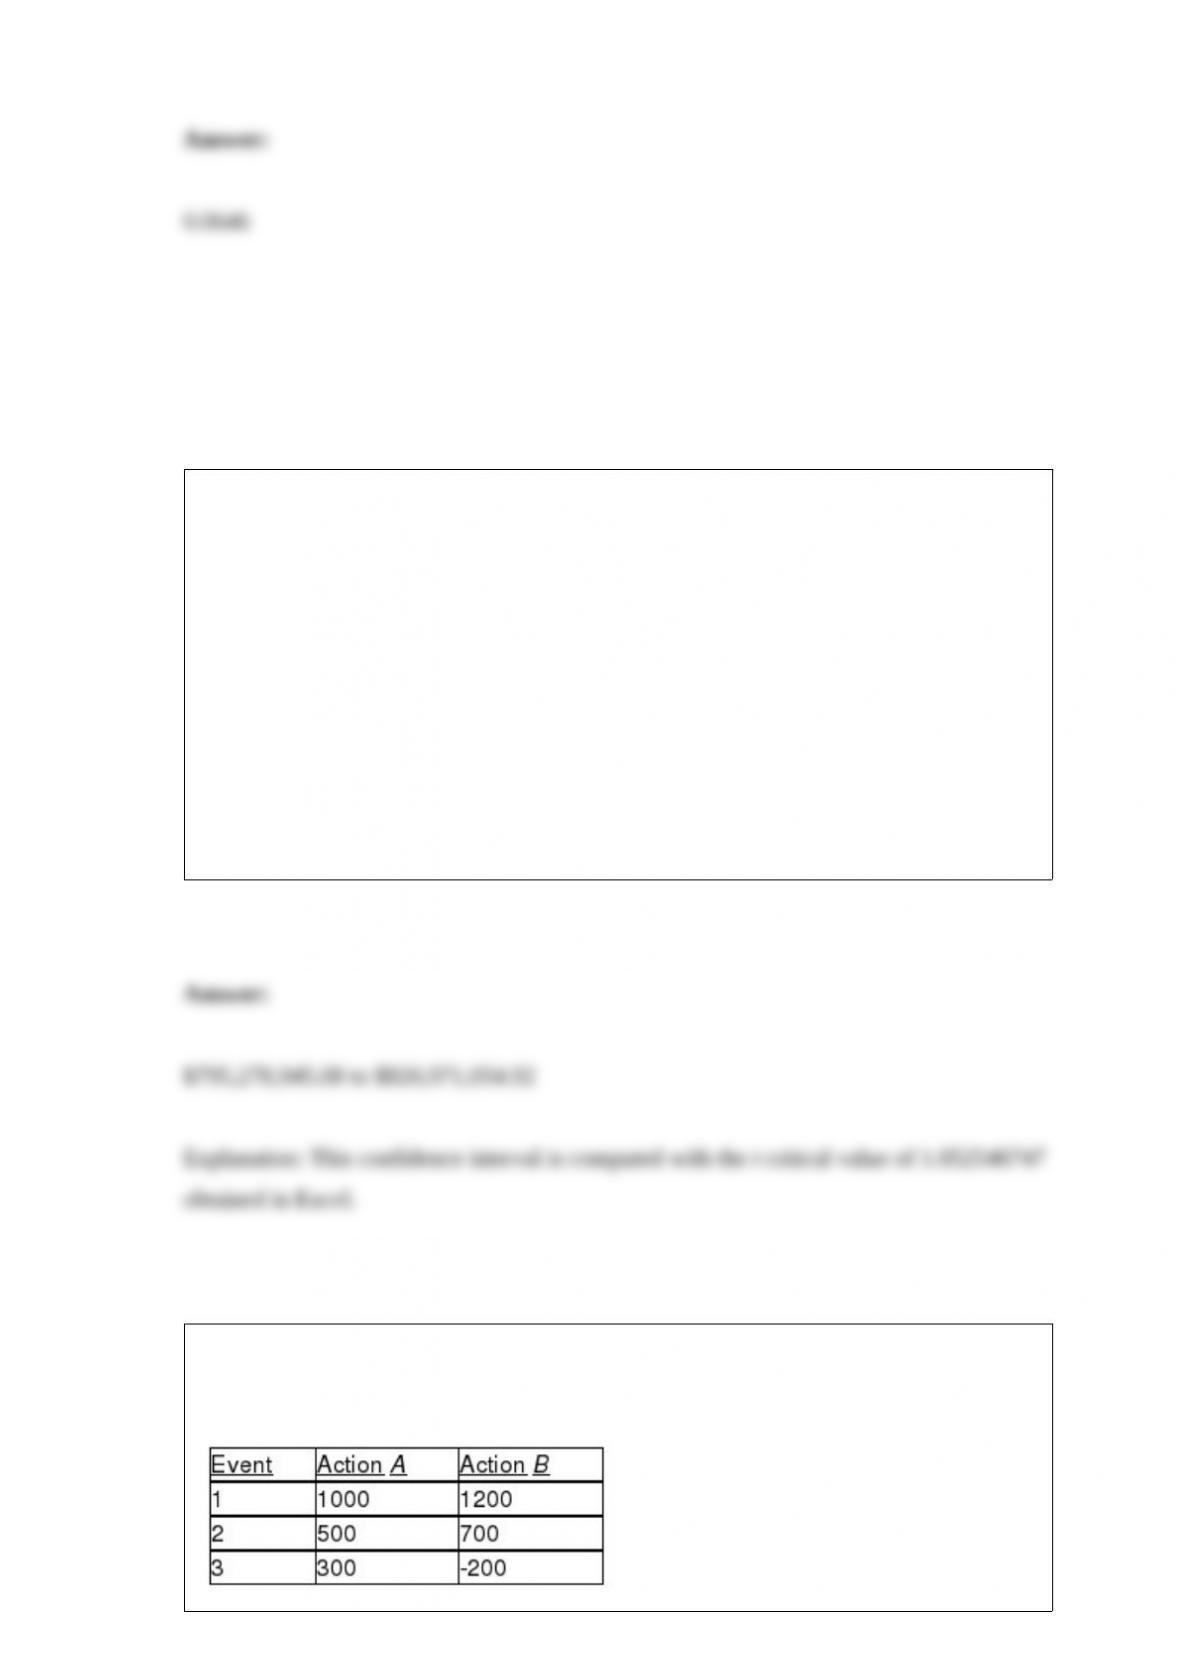
TABLE 8-18
A wealthy real estate investor wants to decide whether it is a good investment to build a
high-end shopping complex in a suburban county in Chicago. His main concern is the
total market value of the 3,605 houses in the suburban county. He commissioned a
statistical consulting group to take a sample of 200 houses and obtained a sample mean
market price of $225,000 and a sample standard deviation of $38,700. The consulting
group also found out that the mean differences between market prices and appraised
prices was $125,000 with a standard deviation of $3,400. Also the proportion of houses
in the sample that are appraised for higher than the market prices is 0.24.
Referring to Table 8-18, what will be the 90% confidence interval for the total market
price of the houses in the suburban county constructed by the consulting group?
TABLE 19-5
The following payoff table shows profits associated with a set of 2 alternatives under 3
possible events.

Suppose that the probability of Event 1 is 0.2, Event 2 is 0.5, and Event 3 is 0.3.
Referring to Table 19-5, what is the optimal action using EMV?
TABLE 12-2
The dean of a college is interested in the proportion of graduates from his college who
have a job offer on graduation day. He is particularly interested in seeing if there is a
difference in this proportion for accounting and economics majors. In a random sample
of 100 of each type of major at graduation, he found that 65 accounting majors and 52
economics majors had job offers. If the accounting majors are designated as “Group 1”
and the economics majors are designated as “Group 2,” perform the appropriate
hypothesis test using a level of significance of 0.05.
Referring to Table 12-2, the value of the test statistic is ________.