
TABLE 8-5
A sample of salary offers (in thousands of dollars) given to management majors is: 48,
51, 46, 52, 47, 48, 47, 50, 51, and 59. Using this data to obtain a 95% confidence
interval resulted in an interval from 47.19 to 52.61.
True or False: Referring to Table 8-5, 95% of the time, the sample mean salary offer to
management majors will fall between 47.19 and 52.61.
True or False: So that we can fit curves as well as lines by regression, we often use
mathematical manipulations for converting one variable into a different form. These
manipulations are called dummy variables.
True or False: In left-skewed distributions, the distance from the smallest value to Q1 is
greater than the distance from Q3 to the largest value.
True or False: The level of satisfaction (“Very unsatisfied,” “Fairly unsatisfied,” “Fairly
satisfied,” and “Very satisfied”) in a class is an example of a categorical variable.
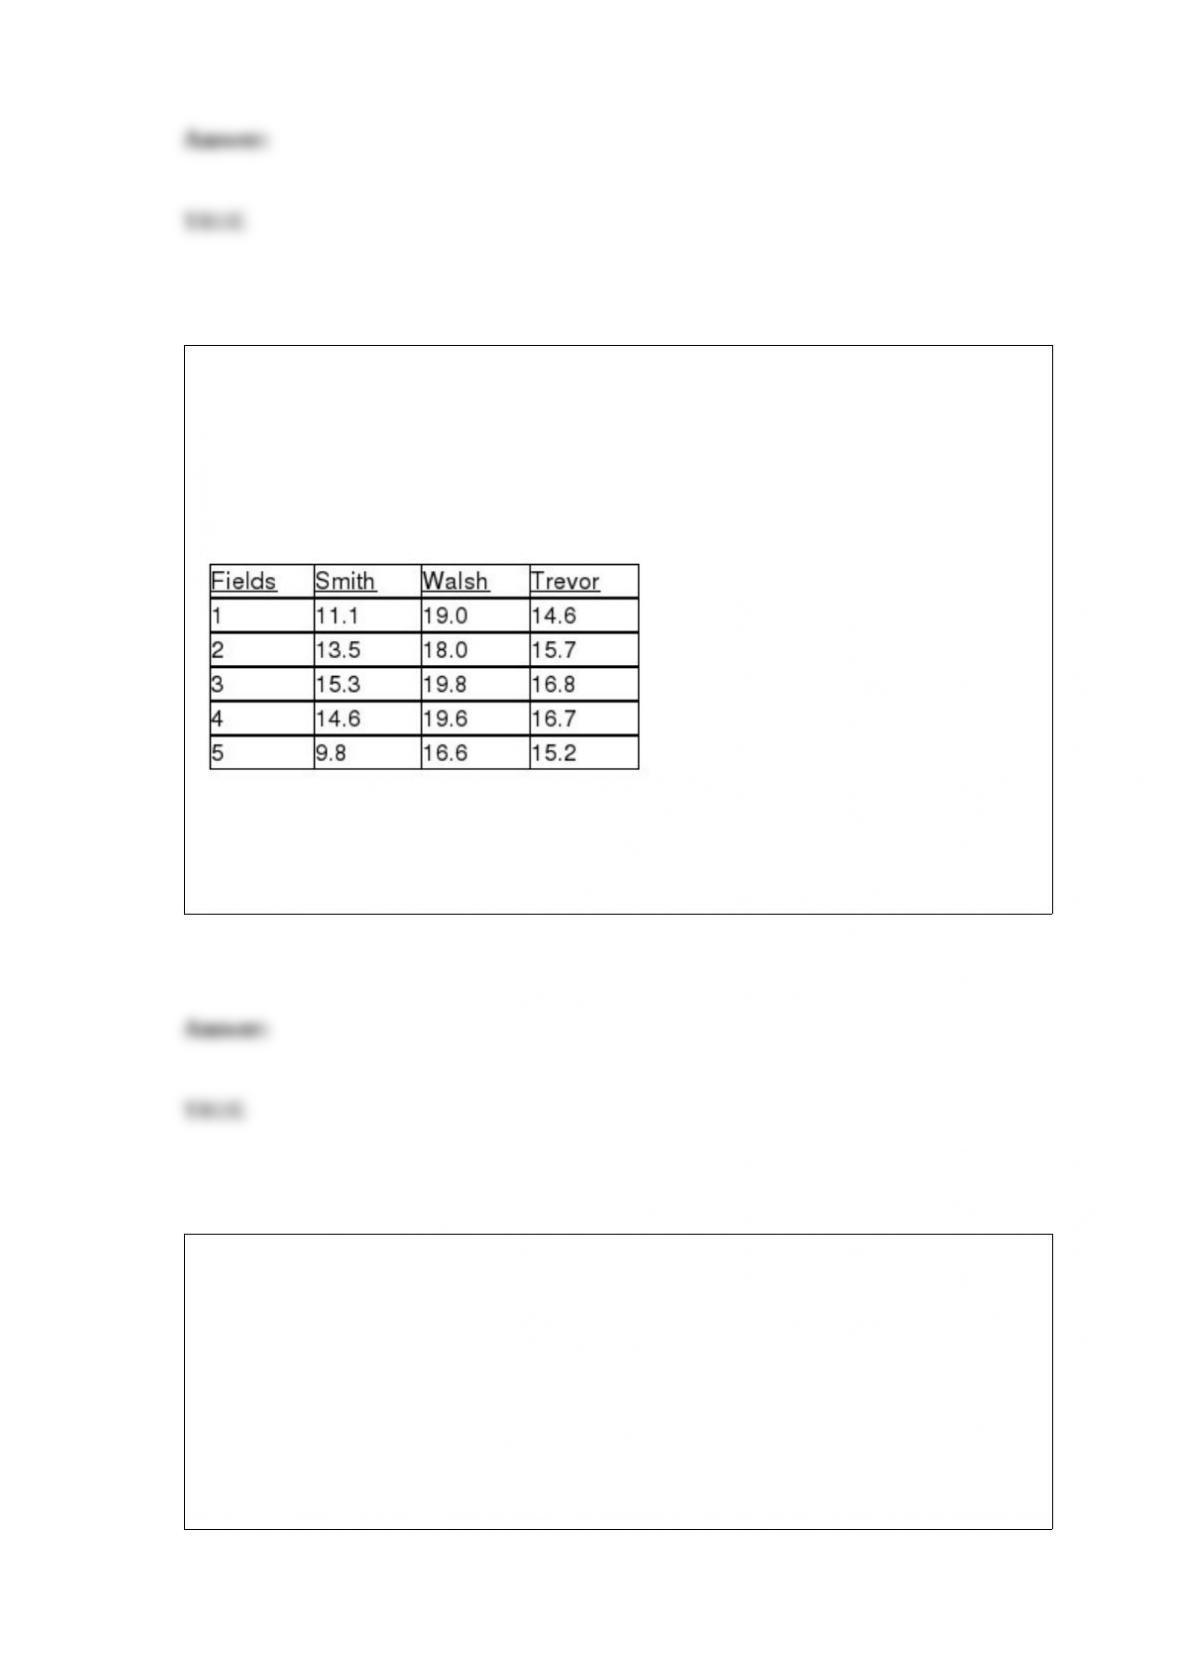
TABLE 11-10
An agronomist wants to compare the crop yield of 3 varieties of chickpea seeds. She
plants all 3 varieties of the seeds on each of 5 different patches of fields. She then
measures the crop yield in bushels per acre. Treating this as a randomized block design,
the results are presented in the table that follows.
True or False: Referring to Table 11-10, based on the Tukey multiple comparison
procedure with an overall level of significance of 0.01, the agronomist would decide
that there is a significant difference between the crop yield of Walsh and Trevor seeds.
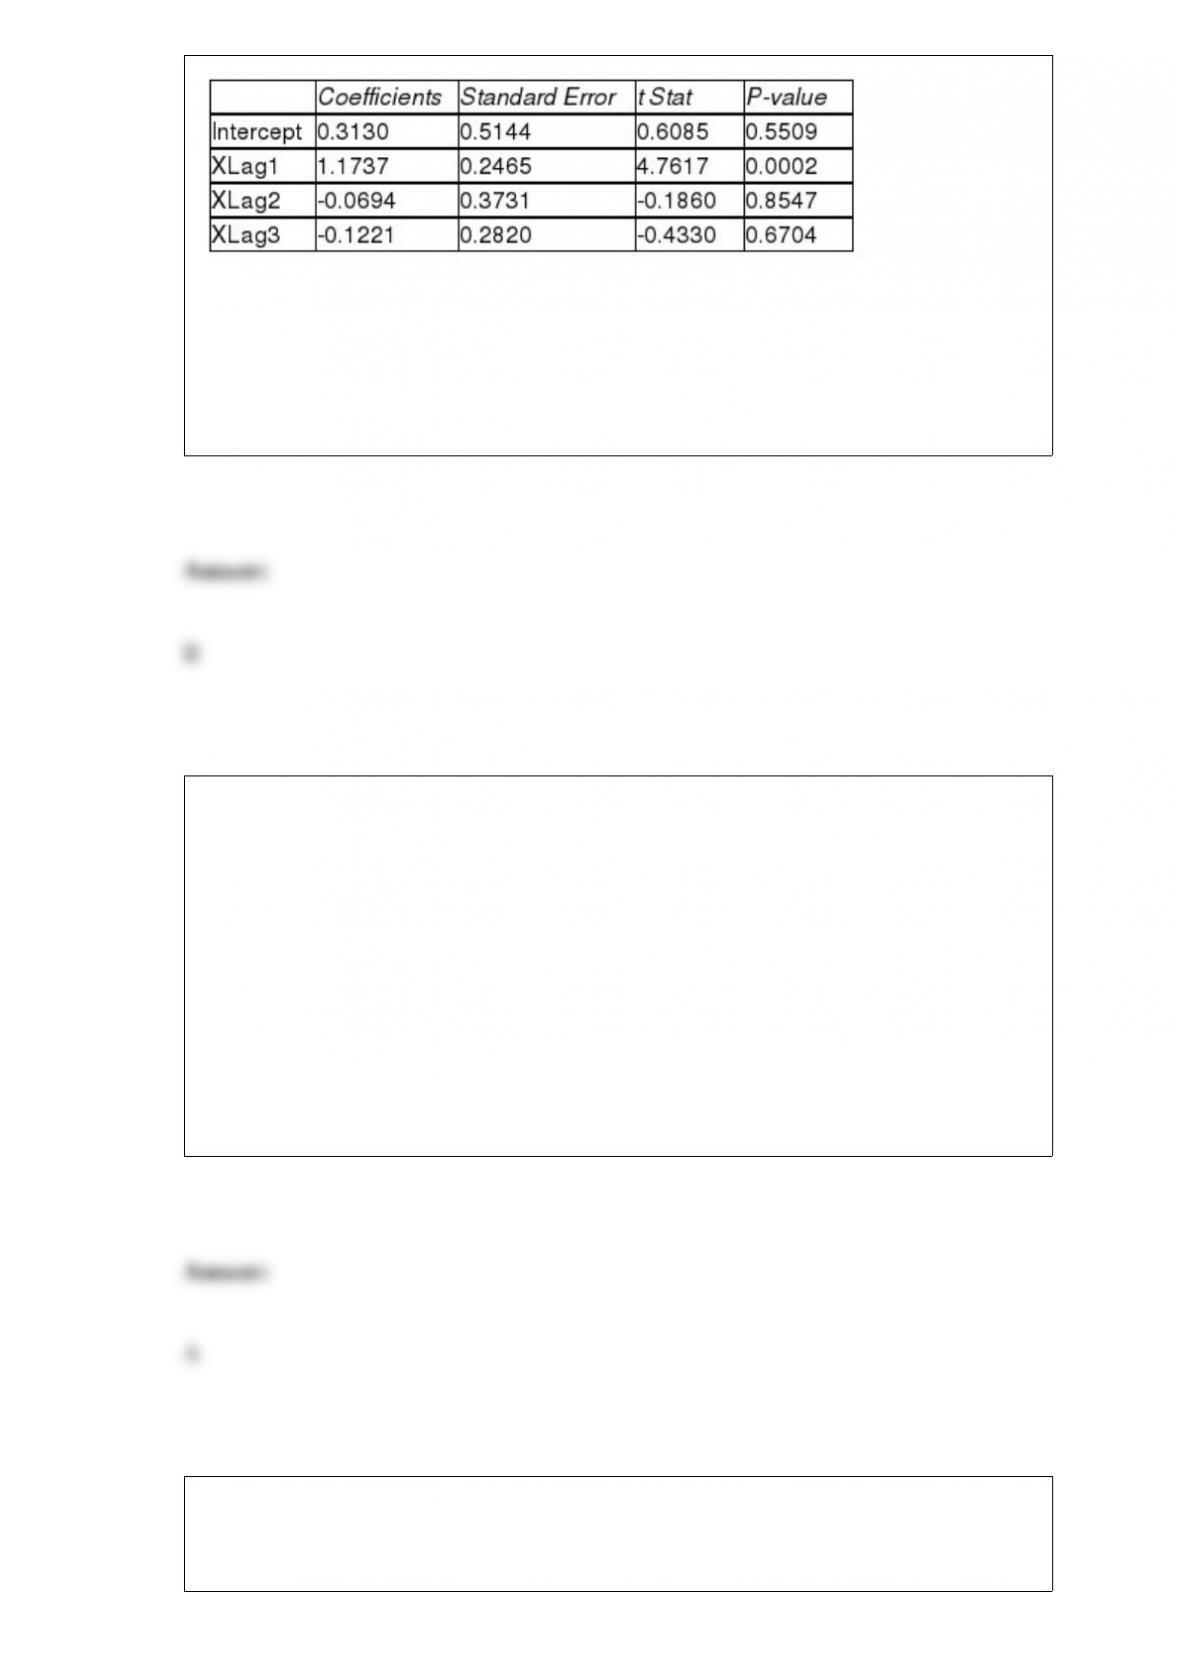
TABLE 14-17
Given below are results from the regression analysis where the
dependent variable is the number of weeks a worker is unemployed
due to a layo! (Unemploy) and the independent variables are the age
of the worker (Age) and a dummy variable for management position
(Manager: 1 = yes, 0 = no).
The results of the regression analysis are given below:
True or False: Referring to Table 14-17, we can conclude de.nitively
that, holding constant the e!ect of the other independent variables,
there is not a di!erence in the mean number of weeks a worker is
unemployed due to a layo! between a worker who is in a
management position and one who is not at a 1% level of signi.cance
if all we have is the information of the 95% con.dence interval
estimate for the di!erence in the mean number of weeks a worker is
unemployed due to a layo! between a worker who is in a
management position and one who is not.
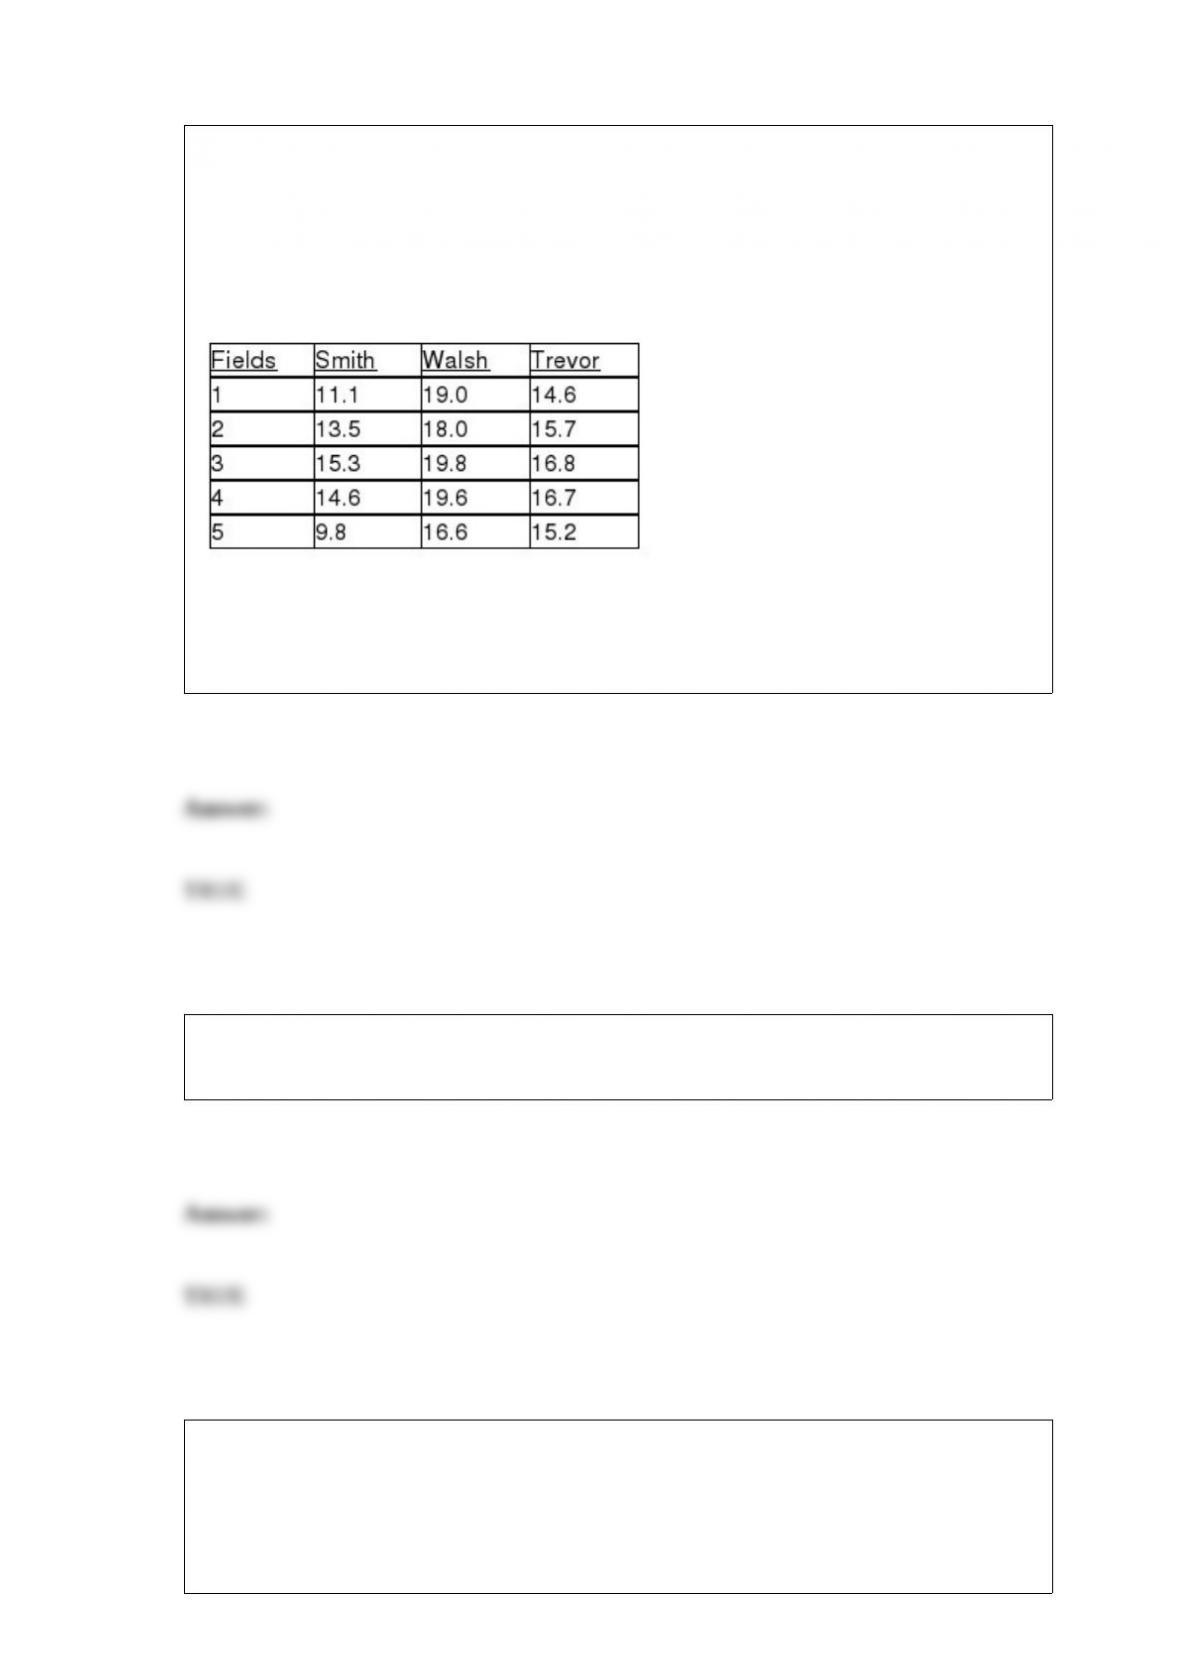
TABLE 11-10
An agronomist wants to compare the crop yield of 3 varieties of chickpea seeds. She
plants all 3 varieties of the seeds on each of 5 different patches of fields. She then
measures the crop yield in bushels per acre. Treating this as a randomized block design,
the results are presented in the table that follows.
True or False: Referring to Table 11-10, based on the Tukey-Kramer procedure with an
overall level of significance of 0.01, the agronomist would decide that there is a
significant difference between the crop yield of Smith and Trevor seeds.
True or False: The main principle behind the Pareto chart is the ability to separate the
“vital few” from the “trivial many.”
TABLE 12-5
Four surgical procedures currently are used to install pacemakers. If the patient does not
need to return for follow-up surgery, the operation is called a “clear” operation. A heart
center wants to compare the proportion of clear operations for the 4 procedures, and
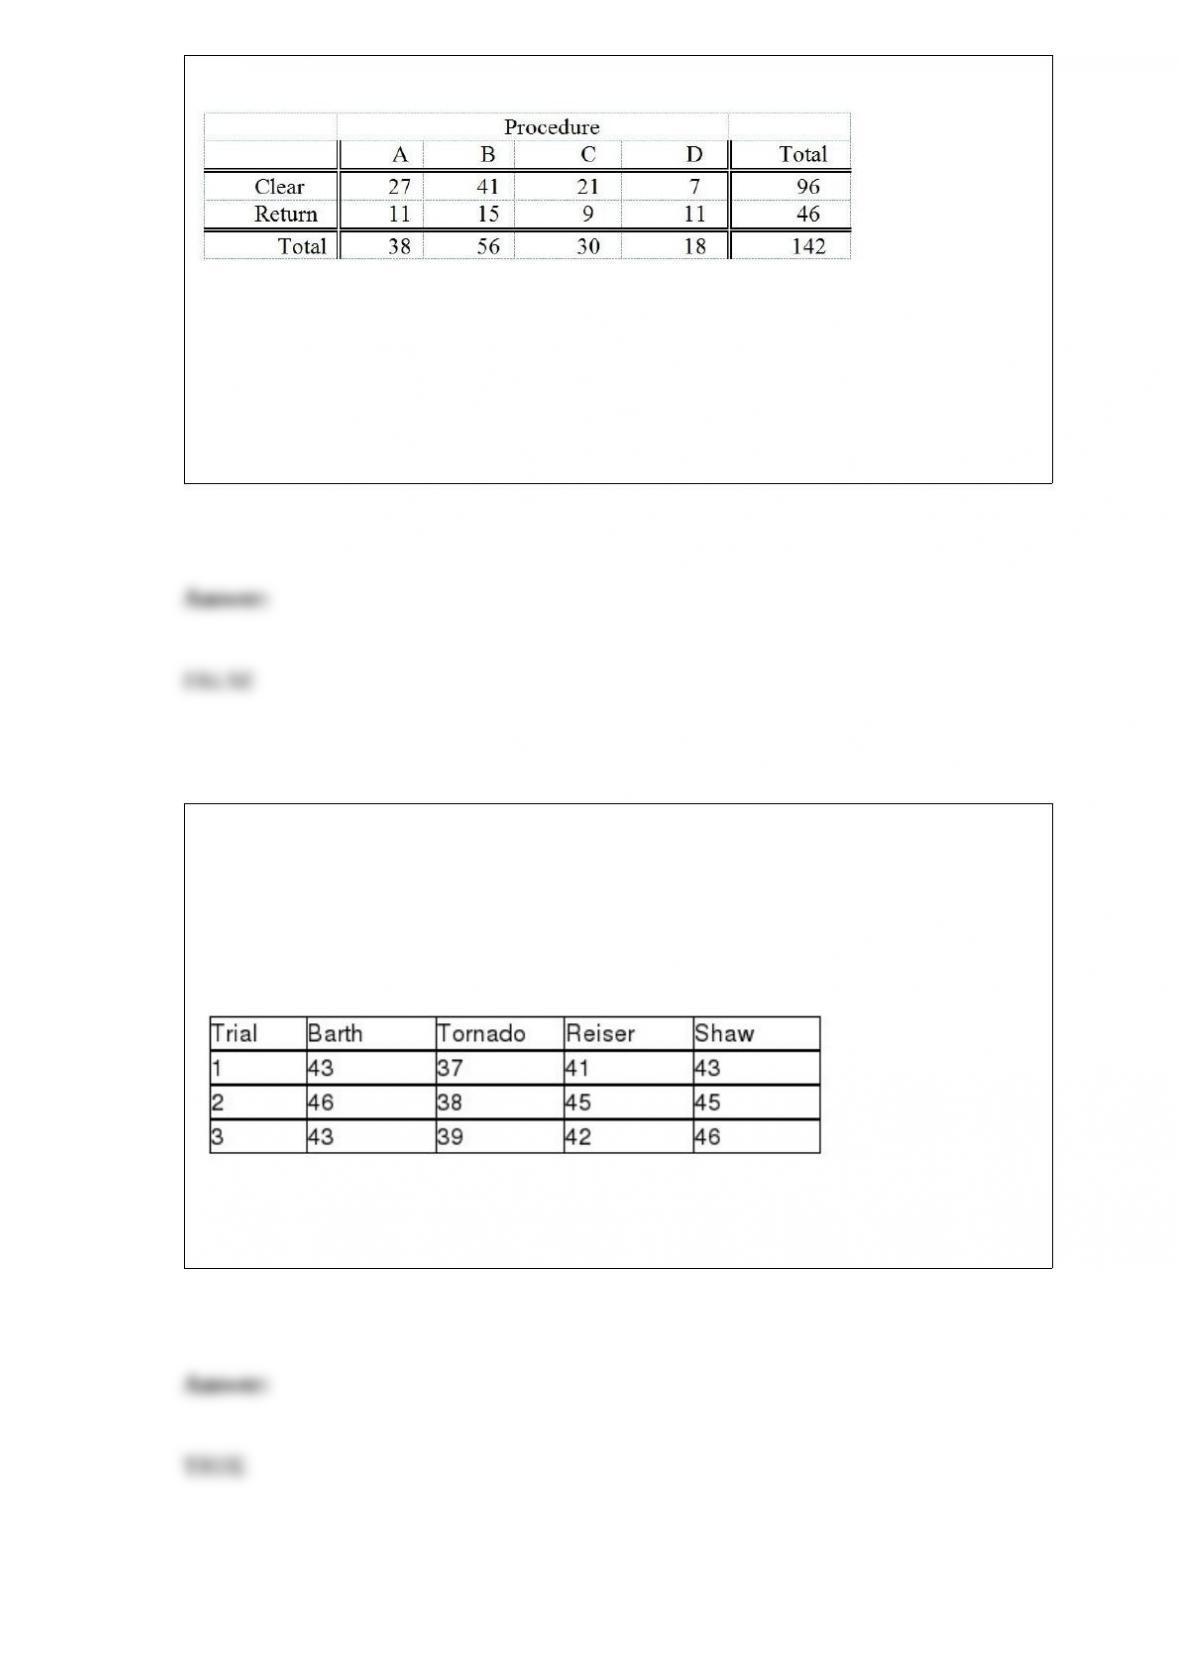
collects the following numbers of patients from their own records:
They will use this information to test for a difference among the proportion of clear
operations using a chi-square test with a level of significance of 0.05.
True or False: Referring to Table 12-5, there is sufficient evidence to conclude that the
proportions between procedure A and procedure D are different at a 0.05 level of
significance.
TABLE 11-3
As part of an evaluation program, a sporting goods retailer wanted to compare the
downhill coasting speeds of 4 brands of bicycles. She took 3 of each brand and
determined their maximum downhill speeds. The results are presented in miles per hour
in the table below.
True or False: Referring to Table 11-3, the test is valid only if the population of speeds
has the same variance for the 4 brands.
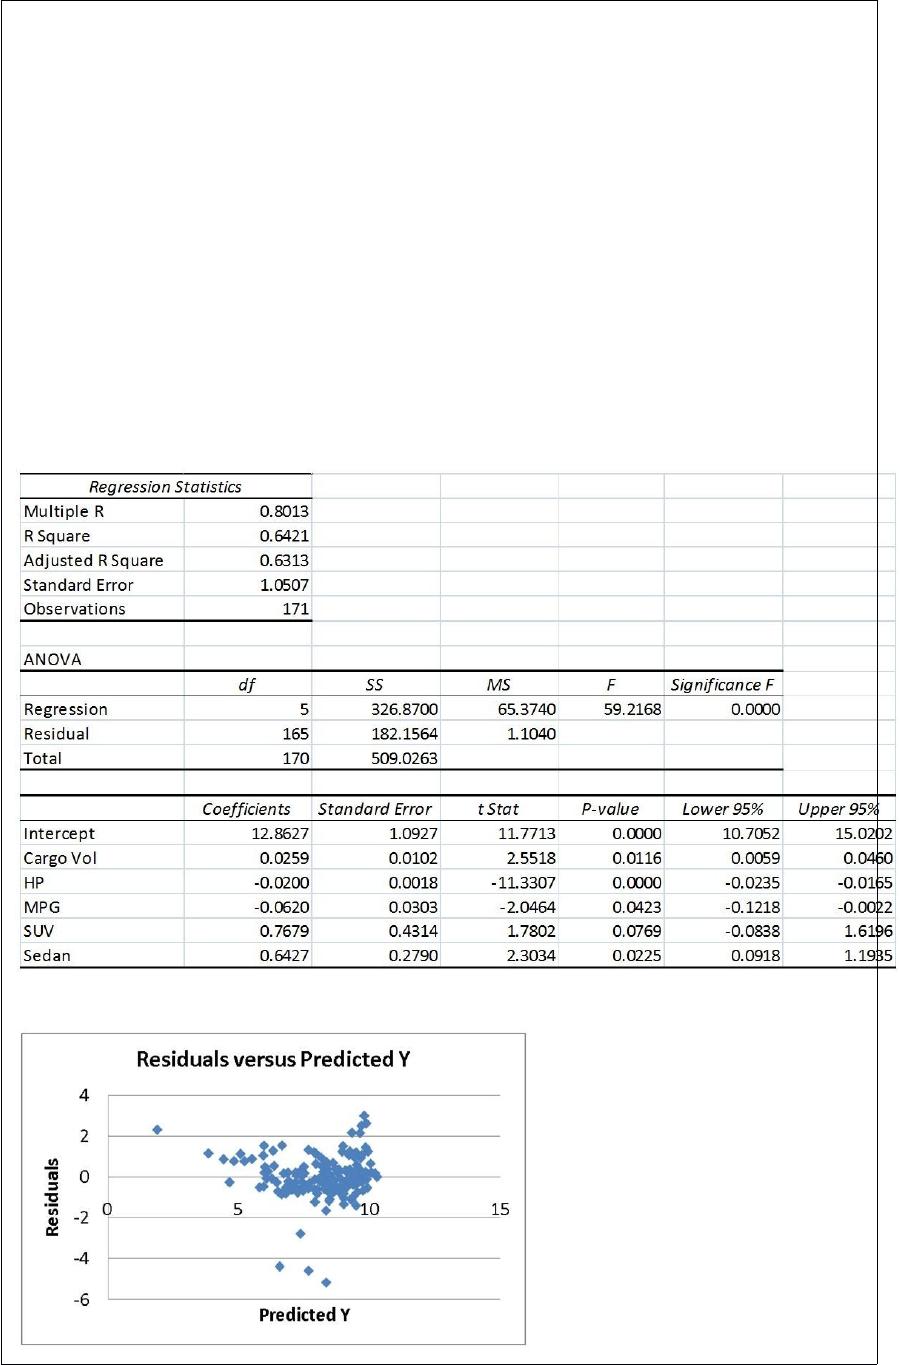
True or False: TABLE 17-9
What are the factors that determine the acceleration time (in sec.) from 0 to 60 miles per
hour of a car? Data on the following variables for 171 different vehicle models were
collected:
Accel Time: Acceleration time in sec.
Cargo Vol: Cargo volume in cu. ft.
HP: Horsepower
MPG: Miles per gallon
SUV: 1 if the vehicle model is an SUV with Coupe as the base when SUV and Sedan
are both 0
Sedan: 1 if the vehicle model is a sedan with Coupe as the base when SUV and Sedan
are both 0
The regression results using acceleration time as the dependent variable and the
remaining variables as the independent variables are presented below.
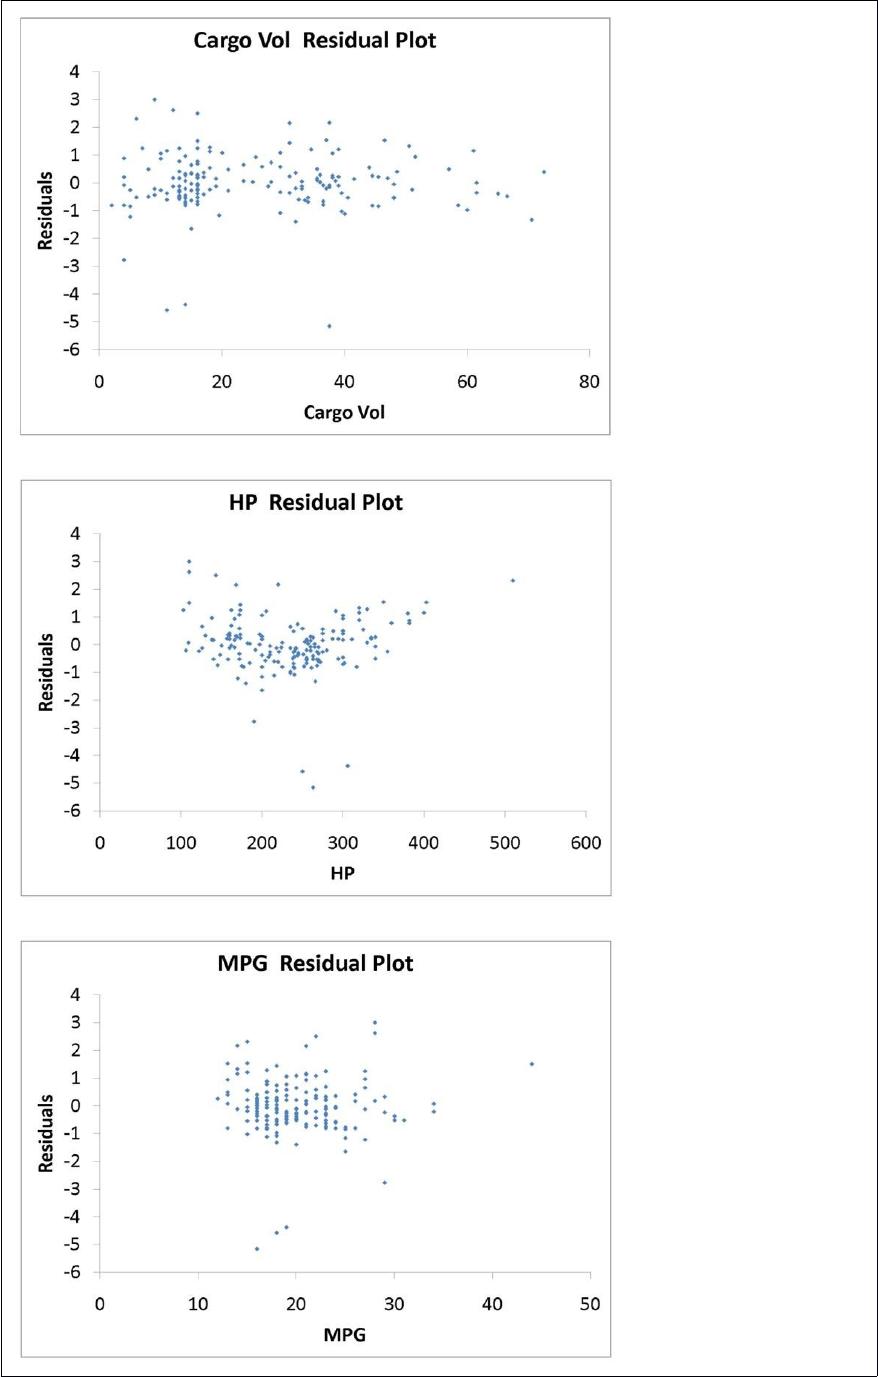
The various residual plots are as shown below.
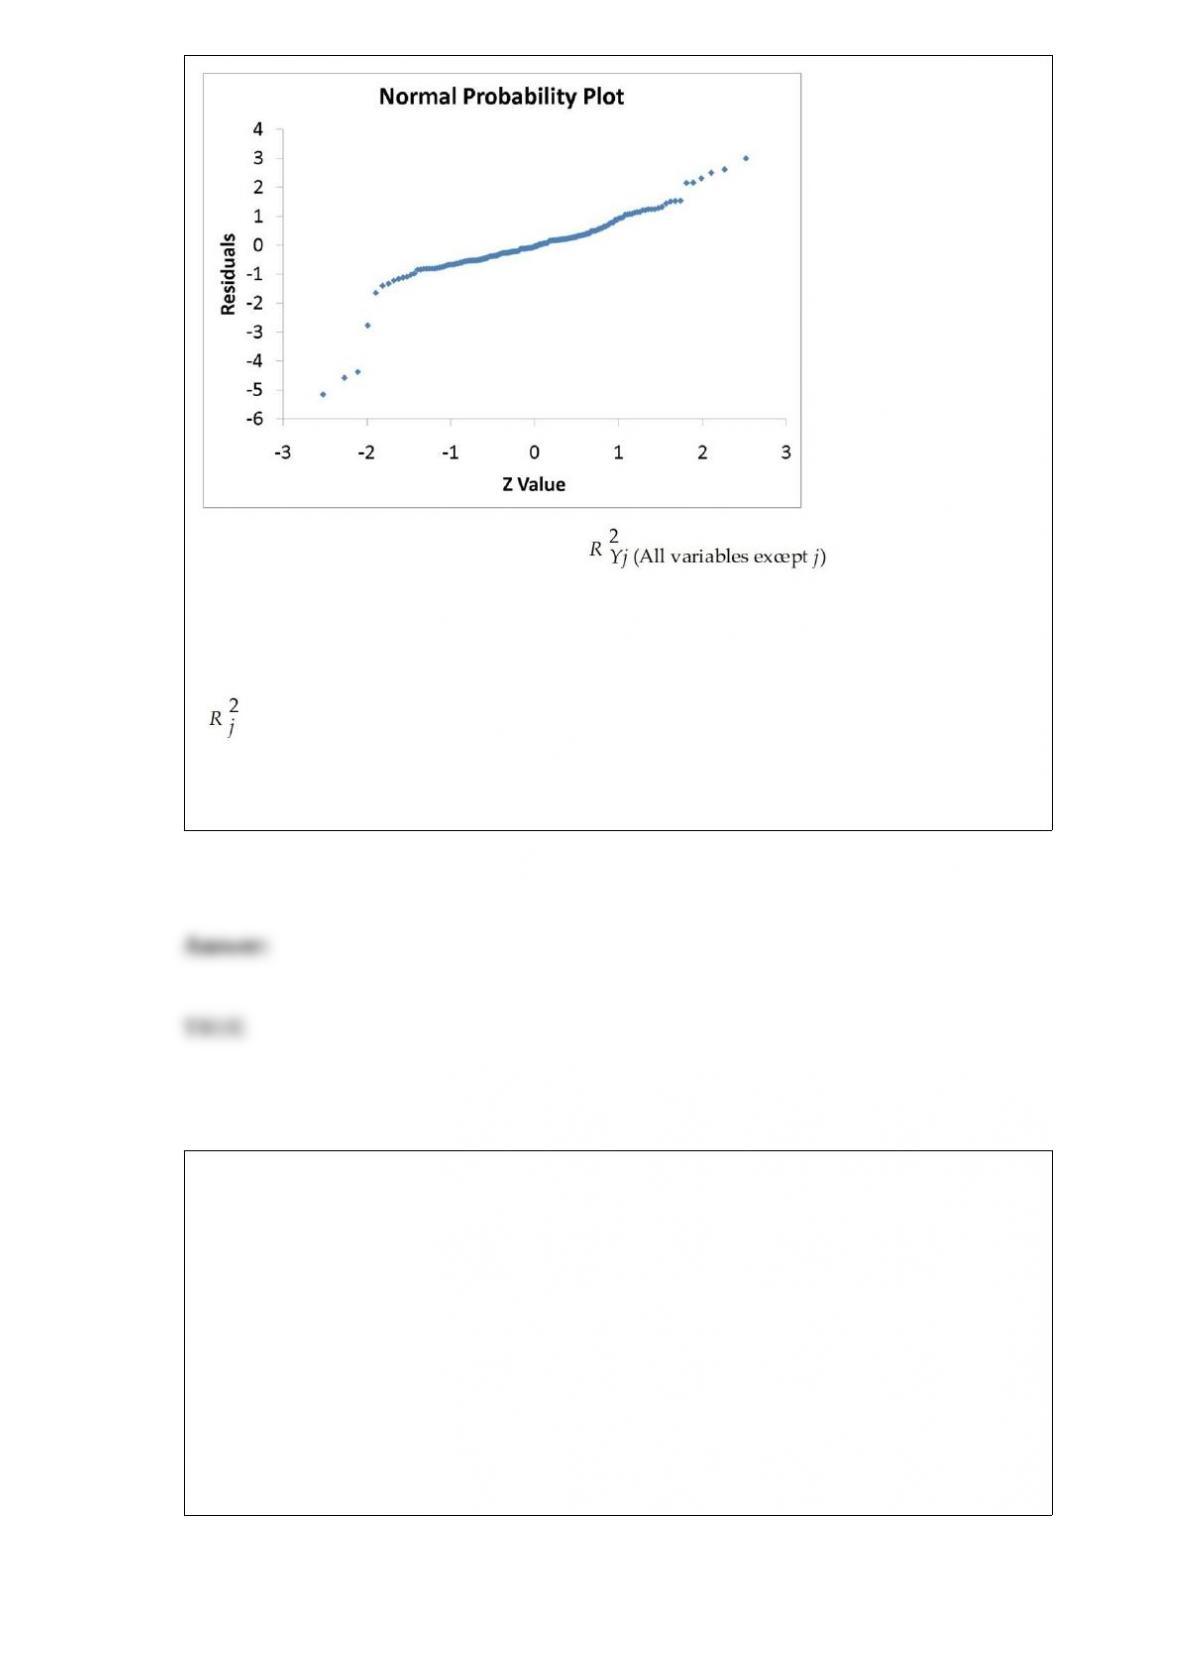
The coefficient of partial determination ( ) of each of the 5
predictors are, respectively, 0.0380, 0.4376, 0.0248, 0.0188, and 0.0312.
The coefficient of multiple determination for the regression model using each of the 5
variables Xj as the dependent variable and all other X variables as independent variables
( ) are, respectively, 0.7461, 0.5676, 0.6764, 0.8582, 0.6632.
Referring to Table 17-9, the 0 to 60 miles per hour acceleration time of a coupe is
predicted to be 0.6427 seconds lower than that of a sedan.
TABLE 14-15
The superintendent of a school district wanted to predict the
percentage of students passing a sixth-grade pro.ciency test. She
obtained the data on percentage of students passing the pro.ciency
test (% Passing), mean teacher salary in thousands of dollars
(Salaries), and instructional spending per pupil in thousands of dollars
(Spending) of 47 schools in the state.
Following is the multiple regression output with Y = % Passing as the
dependent variable, X1 = Salaries and X2 = Spending:

True or False: Referring to Table 14-15, the alternative hypothesis H1 :
At least one of βj ≠0 for j = 1, 2 implies that percentage of
students passing the pro.ciency test is a!ected by at least one of the
explanatory variables.
True or False: If you wish to construct a graph of a relative frequency distribution, you
would most likely construct an ogive first.
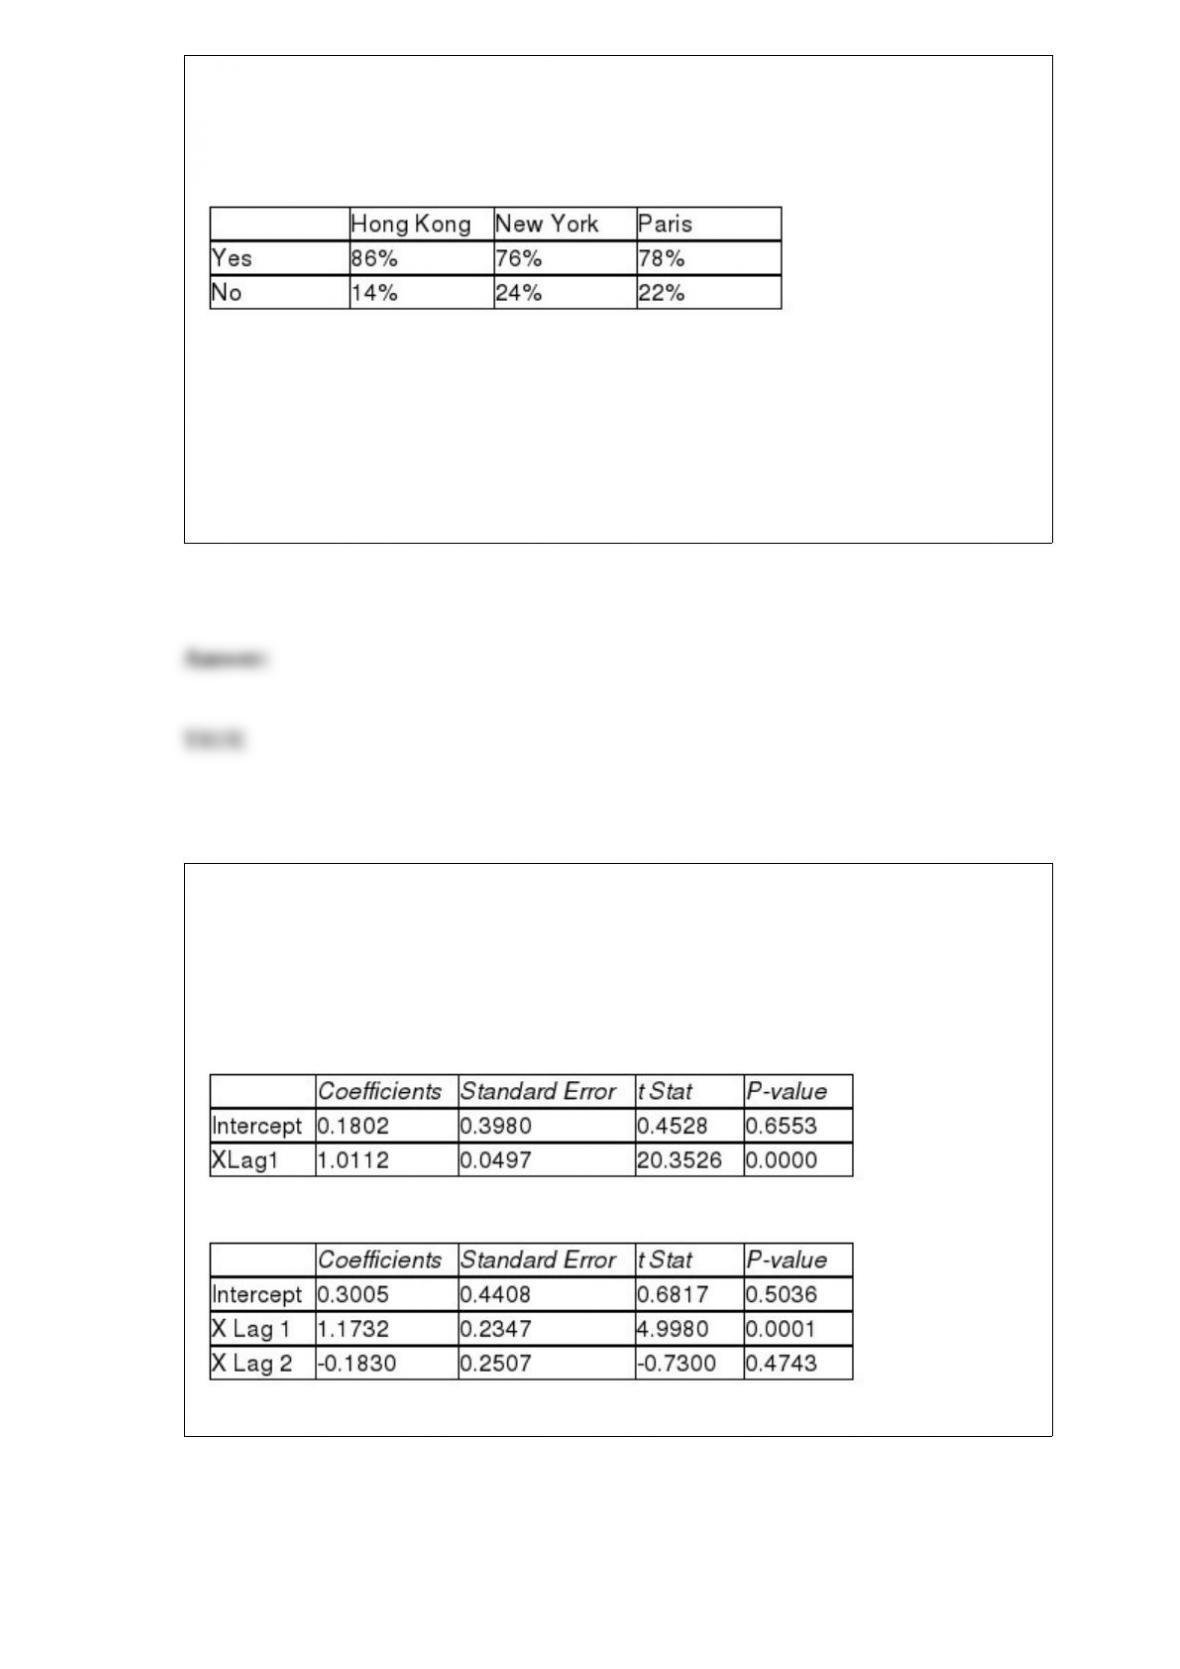
TABLE 12-7
Data on the percentage of 200 hotels in each of the three large cities across the world on
whether minibar charges are correctly posted at checkout are given below.
At the 0.05 level of significance, you want to know if there is evidence of a difference
in the proportion of hotels that correctly post minibar charges among the three cities.
True or False: Referring to Table 12-7, there is sufficient evidence to conclude that the
proportions between Hong Kong and New York are different at a 0.05 level of
significance.
TABLE 16-9
Given below are EXCEL outputs for various estimated autoregressive models for a
company’s real operating revenues (in billions of dollars) from 1989 to 2012. From the
data, you also know that the real operating revenues for 2010, 2011, and 2012 are
11.7909, 11.7757 and 11.5537, respectively.
First-Order Autoregressive Model:
Second-Order Autoregressive Model:
Third-Order Autoregressive Model:
Referring to Table 16-9, if one decides to use the Third-Order Autoregressive model,
what will the predicted real operating revenue for the company be in 2013?
A) $11.55 billion
B) $11.62 billion
C) $11.84 billion
D) $12.47 billion
The probability that a particular brand of smoke alarm will function properly and sound
an alarm in the presence of smoke is 0.8. You have 5 such alarms in your home and they
operate independently. Which of the following distributions would you use to determine
the probability that all of them will function properly in case of a fire?
A) Binomial distribution
B) Poisson distribution
C) Normal distribution
D) Hypergeometric distribution
The probability that a particular brand of smoke alarm will function properly and sound
an alarm in the presence of smoke is 0.8. A batch of 100,000 such alarms was produced
by independent production lines. Which of the following distributions would you use to

figure out the probability that at least 90,000 of them will function properly in case of a
fire?
A) Exponential distribution
B) Poisson distribution
C) Normal distribution
D) Uniform distribution
A medical doctor is involved in a $1 million malpractice suit. He can either settle out of
court for $250,000 or go to court. If he goes to court and loses, he must pay $825,000
plus $175,000 in court costs. If he wins in court the plaintiffs pay the court costs.
Identify the states of nature of this decision-making problem.
A) Two choices: <1> go to court and <2> settle out of court.
B) Two possibilities: <1> win the case in court and <2> lose the case in court.
C) Four consequences resulting from Go/Settle and Win/Lose combinations.
D) The amount of money paid by the doctor.
TABLE 12-8
A study was conducted to determine whether the use of seat belts in motor vehicles
depends on the educational status of the parents. A sample of 792 children treated for
injuries sustained from motor vehicle accidents was obtained, and each child was
classified according to (1) parents’ educational status (College Degree or Non-College
Degree) and (2) seat belt usage (worn or not worn) during the accident. The number of
children in each category is given in the table below.
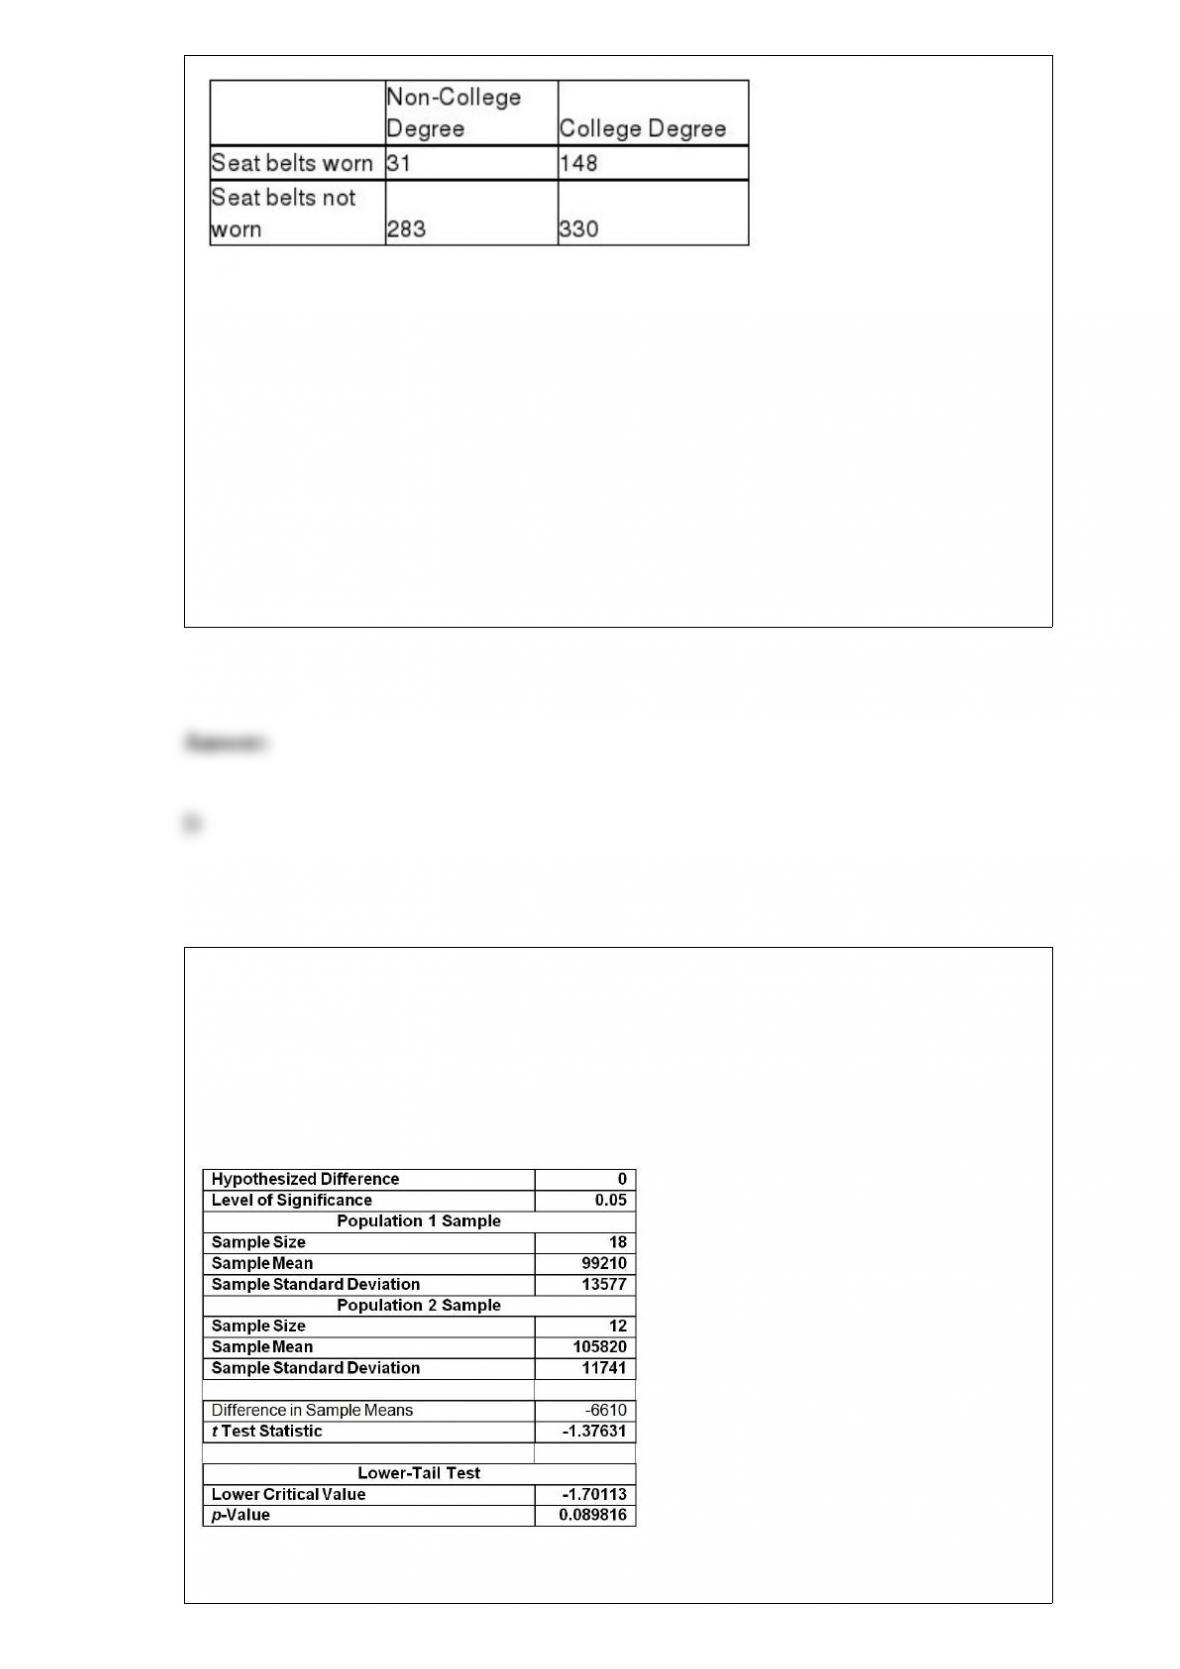
Referring to Table 12-8, at 5% level of significance, there is sufficient evidence to
conclude that
A) use of seat belts in motor vehicles is related to the educational status of the parents.
B) use of seat belts in motor vehicles depends on the educational status of the parents.
C) use of seat belts in motor vehicles is associated with the educational status of the
parents.
D) All of the above.
TABLE 10-2
A researcher randomly sampled 30 graduates of an MBA program and recorded data
concerning their starting salaries. Of primary interest to the researcher was the effect of
gender on starting salaries. The result of the pooled-variance t-test of the mean salaries
of the females (Population 1) and males (Population 2) in the sample is given below.
Referring to Table 10-2, the researcher was attempting to show statistically that the
female MBA graduates have a significantly lower mean starting salary than the male
MBA graduates. The proper conclusion for this test is
A) at the = 0.10 level, there is sufficient evidence to indicate a difference in the mean
starting salaries of male and female MBA graduates.
B) at the = 0.10 level, there is sufficient evidence to indicate that females have a
lower mean starting salary than male MBA graduates.
C) at the = 0.10 level, there is sufficient evidence to indicate that females have a
higher mean starting salary than male MBA graduates.
D) at the = 0.10 level, there is insufficient evidence to indicate any difference in the
mean starting salaries of male and female MBA graduates.
True or False: The D in the DCOVA framework stands for “data.”
In testing for differences between the means of two related populations, the null
hypothesis is
A) H0 : D = 2.
B) H0 : D = 0.
C) H0 : D < 0.
D) H0 : D > 0.

Referring to Table 14-15, which of the following is a correct
statement?
TABLE 14-15
The superintendent of a school district wanted to predict the
percentage of students passing a sixth-grade pro.ciency test. She
obtained the data on percentage of students passing the pro.ciency
test (% Passing), mean teacher salary in thousands of dollars
(Salaries), and instructional spending per pupil in thousands of dollars
(Spending) of 47 schools in the state.
Following is the multiple regression output with Y = % Passing as the
dependent variable, X1 = Salaries and X2 = Spending:
A) 18.26% of the total variation in the percentage of students passing
the pro.ciency test can be explained by mean teacher salary and
instructional spending per pupil.
B) 18.26% of the total variation in the percentage of students passing
the pro.ciency test can be explained by mean teacher salary and
instructional spending per pupil after adjusting for the number of
predictors and sample size.
C) 18.26% of the total variation in the percentage of students passing
the pro.ciency test can be explained by mean teacher salary holding
constant the e!ect of instructional spending per pupil.
D) 18.26% of the total variation in the percentage of students passing
the pro.ciency test can be explained by instructional spending per
pupil holding constant the e!ect of mean teacher salary.
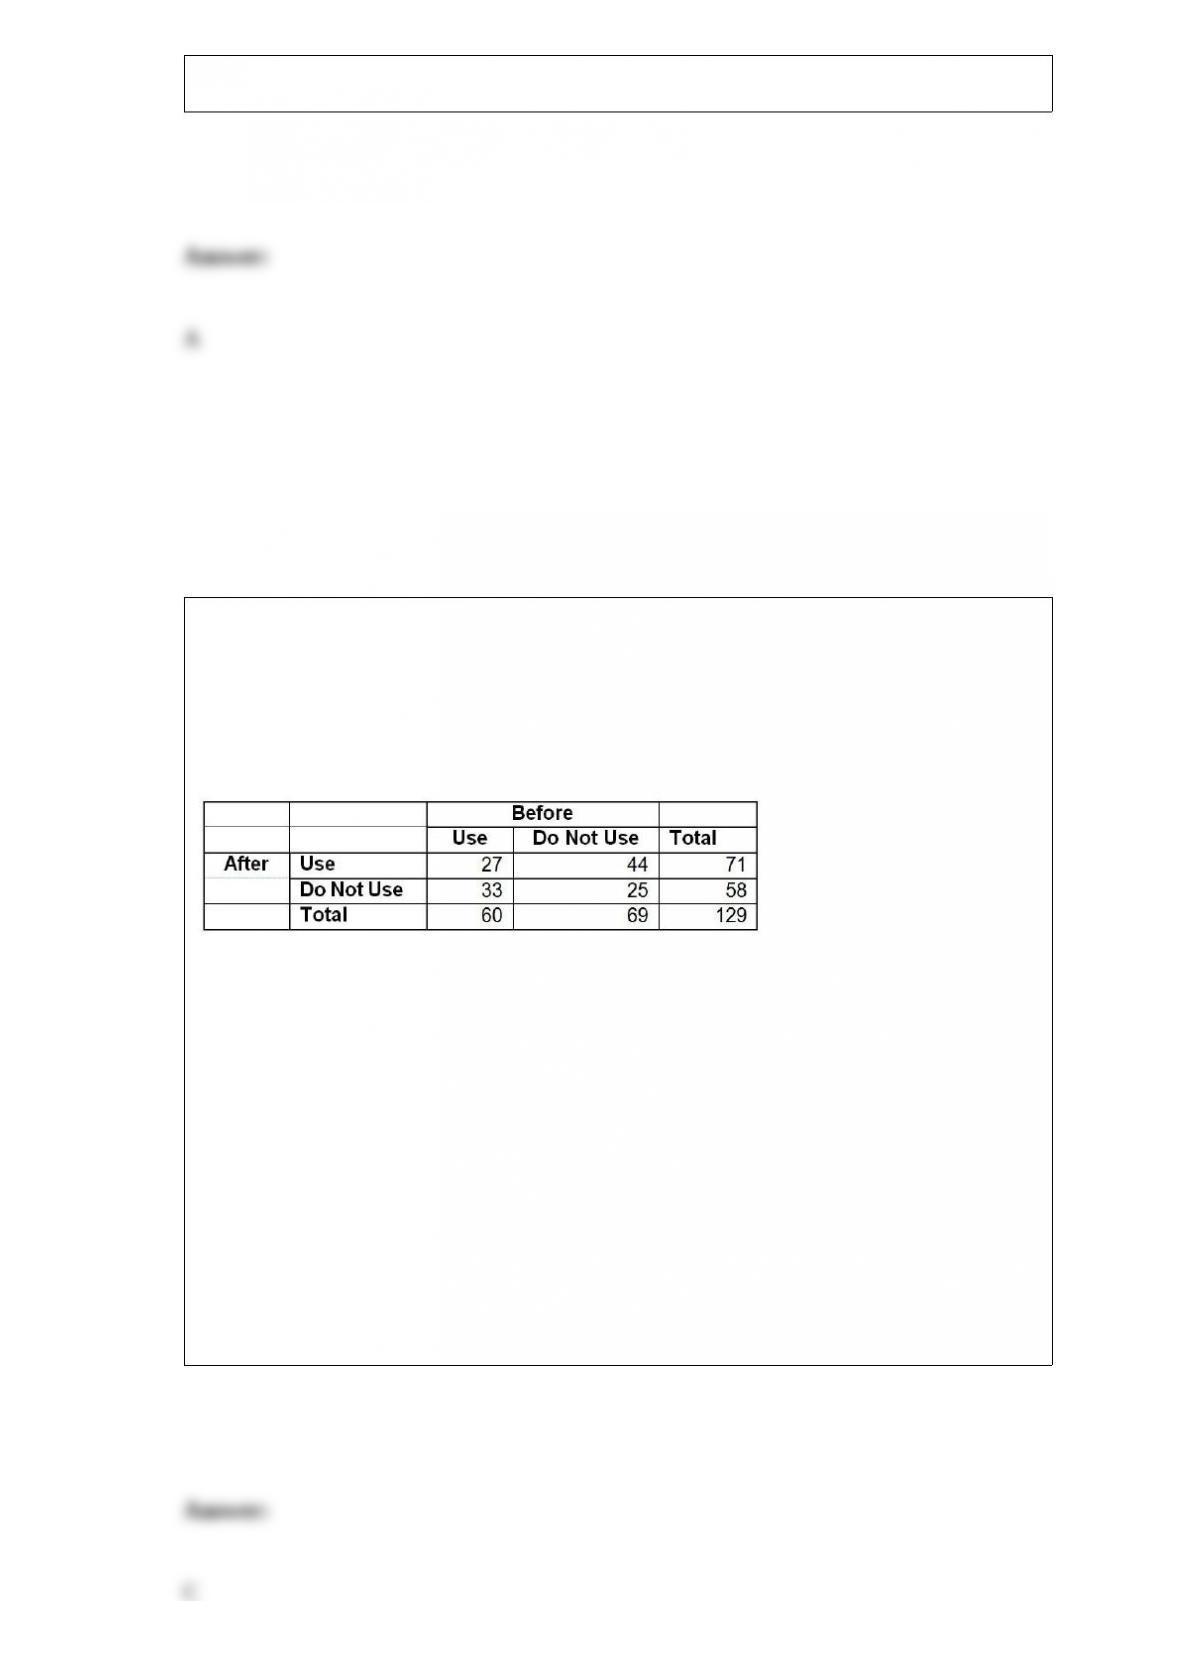
TABLE 12-18
The director of transportation of a large company is interested in the usage of the
company’s van pool program. She surveyed 129 of her employees on the usage of the
program before and after a campaign to convince her employees to use the service and
obtained the following:
She will use this information to perform a test using a level of significance of 0.05.
Referring to Table 12-18, the director now wants to know if the proportion of
employees who use the service before the campaign and the proportion of employees
who use the service after the campaign are the same. Which test should she use?
A) X2 test for difference in proportions
B) Z test for difference in proportions
C) McNemar test for difference in proportions
D) Wilcoxon rank sum test

A 99% confidence interval estimate can be interpreted to mean that
A) if all possible sample sizes of n are taken and confidence interval estimates are
developed, 99% of them would include the true population mean somewhere within
their interval.
B) we have 99% confidence that we have selected a sample whose interval does include
the population mean.
C) Both of the above.
D) None of the above.
TABLE 5-11
Subscribers to Investment Advice White Letters perform security transactions at the rate
of five trades per month. Assume that one of the subscribers performs transactions at
this rate and the probability of a transaction for any two months is the same and the
number of transactions in one month is independent of the number of transactions in
another month.
Referring to Table 5-11, what is the probability that no more than five security
transactions will be conducted in one month?
A first-order autoregressive model for stock sales is:
Salesi = 800 + 1.2(Sales)i-1.
If sales in 2012 is 6,000, the forecast of sales for 2013 is ________.
TABLE 8-2
A quality control engineer is interested in the mean length of sheet insulation being cut
automatically by machine. The desired mean length of the insulation is 12 feet. It is
known that the standard deviation in the cutting length is 0.15 feet. A sample of 70 cut
sheets yields a mean length of 12.14 feet. This sample will be used to obtain a 99%
confidence interval for the mean length cut by machine.
Referring to Table 8-2, suppose the engineer had decided to estimate the mean length to
within 0.03 with 99% confidence. Then the sample size would be ________.
In purchasing an automobile, there are a number of variables to consider. The
classification of the car as a subcompact, compact, standard, or luxury size is an
example of a ________ variable.
TABLE 5-11
Subscribers to Investment Advice White Letters perform security transactions at the rate
of five trades per month. Assume that one of the subscribers performs transactions at
this rate and the probability of a transaction for any two months is the same and the
number of transactions in one month is independent of the number of transactions in
another month.
Referring to Table 5-11, what is the probability that no security transaction will be
conducted in one month?
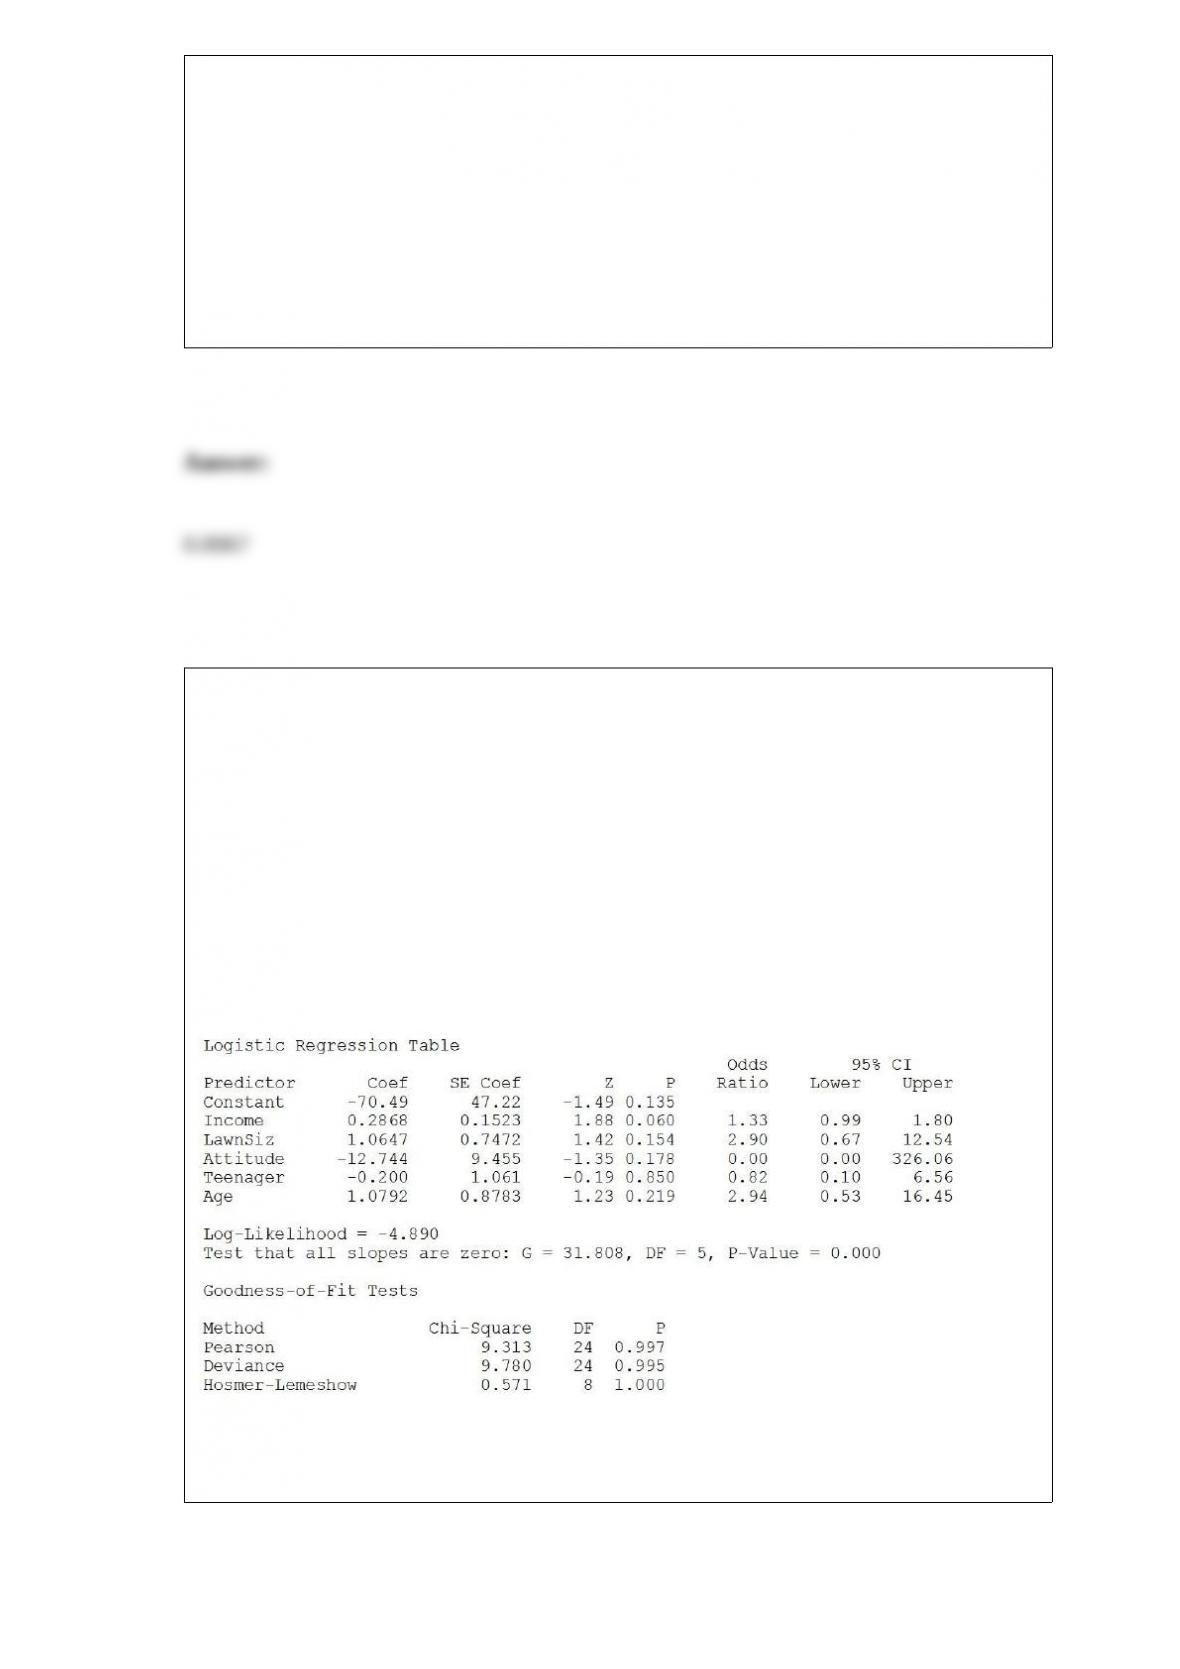
TABLE 17-12
The marketing manager for a nationally franchised lawn service company would like to
study the characteristics that differentiate home owners who do and do not have a lawn
service. A random sample of 30 home owners located in a suburban area near a large
city was selected; 15 did not have a lawn service (code 0) and 15 had a lawn service
(code 1). Additional information available concerning these 30 home owners includes
family income (Income, in thousands of dollars), lawn size (Lawn Size, in thousands of
square feet), attitude toward outdoor recreational activities (Attitude 0 = unfavorable, 1
= favorable), number of teenagers in the household (Teenager), and age of the head of
the household (Age).
The Minitab output is given below:
Referring to Table 17-12, what should be the decision (‘reject’ or ‘do not reject’) on the
null hypothesis when testing whether Attitude makes a significant contribution to the
model in the presence of the other independent variables at a 0.05 level of significance?
A manufacturer of power tools claims that the mean amount of time required to
assemble their top-of-the-line table saw is 80 minutes with a standard deviation of 40
minutes. Suppose a random sample of 64 purchasers of this table saw is taken. The
probability that the sample mean will be between 77 and 89 minutes is ________.