True or False: Given a sample mean of 2.1 and a population standard deviation of 0.7
from a sample of 10 data points, a 90% confidence interval will have a width of 2.36.
True or False: TABLE 17-8
The superintendent of a school district wanted to predict the percentage of students
passing a sixth-grade proficiency test. She obtained the data on percentage of students
passing the proficiency test (% Passing), daily mean of the percentage of students
attending class (% Attendance), mean teacher salary in dollars (Salaries), and
instructional spending per pupil in dollars (Spending) of 47 schools in the state.
Following is the multiple regression output with Y = % Passing as the dependent
variable, X1 = % Attendance, X2 = Salaries and X3 = Spending:
Referring to Table 17-8, you can conclude that the mean teacher salary individually has
no impact on the mean percentage of students passing the proficiency test, taking into
account the effect of all the other independent variables, at a 1% level of significance
based solely on the 95% confidence interval estimate for β2.
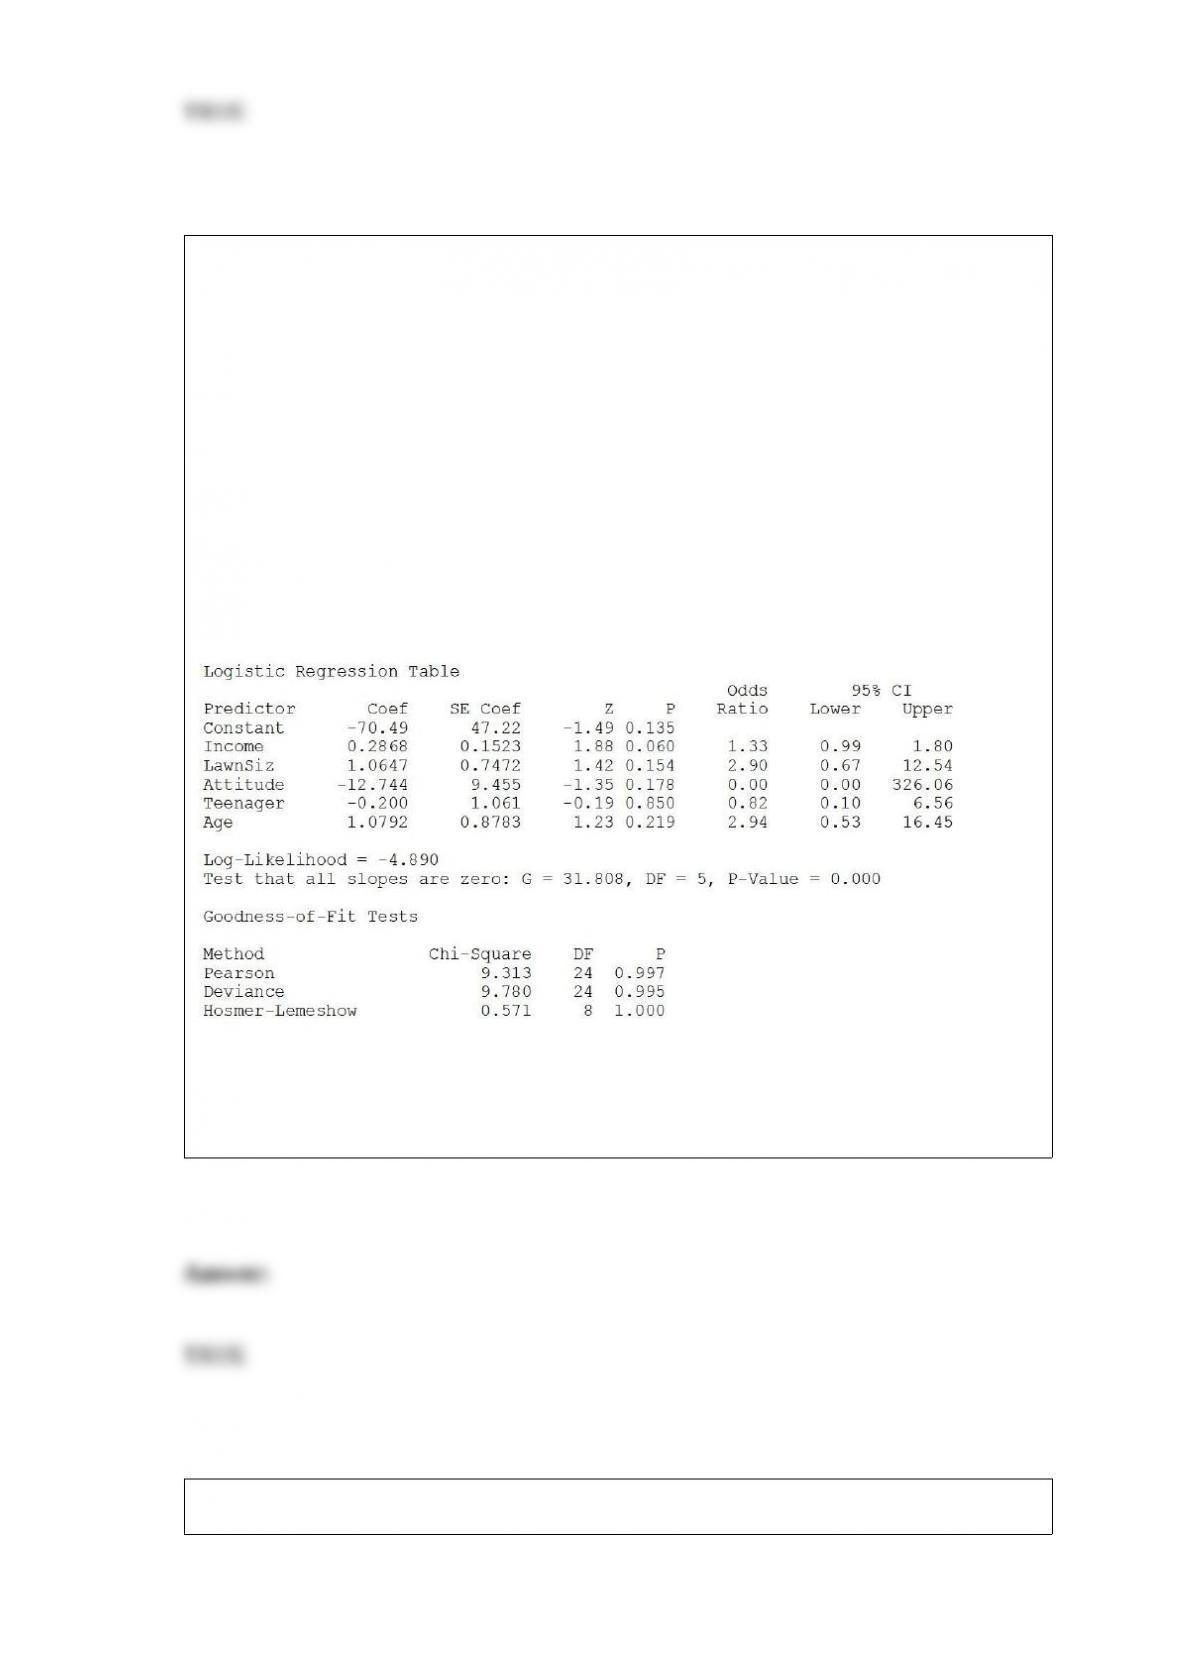
True or False: TABLE 17-12
The marketing manager for a nationally franchised lawn service company would like to
study the characteristics that differentiate home owners who do and do not have a lawn
service. A random sample of 30 home owners located in a suburban area near a large
city was selected; 15 did not have a lawn service (code 0) and 15 had a lawn service
(code 1). Additional information available concerning these 30 home owners includes
family income (Income, in thousands of dollars), lawn size (Lawn Size, in thousands of
square feet), attitude toward outdoor recreational activities (Attitude 0 = unfavorable, 1
= favorable), number of teenagers in the household (Teenager), and age of the head of
the household (Age).
The Minitab output is given below:
Referring to Table 17-12, there is not enough evidence to conclude that LawnSize
makes a significant contribution to the model in the presence of the other independent
variables at a 0.05 level of significance.
True or False: The collection of all the possible events is called a sample space.

TABLE 8-4
The actual voltages of power packs labeled as 12 volts are as follows: 11.77, 11.90,
11.64, 11.84, 12.13, 11.99, and 11.77.
True or False: Referring to Table 8-4, a confidence interval estimate of the population
mean would only be valid if the distribution of voltages is normal.
True or False: The MSE must always be positive.
A real estate builder wishes to determine how house size (House) is influenced by
family income (Income), family size (Size), and education of the head of household
(School). House size is measured in hundreds of square feet, income is measured in
thousands of dollars, and education is in years. The builder randomly selected 50
families and constructed the multiple regression model. The business literature
involving human capital shows that education influences an individual’s annual income.
Combined, these may influence family size. With this in mind, what should the real
estate builder be particularly concerned with when analyzing the multiple regression
model?
A) Randomness of error terms
B) Collinearity
C) Normality of residuals

D) Missing observations
Given the following information, calculate sp
2, the pooled sample variance that should
be used in the pooled-variance t test.
s1
2 = 4 s2
2 = 6
n1 = 16 n2 = 25
A) sp
2 = 6.00
B) sp
2 = 5.00
C) sp
2 = 5.23
D) sp
2 = 4.00
TABLE 12-10
One criterion used to evaluate employees in the assembly section of a large factory is
the number of defective pieces per 1,000 parts produced. The quality control
department wants to find out whether there is a relationship between years of
experience and defect rate. Since the job is repetitious, after the initial training period
any improvement due to a learning effect might be offset by a loss of motivation. A
defect rate is calculated for each worker in a yearly evaluation. The results for 100
workers are given in the table below.
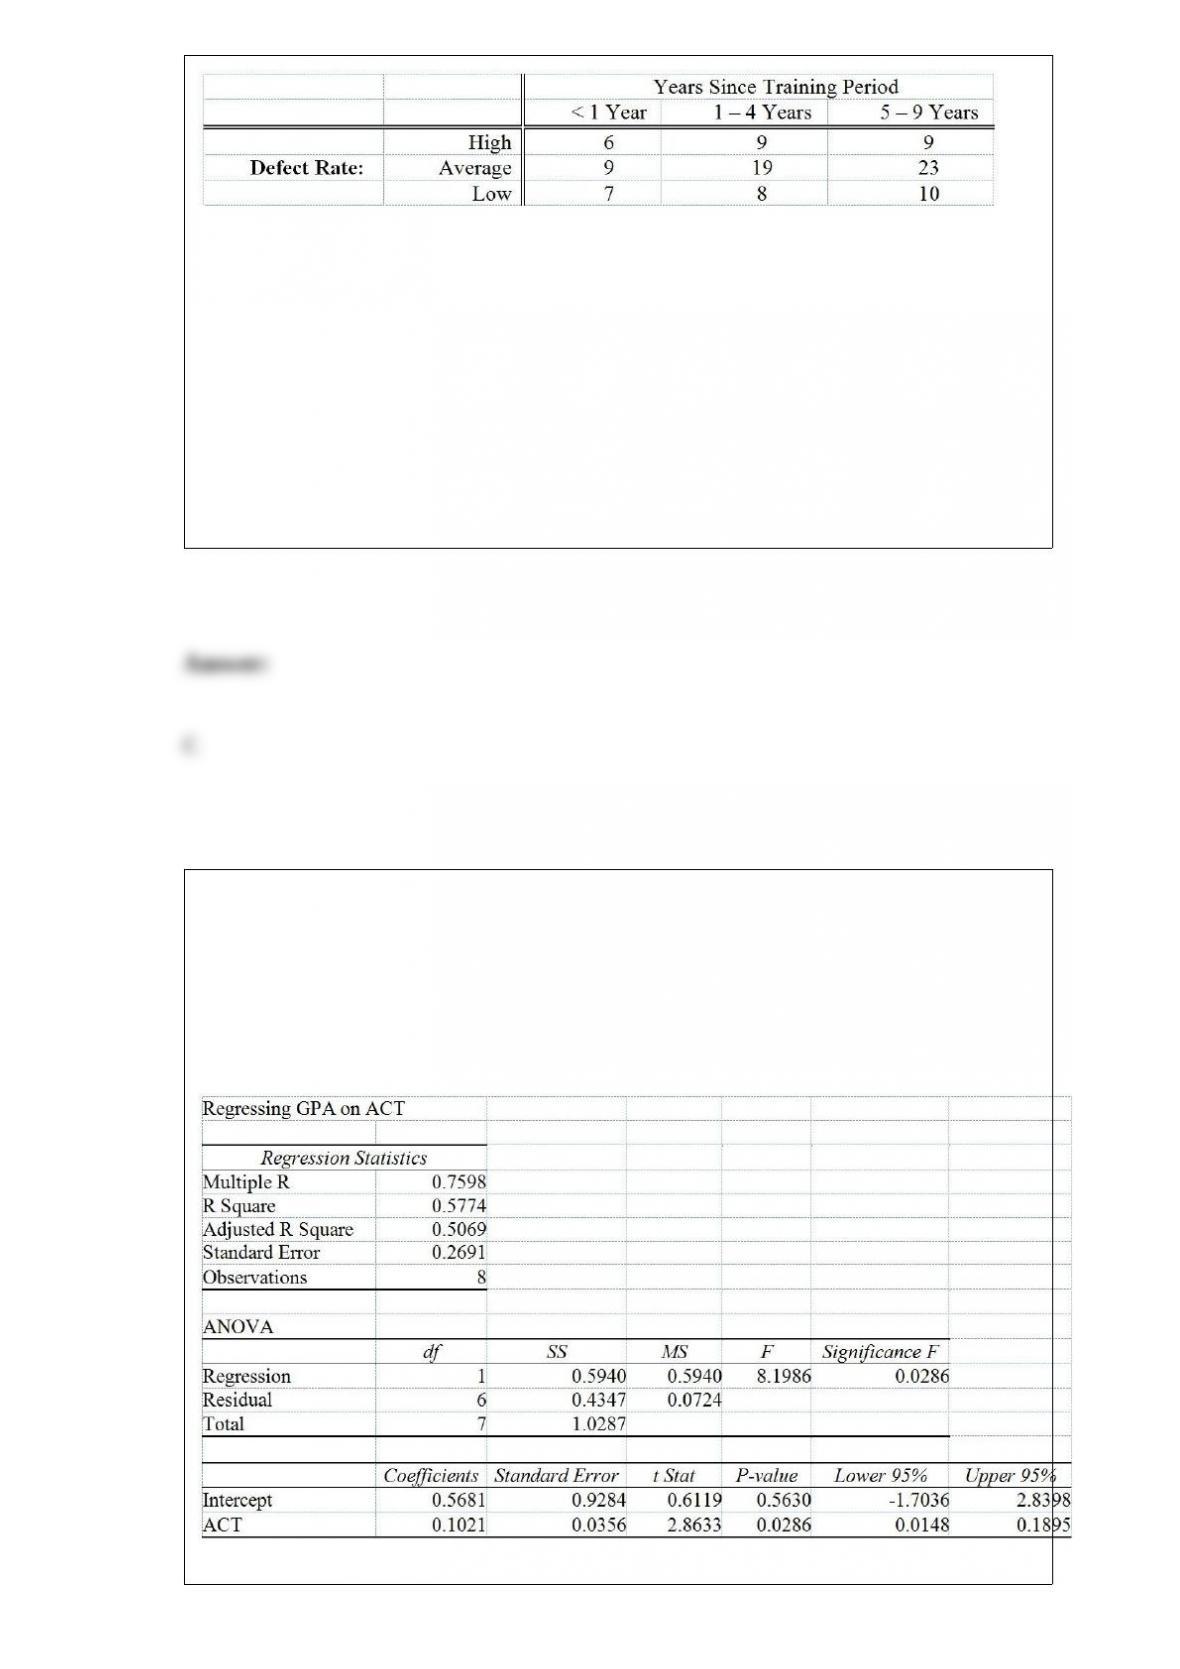
Referring to Table 12-10, what is the expected number of employees with less than 1
year of training time and a high defect rate?
A) 4.17
B) 4.60
C) 5.28
D) 9.17
TABLE 13-8
It is believed that GPA (grade point average, based on a four point scale) should have a
positive linear relationship with ACT scores. Given below is the Excel output for
predicting GPA using ACT scores based on a data set of 8 randomly chosen students
from a Big-Ten university.

Referring to Table 13-8, what are the decision and conclusion on testing whether there
is any linear relationship at 1% level of significance between GPA and ACT scores?
A) Do not reject the null hypothesis; hence there is insufficient evidence to show that
ACT scores and GPA are linearly related.
B) Reject the null hypothesis; hence there is insufficient evidence to show that ACT
scores and GPA are linearly related.
C) Do not reject the null hypothesis; hence there is sufficient evidence to show that
ACT scores and GPA are linearly related.
D) Reject the null hypothesis; hence there is sufficient evidence to show that ACT
scores and GPA are linearly related.
An insurance company evaluates many variables about a person before deciding on an
appropriate rate for automobile insurance. A representative from a local insurance
agency selected a random sample of 15 insured drivers and recorded the amount of
claims each made in the last 3 years. Based on this information, which of the following
will you construct to learn about the mean amount of claims made by the company’s
customer?
A) Confidence interval estimate for the mean using the standard normal distribution
B) Confidence interval estimate for the mean using the Student’s t distribution
C) Confidence interval estimate for the proportion using the standard normal
distribution
D) Confidence interval estimate for the difference between two means using the
standard normal distribution
TABLE 1-2
A Wall Street Journal poll asked 2,150 adults in the United States a series of questions
to find out their view on the U.S. economy.
Referring to Table 1-2, the possible responses to the question “On the scale of 1 to 100
with 1 being extremely anxious and 100 being totally not anxious, rate your level of
anxiety in this U.S. economy” results in
A) a nominal scale variable.
B) an ordinal scale variable.
C) an interval scale variable.
D) a ratio scale variable.
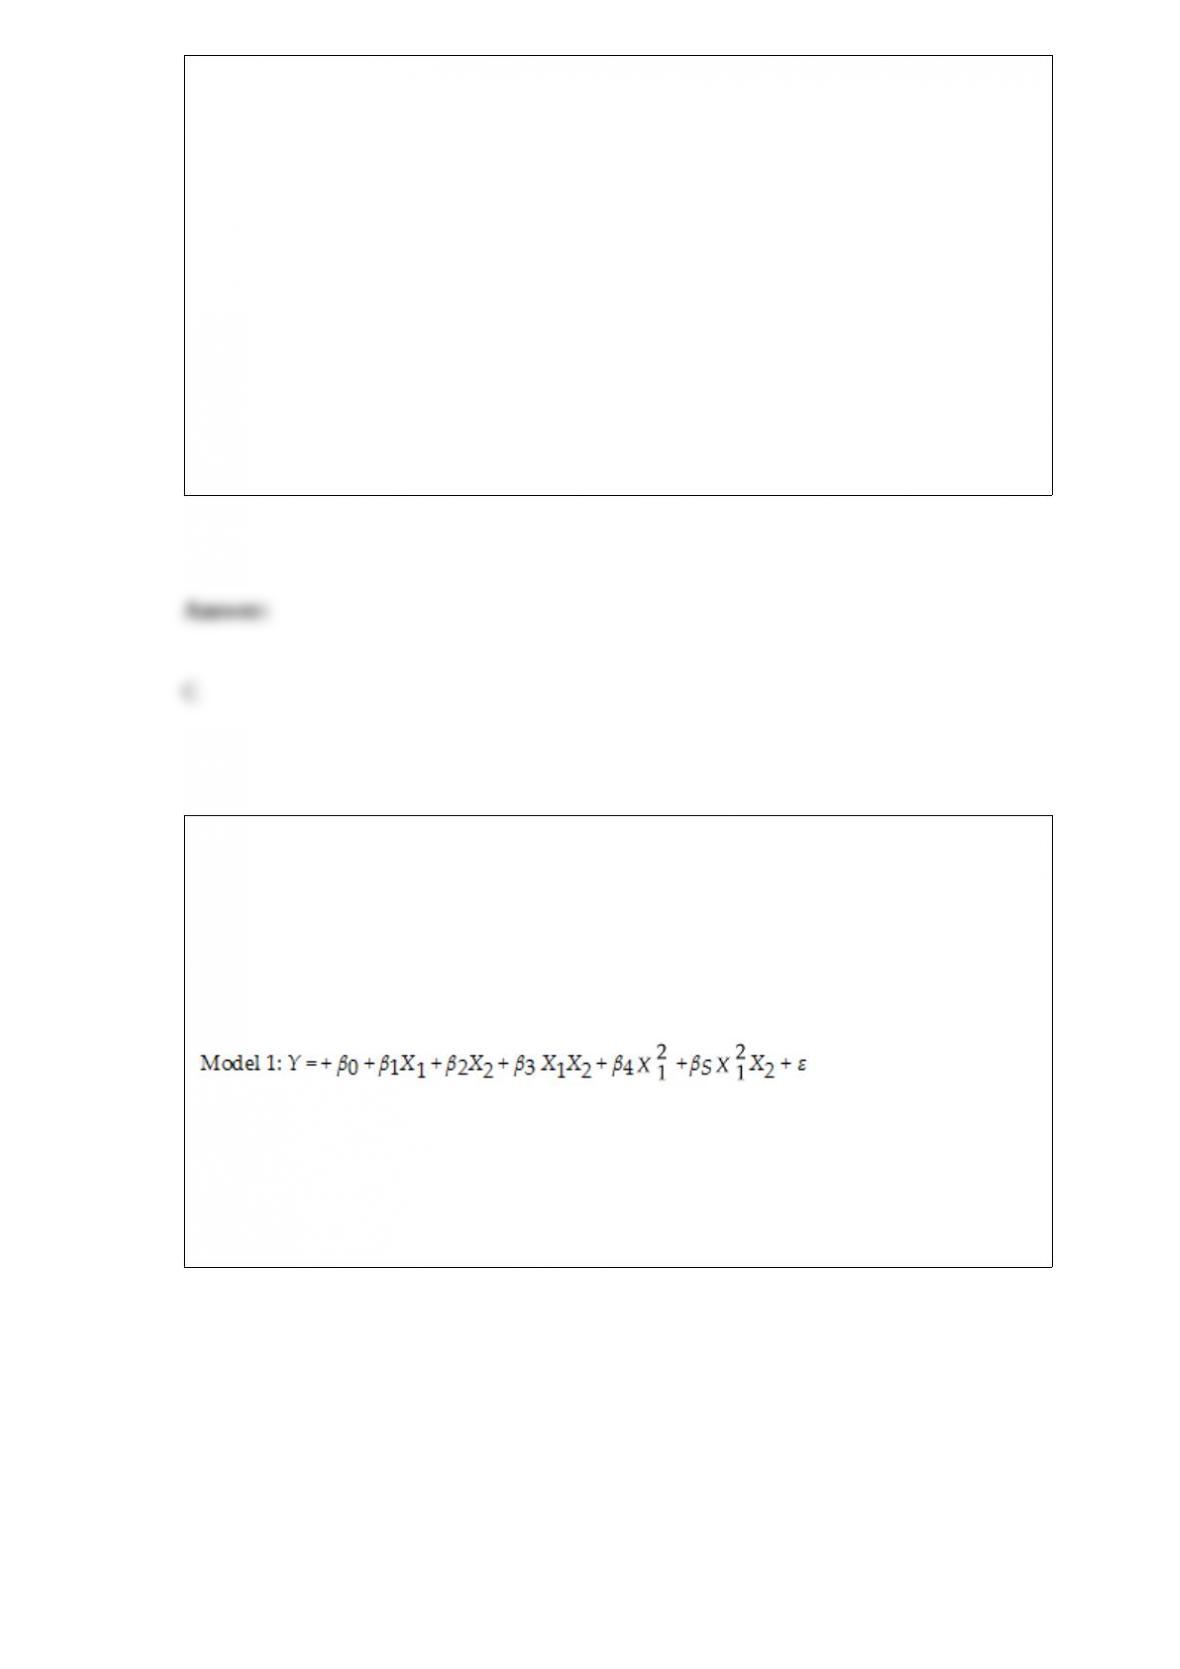
TABLE 15-2
In Hawaii, condemnation proceedings are under way to enable private citizens to own
the property that their homes are built on. Until recently, only estates were permitted to
own land, and homeowners leased the land from the estate. In order to comply with the
new law, a large Hawaiian estate wants to use regression analysis to estimate the fair
market value of the land. The following model was fit to data collected for n = 20
properties, 10 of which are located near a cove.
where Y = Sale price of property in thousands of dollars
X1 = Size of property in thousands of square feet
X2 = 1 if property located near cove, 0 if not
Using the data collected for the 20 properties, the following partial output obtained
from Microsoft Excel is shown:
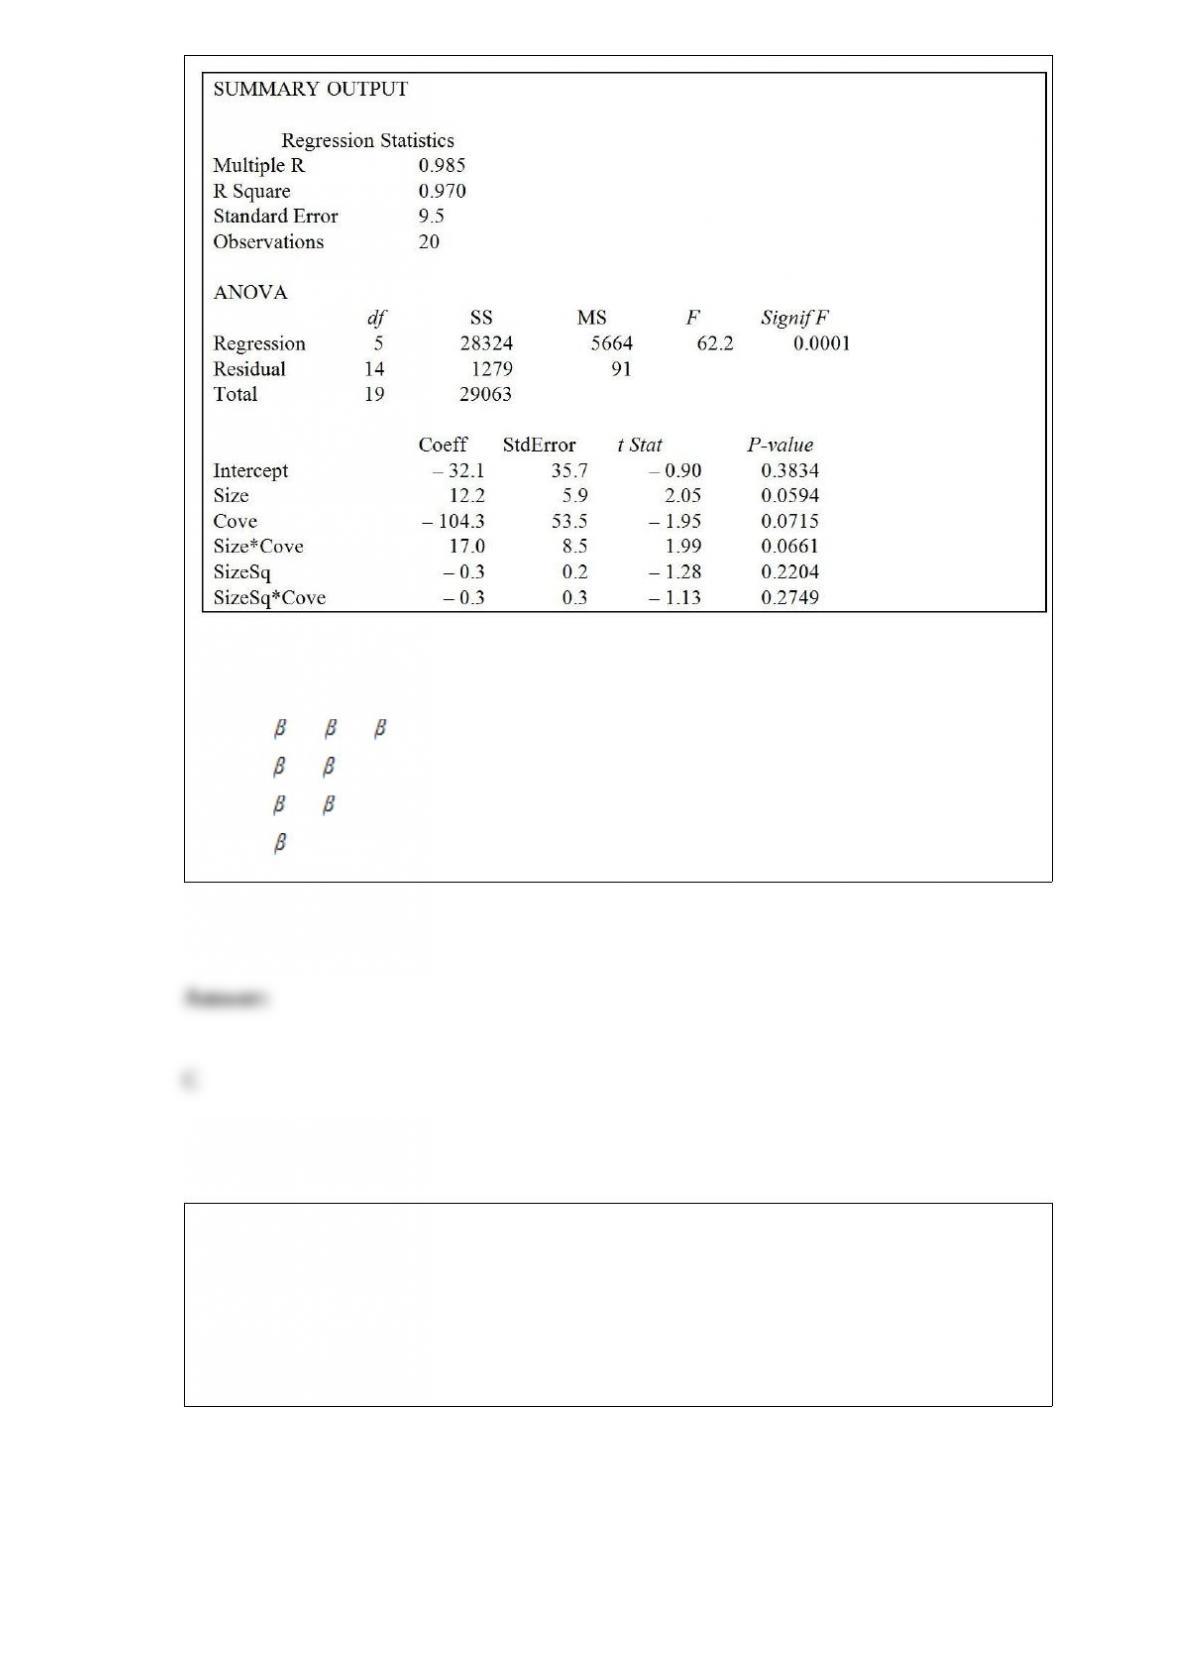
Referring to Table 15-2, given a quadratic relationship between sale price (Y) and
property size (X1), what null hypothesis would you test to determine whether the curves
differ from cove and non-cove properties?
A) H0 : 2 = 3 = 5 = 0
B) H0 : 4 = 5 = 0
C) H0 : 3 = 5 = 0
D) H0 : 2 = 0
TABLE 13-2
A candy bar manufacturer is interested in trying to estimate how sales are influenced by
the price of their product. To do this, the company randomly chooses 6 small cities and
offers the candy bar at different prices. Using candy bar sales as the dependent variable,
the company will conduct a simple linear regression on the data below:
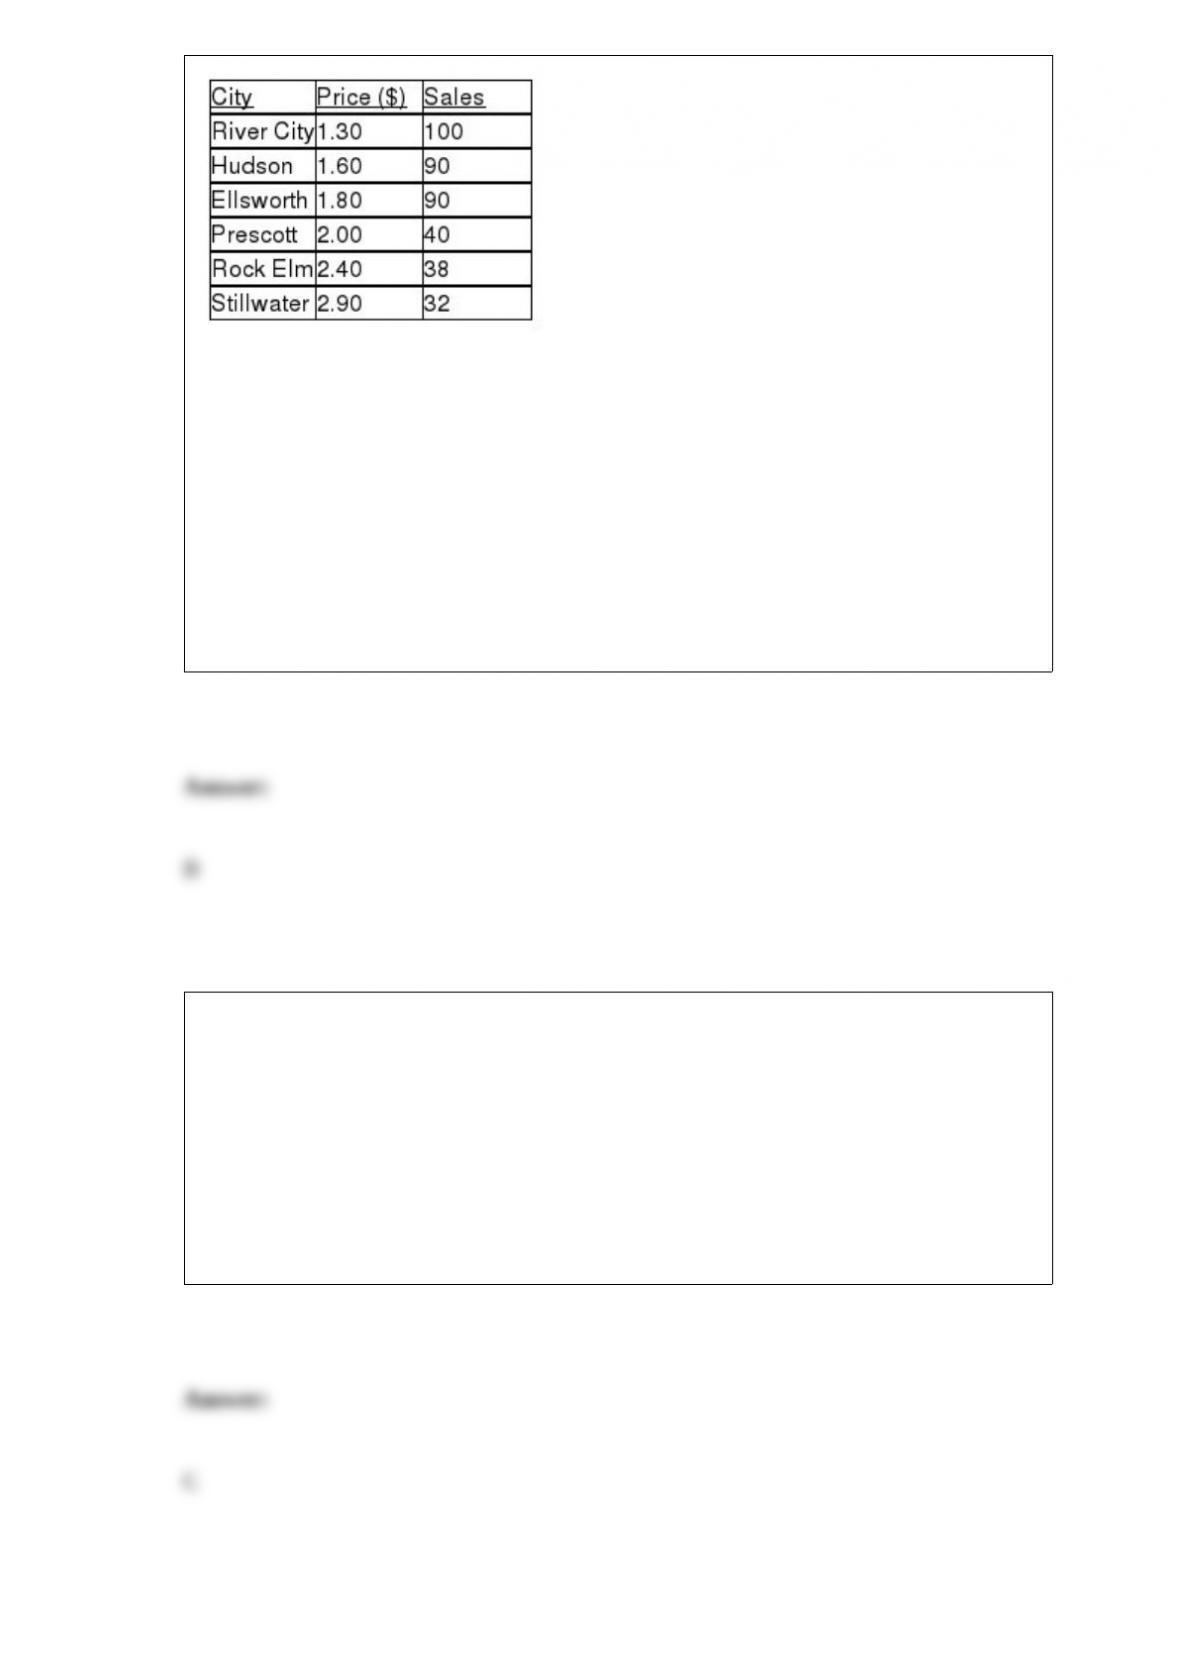
Referring to Table 13-2, if the price of the candy bar is set at $2, the predicted sales will
be
A) 30.
B) 65.
C) 90.
D) 100.
Referring to Table 14-17, which of the following is a correct statement?
A) On average, those who are in a management position are estimated to stay jobless
shorter by approximately 1.4448 weeks while holding constant the effects of age.
B) On average, those who are in a management position are estimated to stay jobless
longer by approximately 1.4448 weeks while holding constant the effects of age.
C) On average, those who are in a management position are estimated to stay jobless
shorter by approximately 22.5761 weeks while holding constant the effects of age.
D) On average, those who are in a management position are estimated to stay jobless
longer by approximately 22.5761 weeks while holding constant the effects of age.
Referring to Table 14-9, if the variable that measures the number of
firms that manufacture automobile parts in and around the city is
removed from the multiple regression model, which of the following
would be true?
TABLE 14-9
You decide to predict gasoline prices in different cities and towns in
the United States for your term project. Your dependent variable is
price of gasoline per gallon and your explanatory variables are per
capita income and the number of firms that manufacture automobile
parts in and around the city. You collected data of 32 cities and
obtained a regression sum of squares SSR= 122.8821. Your computed
value of standard error of the estimate is 1.9549.
A) The adjusted r2 will definitely increase.
B) The adjusted r2 cannot increase.
C) The coefficient of multiple determination will not increase.
D) The coefficient of multiple determination will definitely increase.
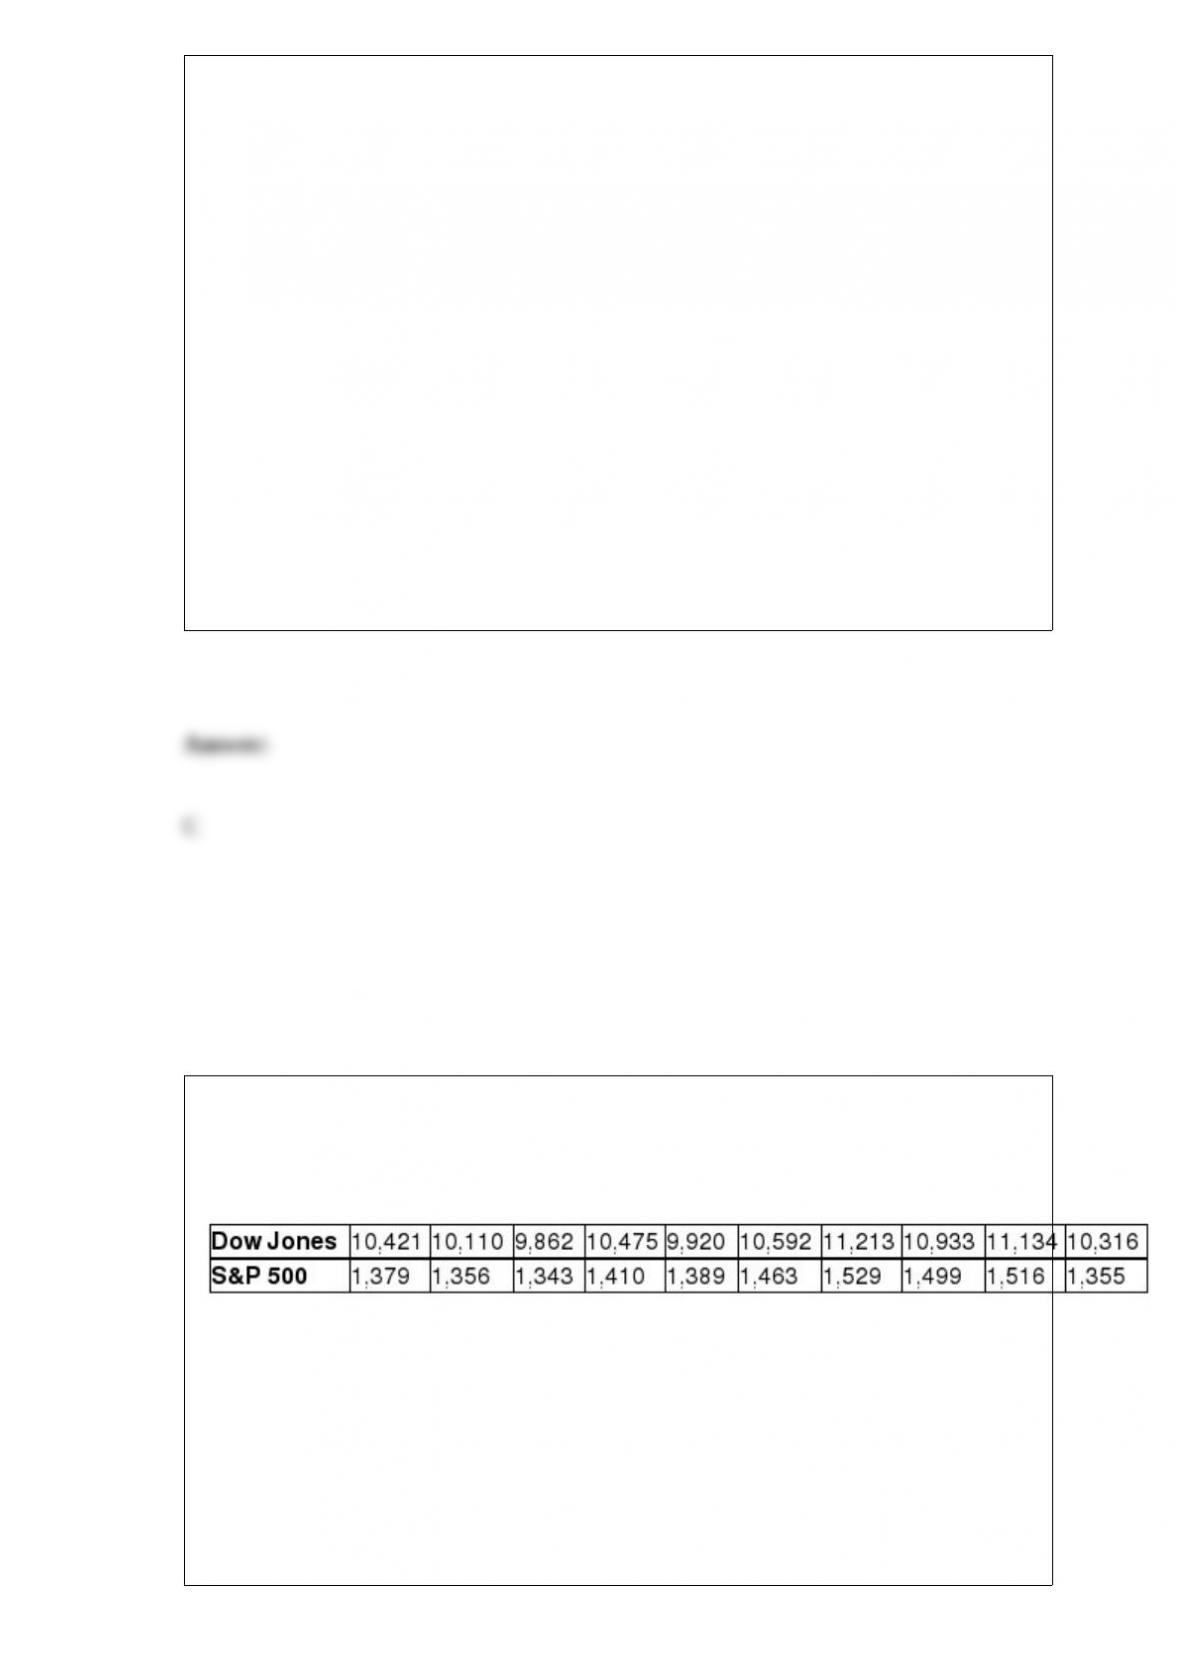
TABLE 3-11
Given below are the closing prices for the Dow Jones Industrial Average (DJIA) and the
Standard & Poor’s (S&P) 500 Index over 10 weeks.
Referring to Table 3-11, for the week when the DJIA is high, you will expect the S&P
index in that week to
A) be about the same value as the DJIA.
B) be low.
C) be high.
D) have no relationship with the DJIA value.
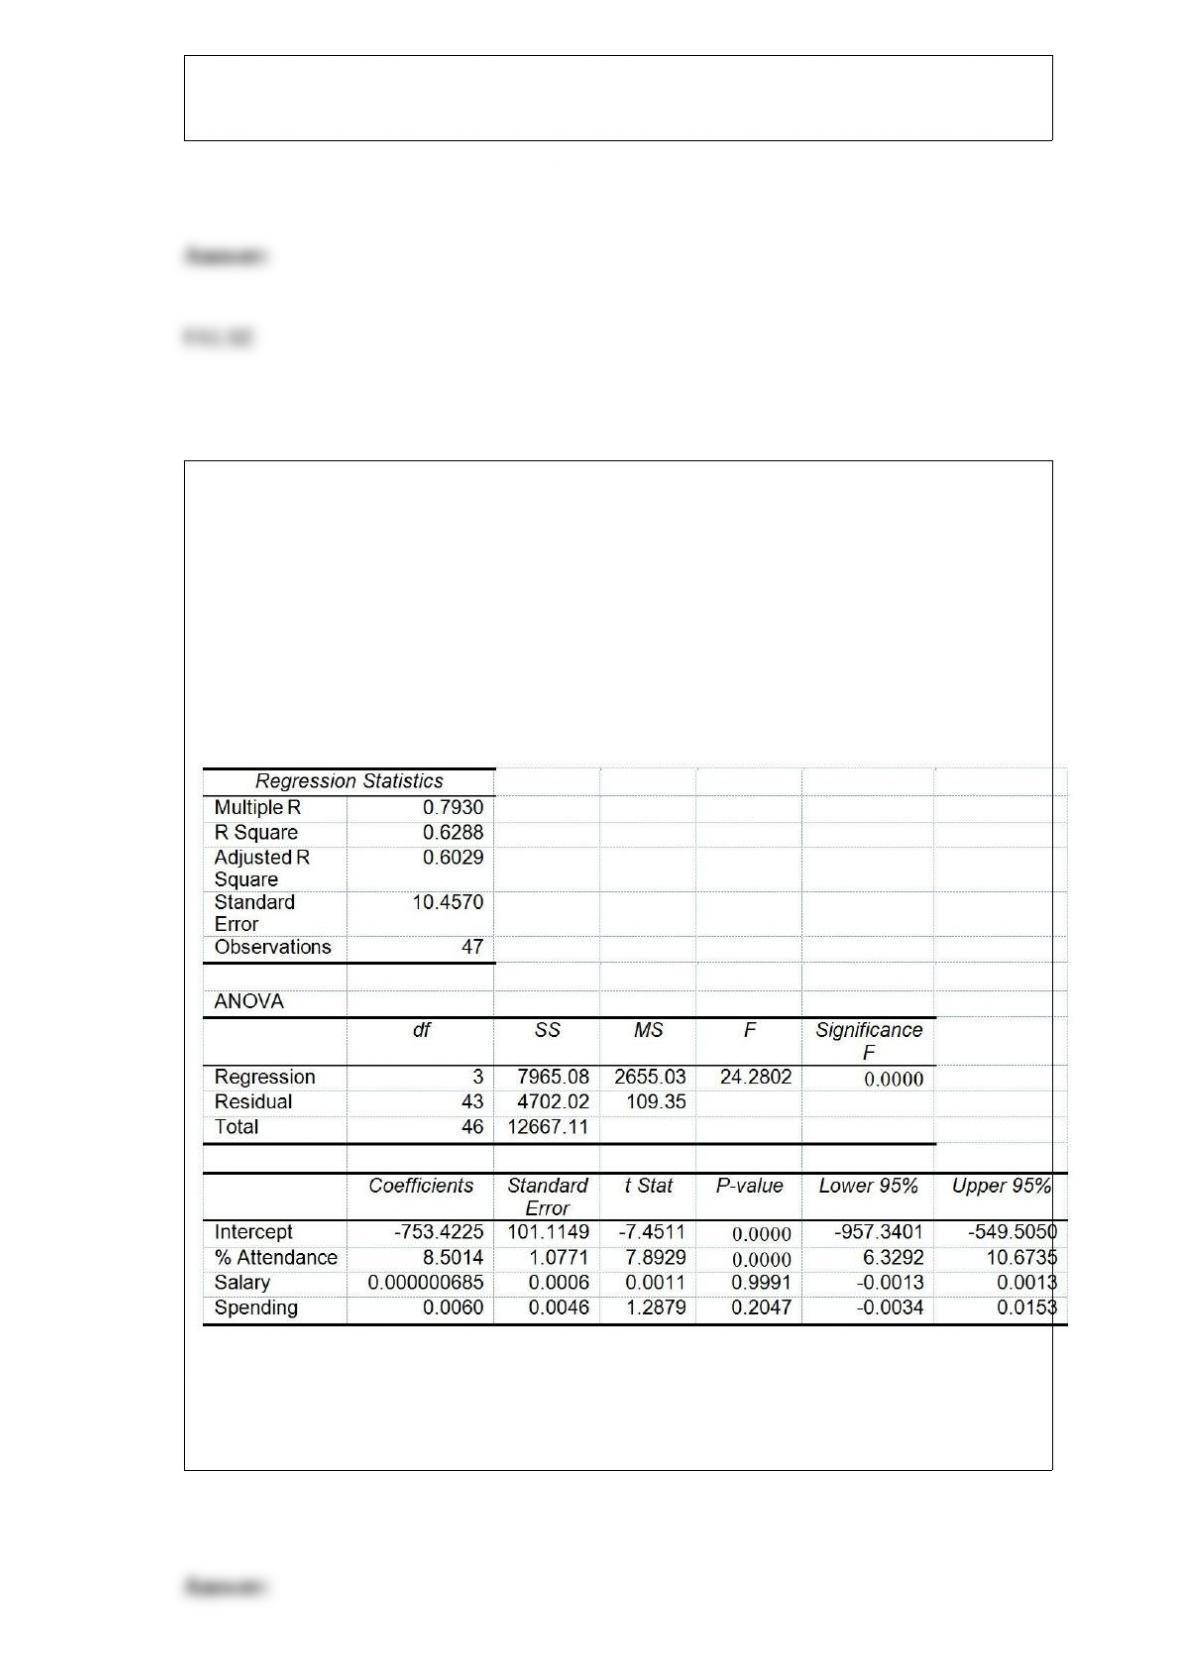
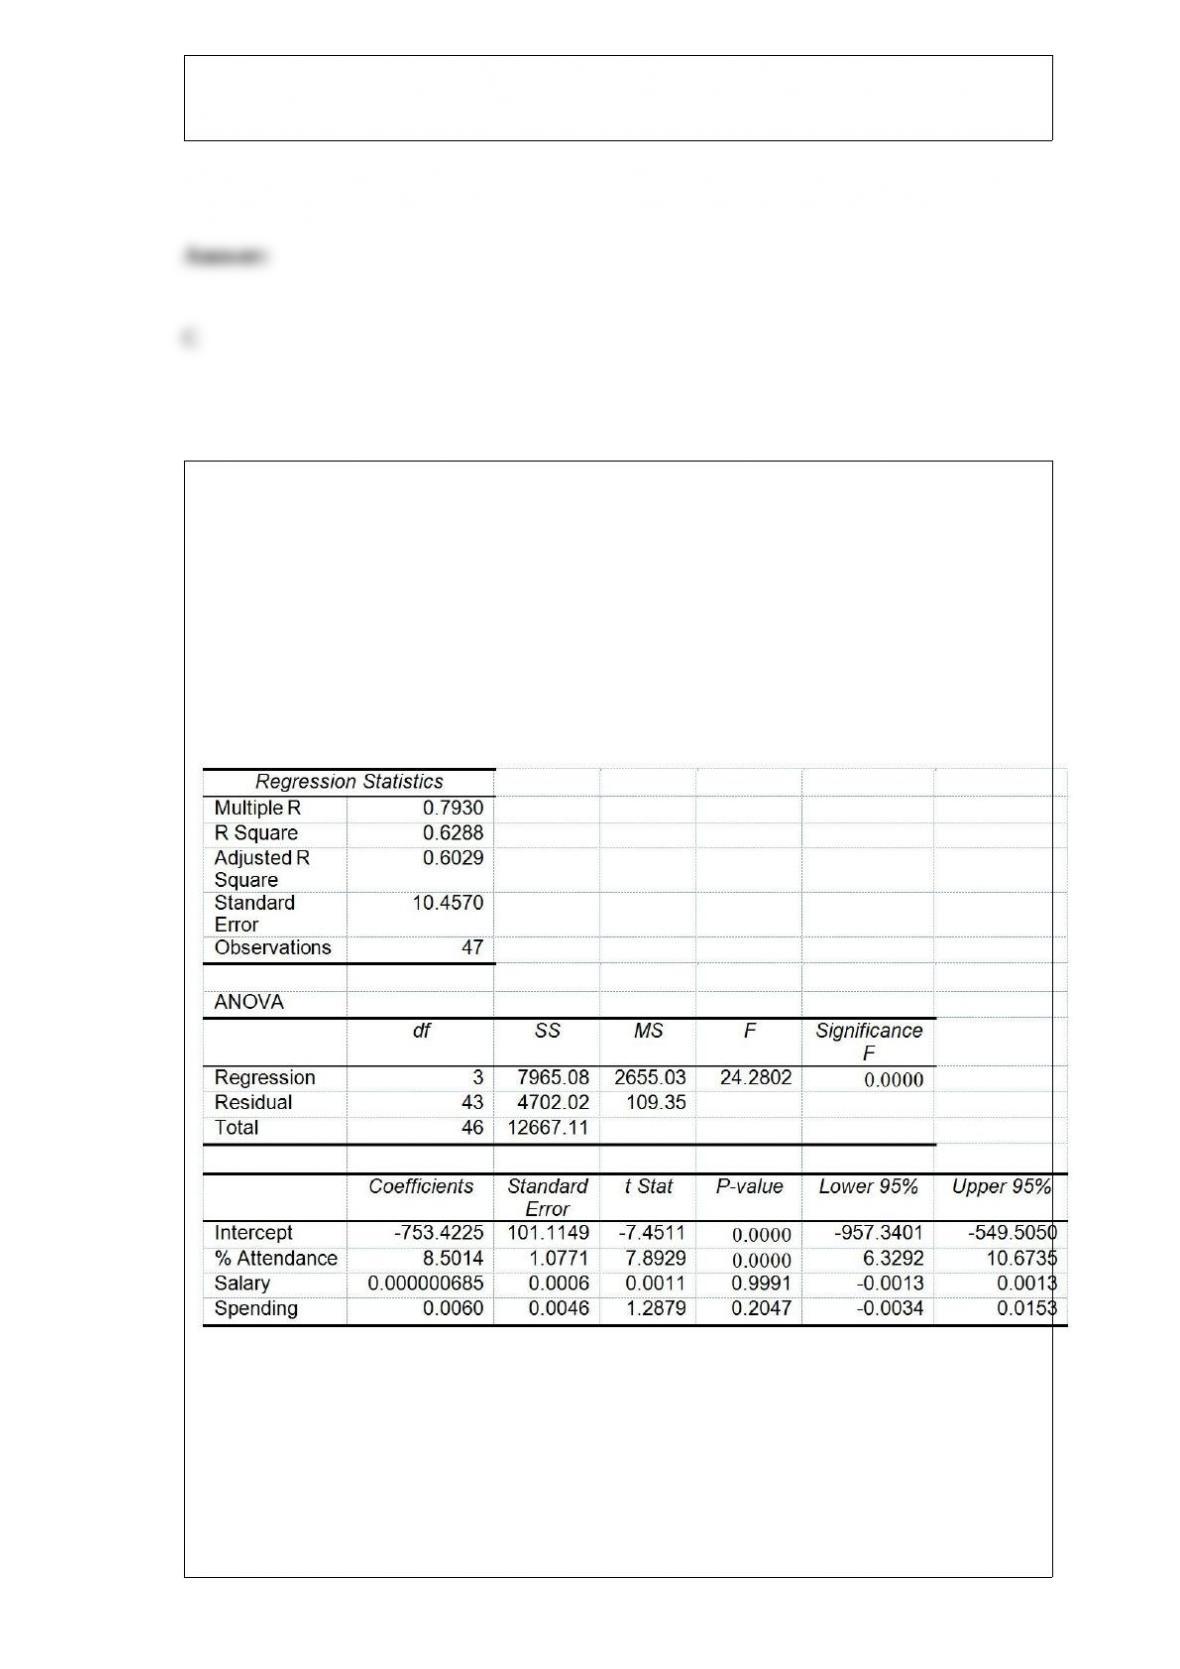
TABLE 17-8
The superintendent of a school district wanted to predict the percentage of students
passing a sixth-grade proficiency test. She obtained the data on percentage of students
passing the proficiency test (% Passing), daily mean of the percentage of students
attending class (% Attendance), mean teacher salary in dollars (Salaries), and
instructional spending per pupil in dollars (Spending) of 47 schools in the state.
Following is the multiple regression output with Y = % Passing as the dependent
variable, X1 = % Attendance, X2 = Salaries and X3 = Spending:
Referring to Table 17-8, which of the following is the correct null hypothesis to test
whether the daily mean of the percentage of students attending class has any effect on
the percentage of students passing the proficiency test, taking into account the effect of
all the other independent variables?
A) H0 : β0 = 0
B) H0 : β1 = 0
C) H0 : β2 = 0

D) H0 : β3 = 0
Tim was planning for a meeting with his boss to discuss a raise in his annual salary. In
preparation, he wanted to use the Consumer Price Index to determine the percentage
increase in his real (inflation-adjusted) salary over the last three years. Which of the 4
methods of data collection was involved when he used the Consumer Price Index?
A) published sources
B) experimentation
C) surveying
D) observation
Suppose a sample of n = 50 items is selected from a population of manufactured
products and the weight, X, of each item is recorded. Prior experience has shown that
the weight has a probability distribution with = 6 ounces and = 2.5 ounces. Which of
the following is true about the sampling distribution of the sample mean if a sample size
of 15 is selected?
A) The mean of the sampling distribution is 6 ounces.
B) The standard deviation of the sampling distribution is 2.5 ounces.
C) The shape of the sampling distribution is approximately normal.
D) All of the above are correct.
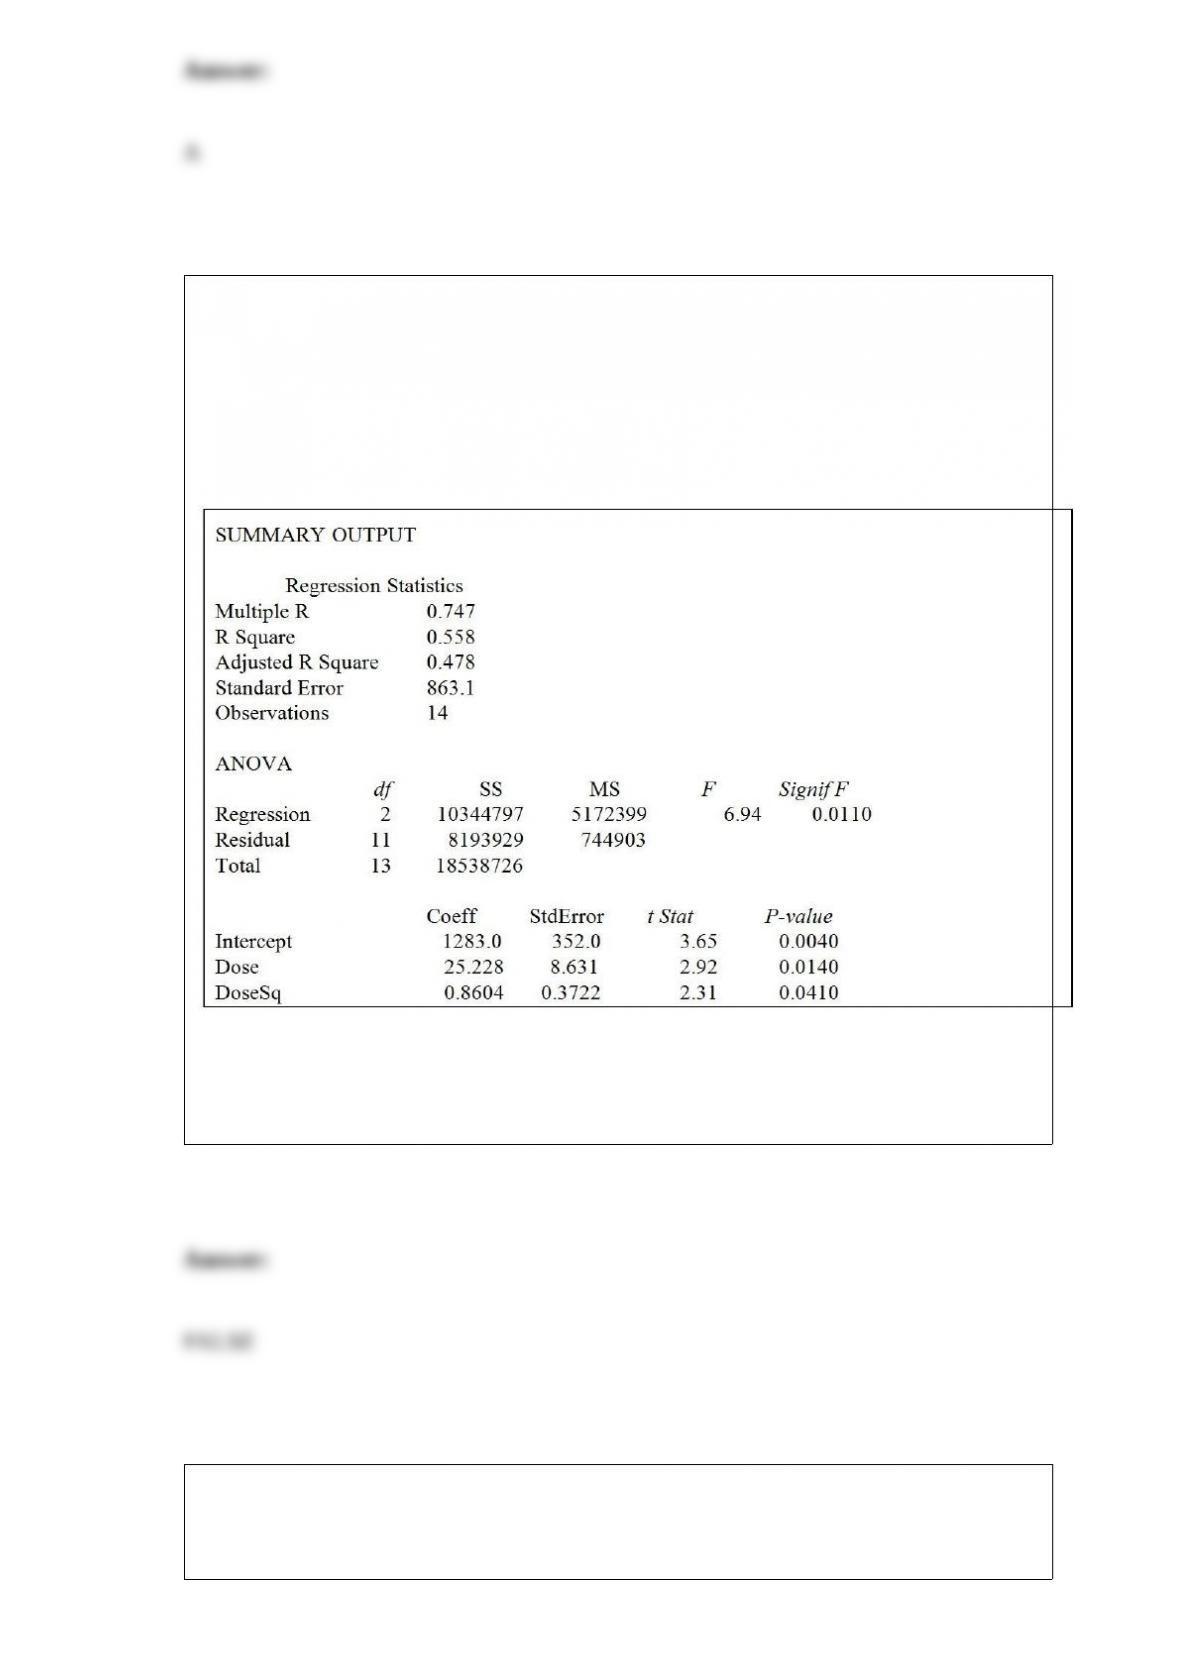
TABLE 15-3
A chemist employed by a pharmaceutical firm has developed a muscle relaxant. She
took a sample of 14 people suffering from extreme muscle constriction. She gave each a
vial containing a dose (X) of the drug and recorded the time to relief (Y) measured in
seconds for each. She fit a curvilinear model to this data. The results obtained by
Microsoft Excel follow
True or False: Referring to Table 15-3, suppose the chemist decides to use an F test to
determine if there is a significant curvilinear relationship between time and dose. If she
chooses to use a level of significance of 0.01 she would decide that there is a significant
curvilinear relationship.
TABLE 19-5
The following payoff table shows profits associated with a set of 2 alternatives under 3
possible events.
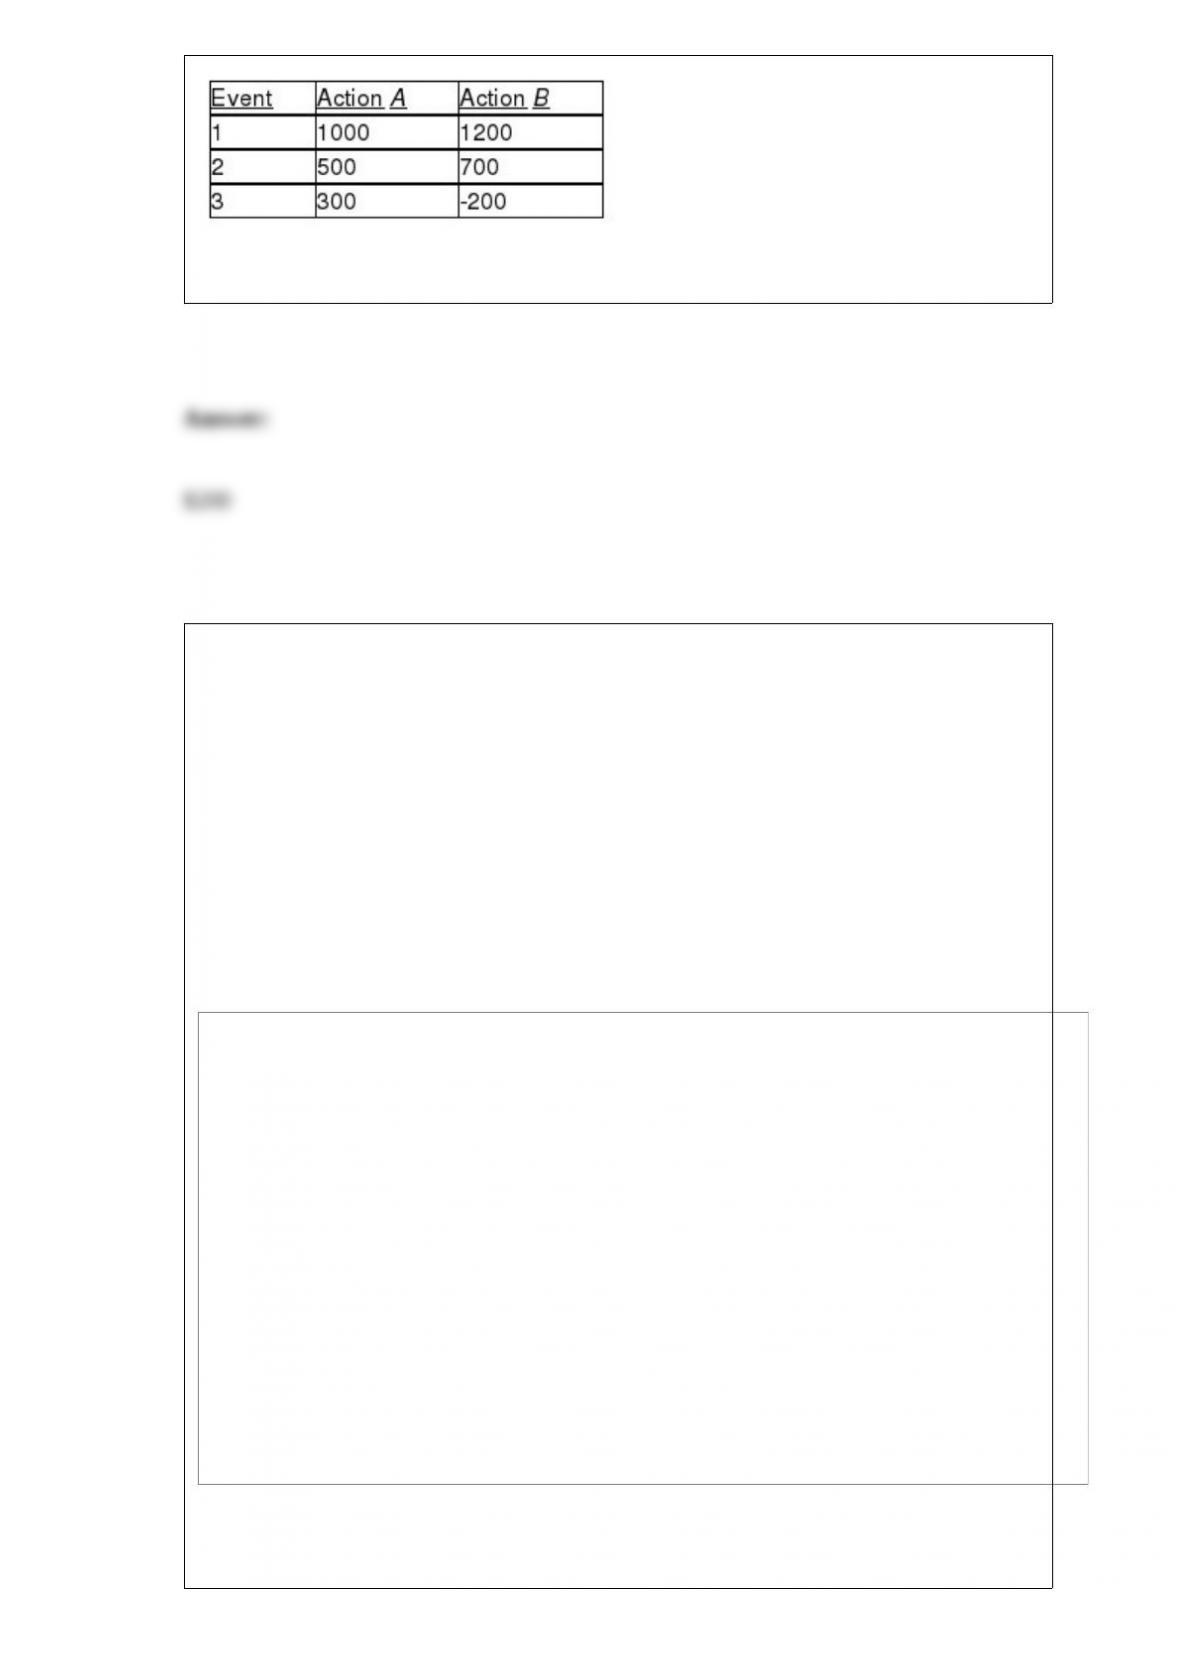
Suppose that the probability of Event 1 is 0.2, Event 2 is 0.5, and Event 3 is 0.3.
Referring to Table 19-5, what is the opportunity loss for Action A with Event 1?
TABLE 14-15
The superintendent of a school district wanted to predict the
percentage of students passing a sixth-grade proficiency test. She
obtained the data on percentage of students passing the proficiency
test (% Passing), mean teacher salary in thousands of dollars
(Salaries), and instructional spending per pupil in thousands of dollars
(Spending) of 47 schools in the state.
Following is the multiple regression output with Y = % Passing as the
dependent variable, X1 = Salaries and X2 = Spending:
Referring to Table 14-15, what is the p-value of the test statistic to
determine whether there is a significant relationship between
percentage of students passing the proficiency test and the entire set
of explanatory variables?
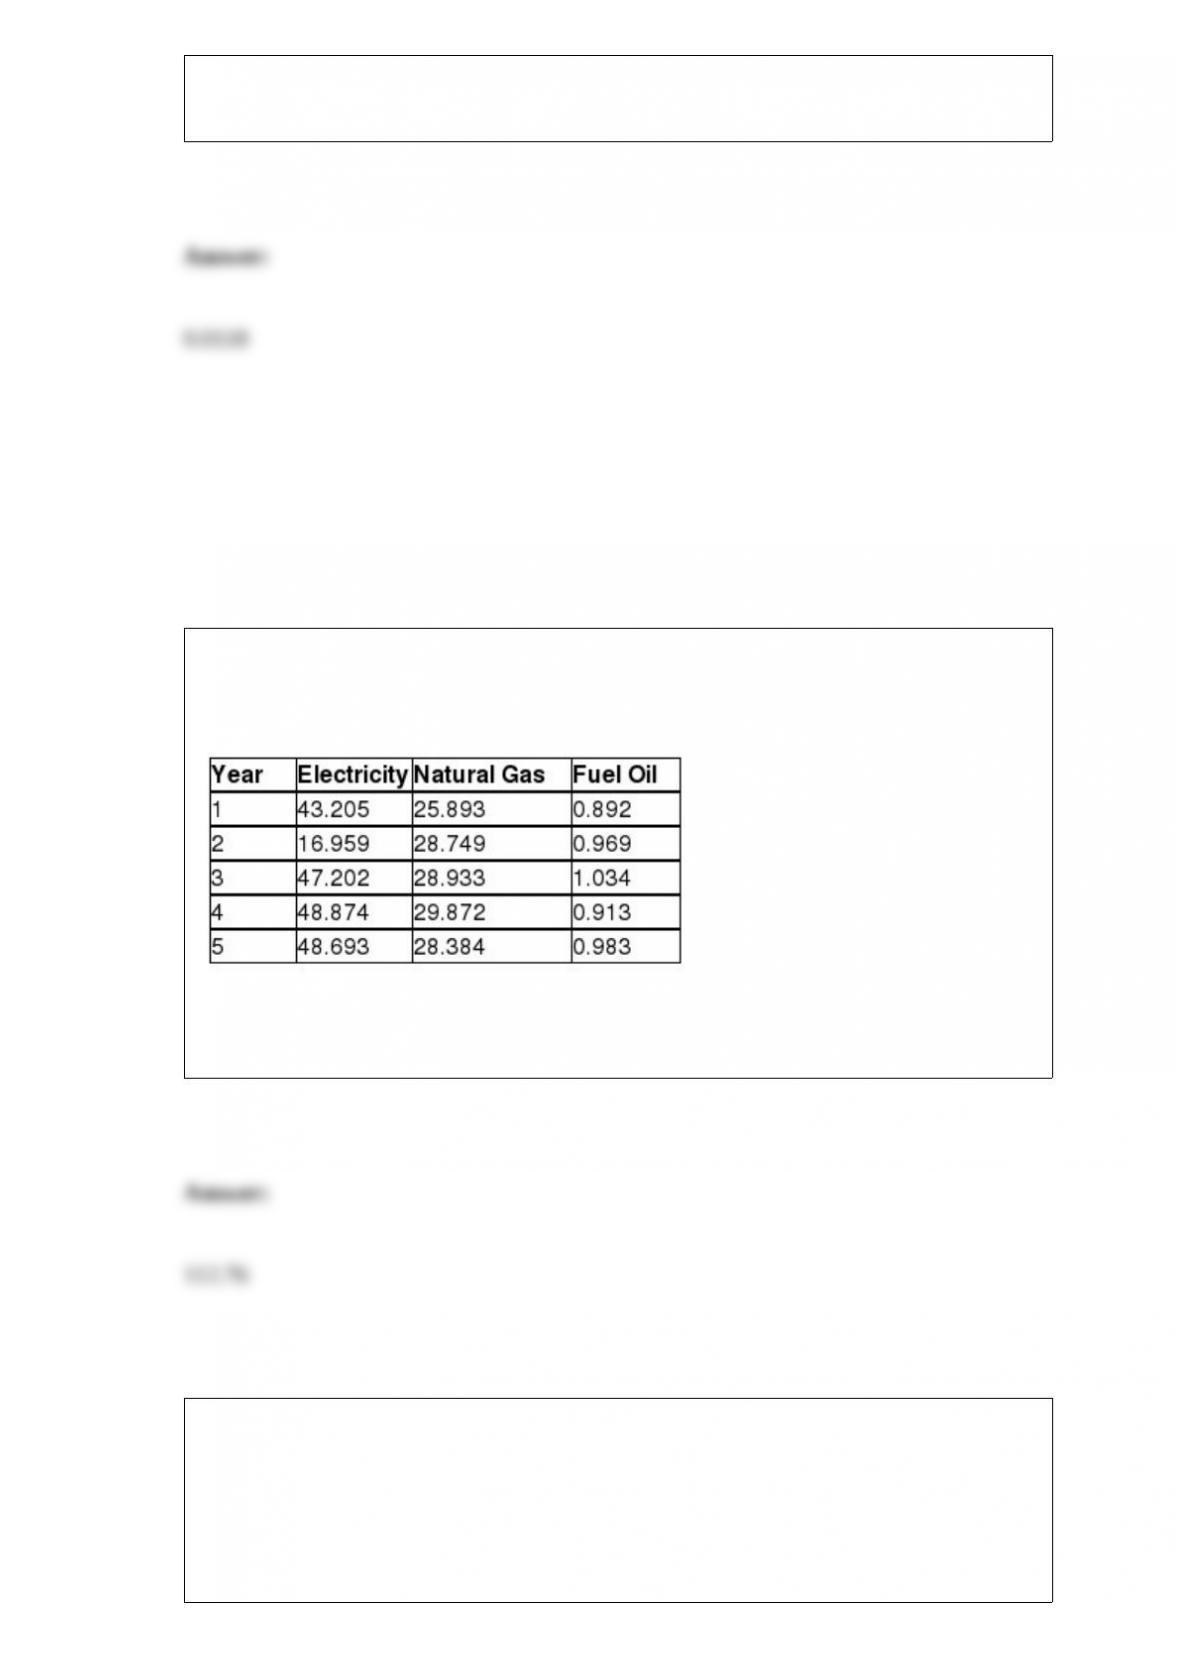
TABLE 16-15
Given below are the average prices for three types of energy products for five
consecutive years.
Referring to Table 16-15, what is the Laspeyres price index for the group of three
energy items in year 4 for a family that consumed 15 units of electricity, 24 units of
natural gas and 200 units of fuel oil in year 1 using year 1 as the base year?
TABLE 17-5
You worked as an intern at We Always Win Car Insurance Company last summer. You
notice that individual car insurance premiums depend very much on the age of the
individual, the number of traffic tickets received by the individual, and the population
density of the city in which the individual lives. You performed a regression analysis in
EXCEL and obtained the following information:
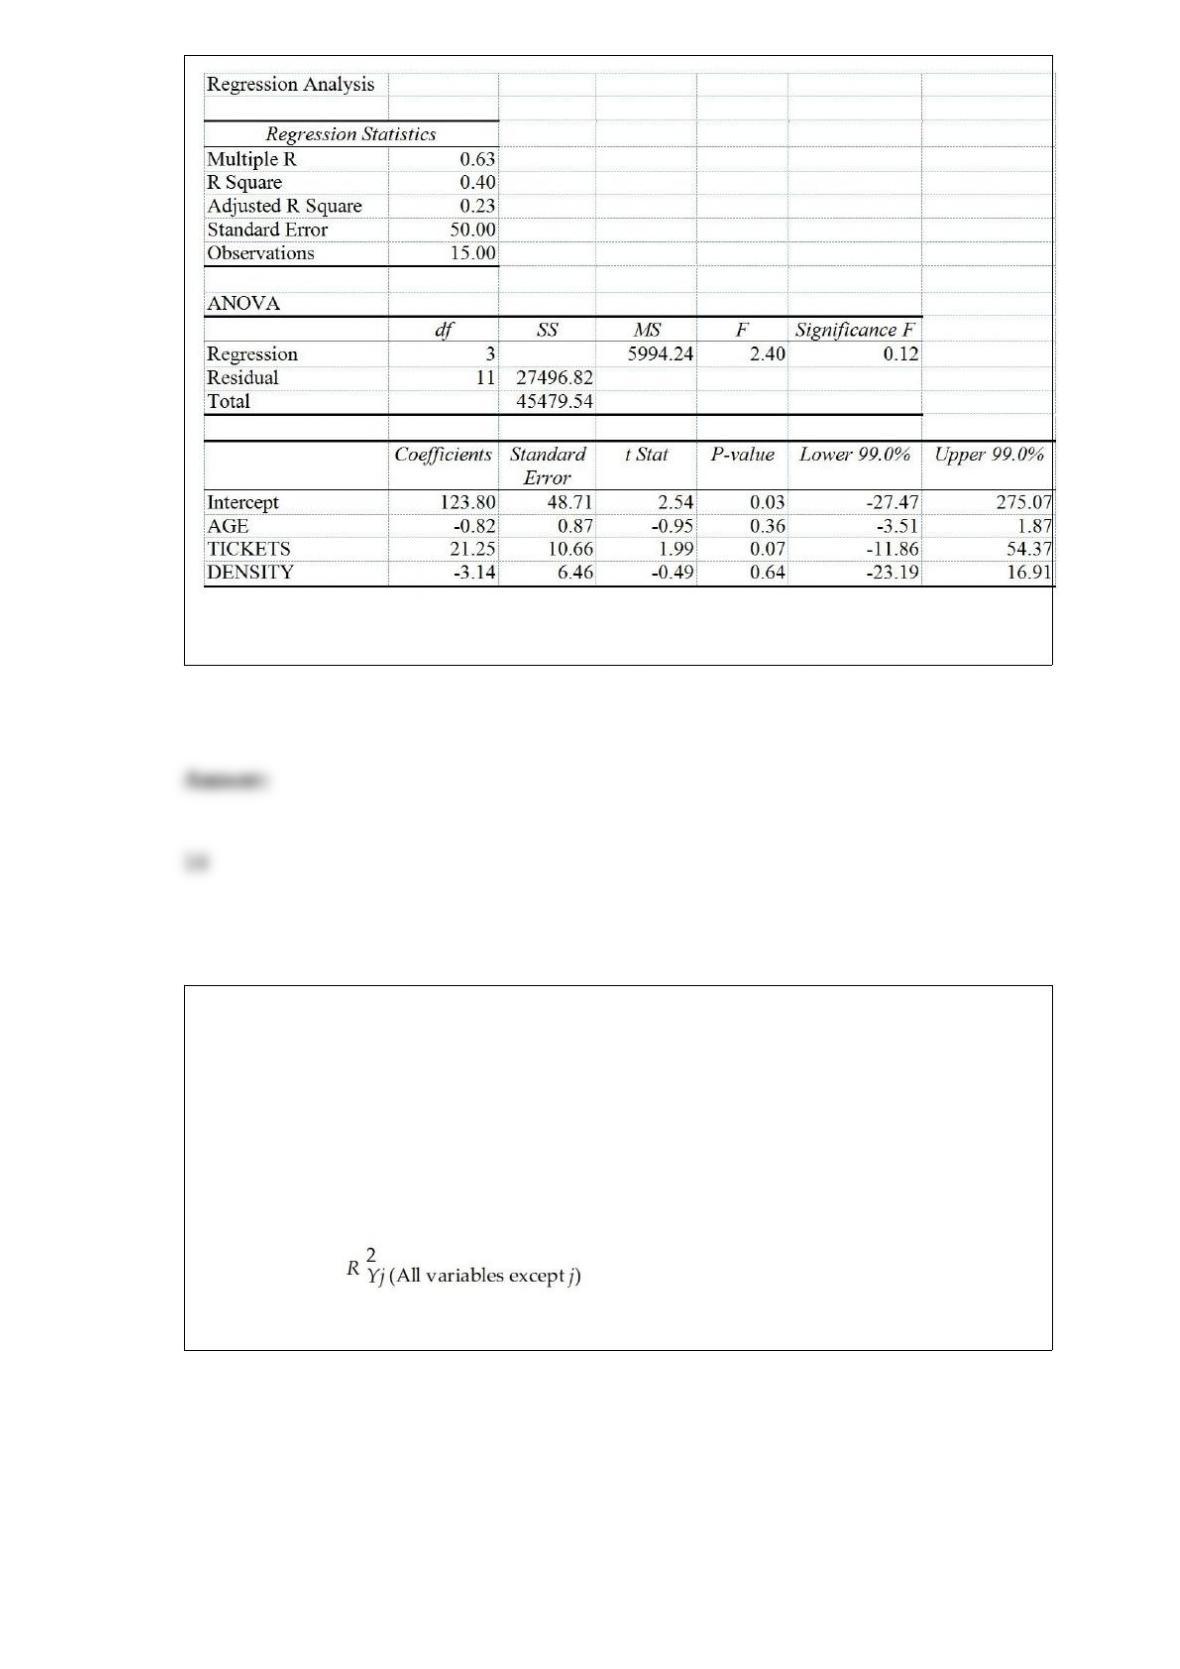
Referring to Table 17-5, the total degrees of freedom that are missing in the ANOVA
table should be ________.
TABLE 17-10
Given below are results from the regression analysis where the dependent variable is
the number of weeks a worker is unemployed due to a layoff (Unemploy) and the
independent variables are the age of the worker (Age), the number of years of education
received (Edu), the number of years at the previous job (Job Yr), a dummy variable for
marital status (Married: 1 = married, 0 = otherwise), a dummy variable for head of
household (Head: 1 = yes, 0 = no) and a dummy variable for management position
(Manager: 1 = yes, 0 = no). We shall call this Model 1. The coefficient of partial
determination ( ) of each of the 6 predictors are, respectively,
0.2807, 0.0386, 0.0317, 0.0141, 0.0958, and 0.1201.
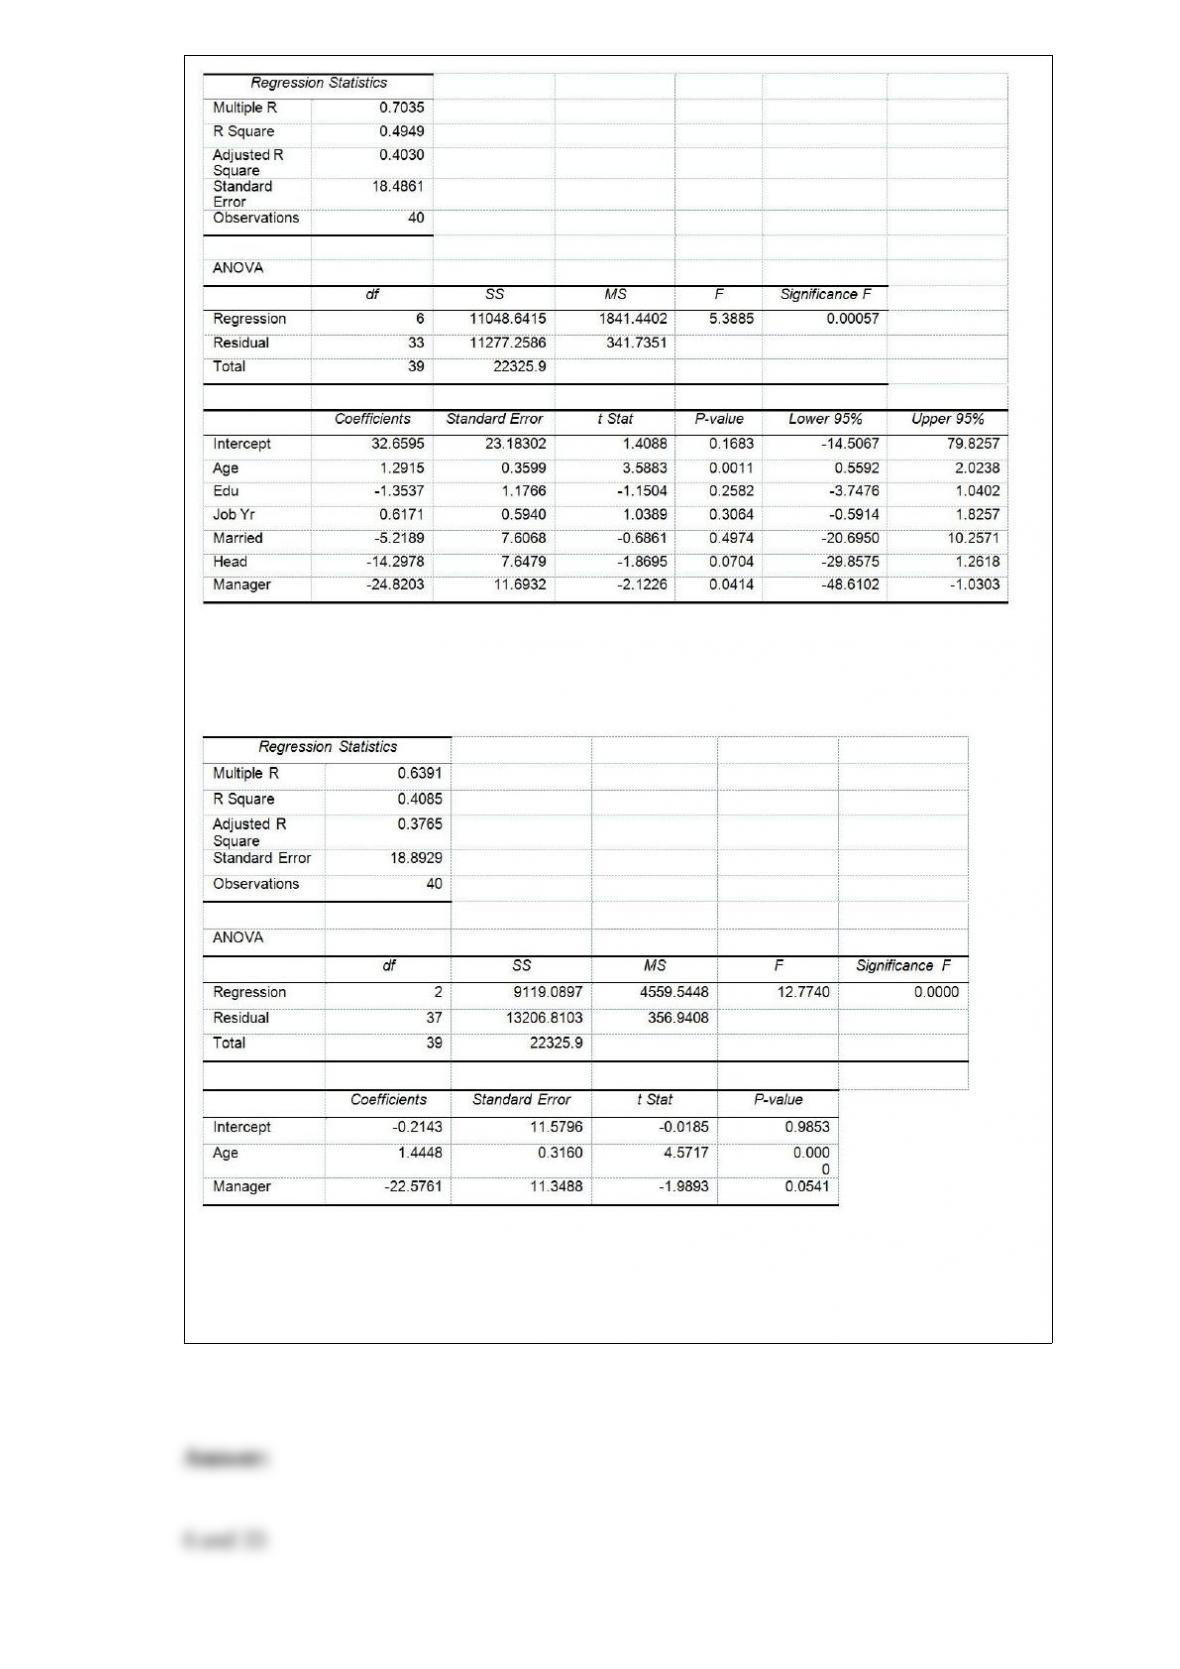
Model 2 is the regression analysis where the dependent variable is Unemploy and the
independent variables are Age and Manager. The results of the regression analysis are
given below:
Referring to Table 17-10, Model 1, what are the numerator and denominator degrees of
freedom, respectively, for the test statistic to determine whether there is a significant
relationship between the number of weeks a worker is unemployed due to a layoff and
the entire set of explanatory variables?
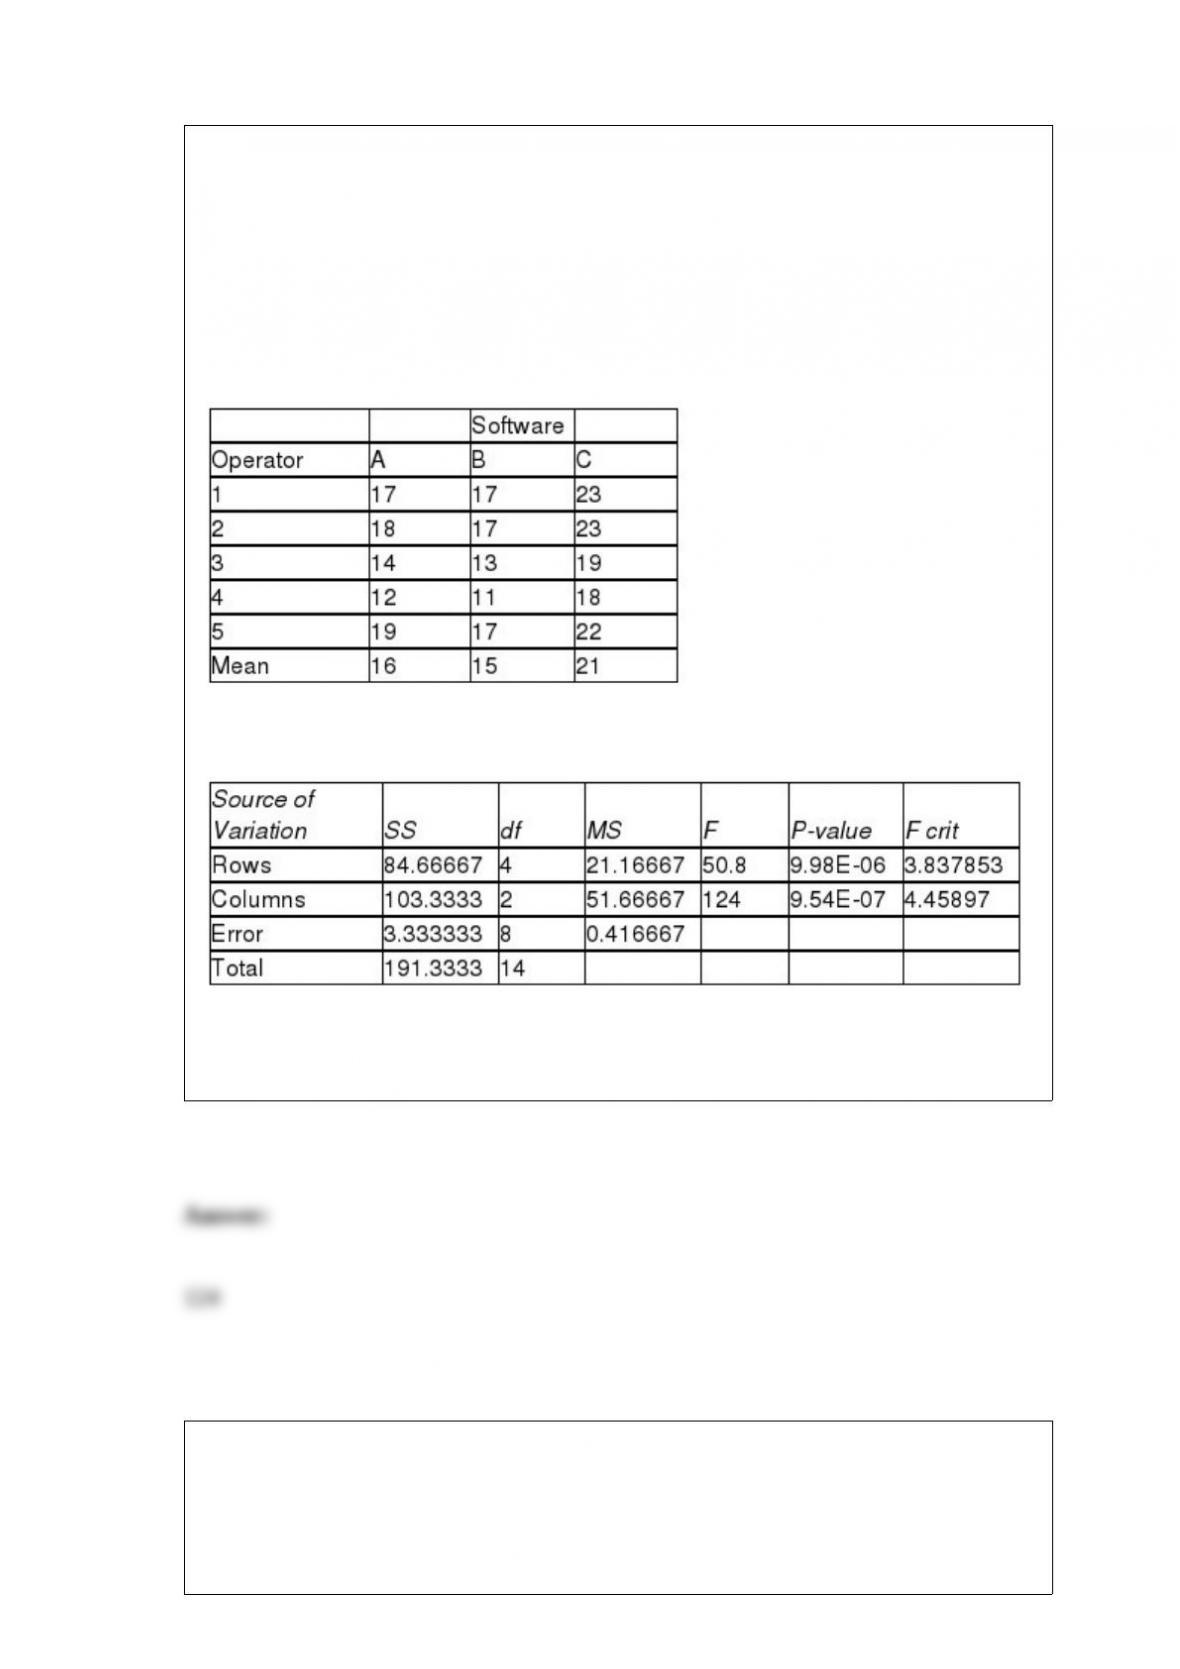
TABLE 11-8
An important factor in selecting database software is the time required for a user to
learn how to use the system. To evaluate three potential brands (A, B and C) of database
software, a company designed a test involving five different employees. To reduce
variability due to differences among employees, each of the five employees is trained
on each of the three different brands. The amount of time (in hours) needed to learn
each of the three different brands is given below:
Below is the Excel output for the randomized block design:
Referring to Table 11-8, what is the value of the test statistic for the randomized block
F test for the difference in the means?
Referring to Table 14-4, ________% of the variation in the house size can be explained
by the variation in the family income while holding the family size constant. TABLE
14-4
A real estate builder wishes to determine how house size (House) is influenced by
family income (Income) and family size (Size). House size is measured in hundreds of
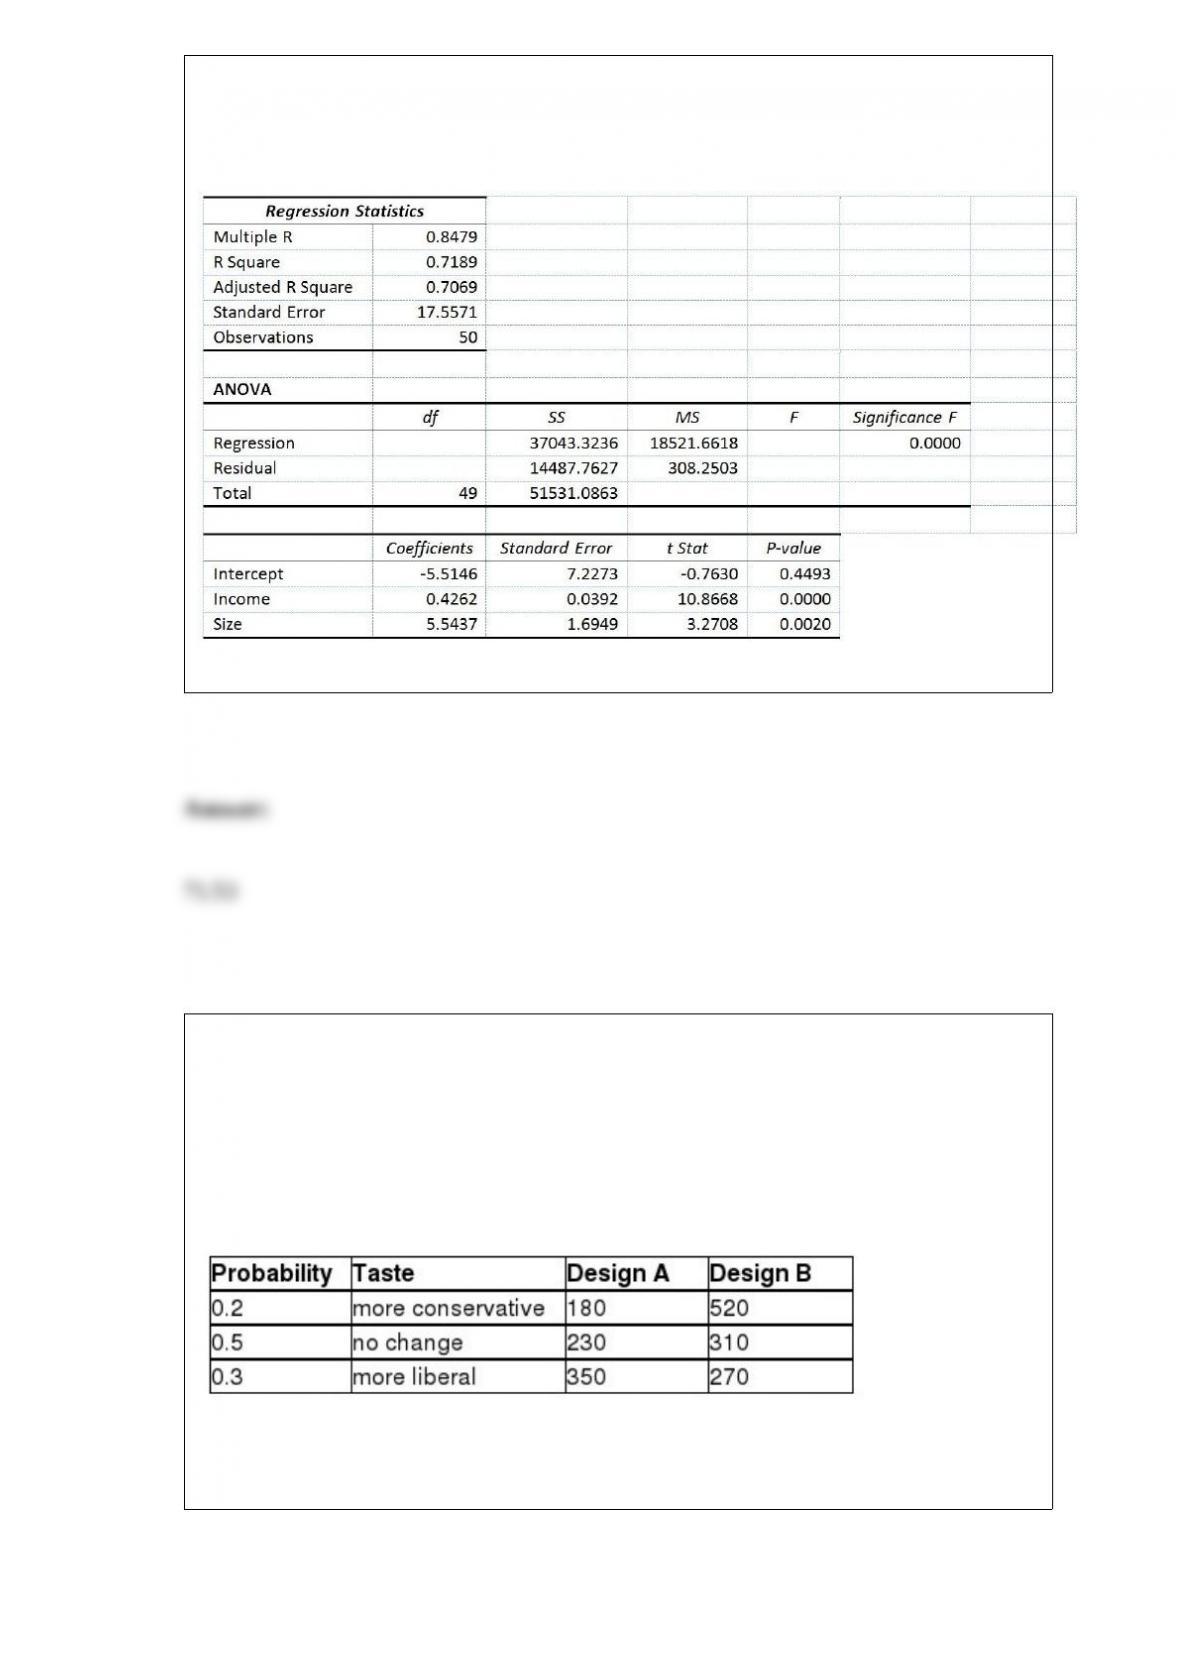
square feet and income is measured in thousands of dollars. The builder randomly
selected 50 families and ran the multiple regression. Partial Microsoft Excel output is
provided below:
Also SSR (X1∣ X2) = 36400.6326 and SSR (X2∣ X1) = 3297.7917
TABLE 5-8
Two different designs on a new line of winter jackets for the coming winter are
available for your manufacturing plants. Your profit (in thousands of dollars) will
depend on the taste of the consumers when winter arrives. The probability of the three
possible different tastes of the consumers and the corresponding profits are presented in
the following table.
Referring to Table 5-8, if you decide to choose Design A for half of the production lines
and Design B for the other half, what is your expected profit?