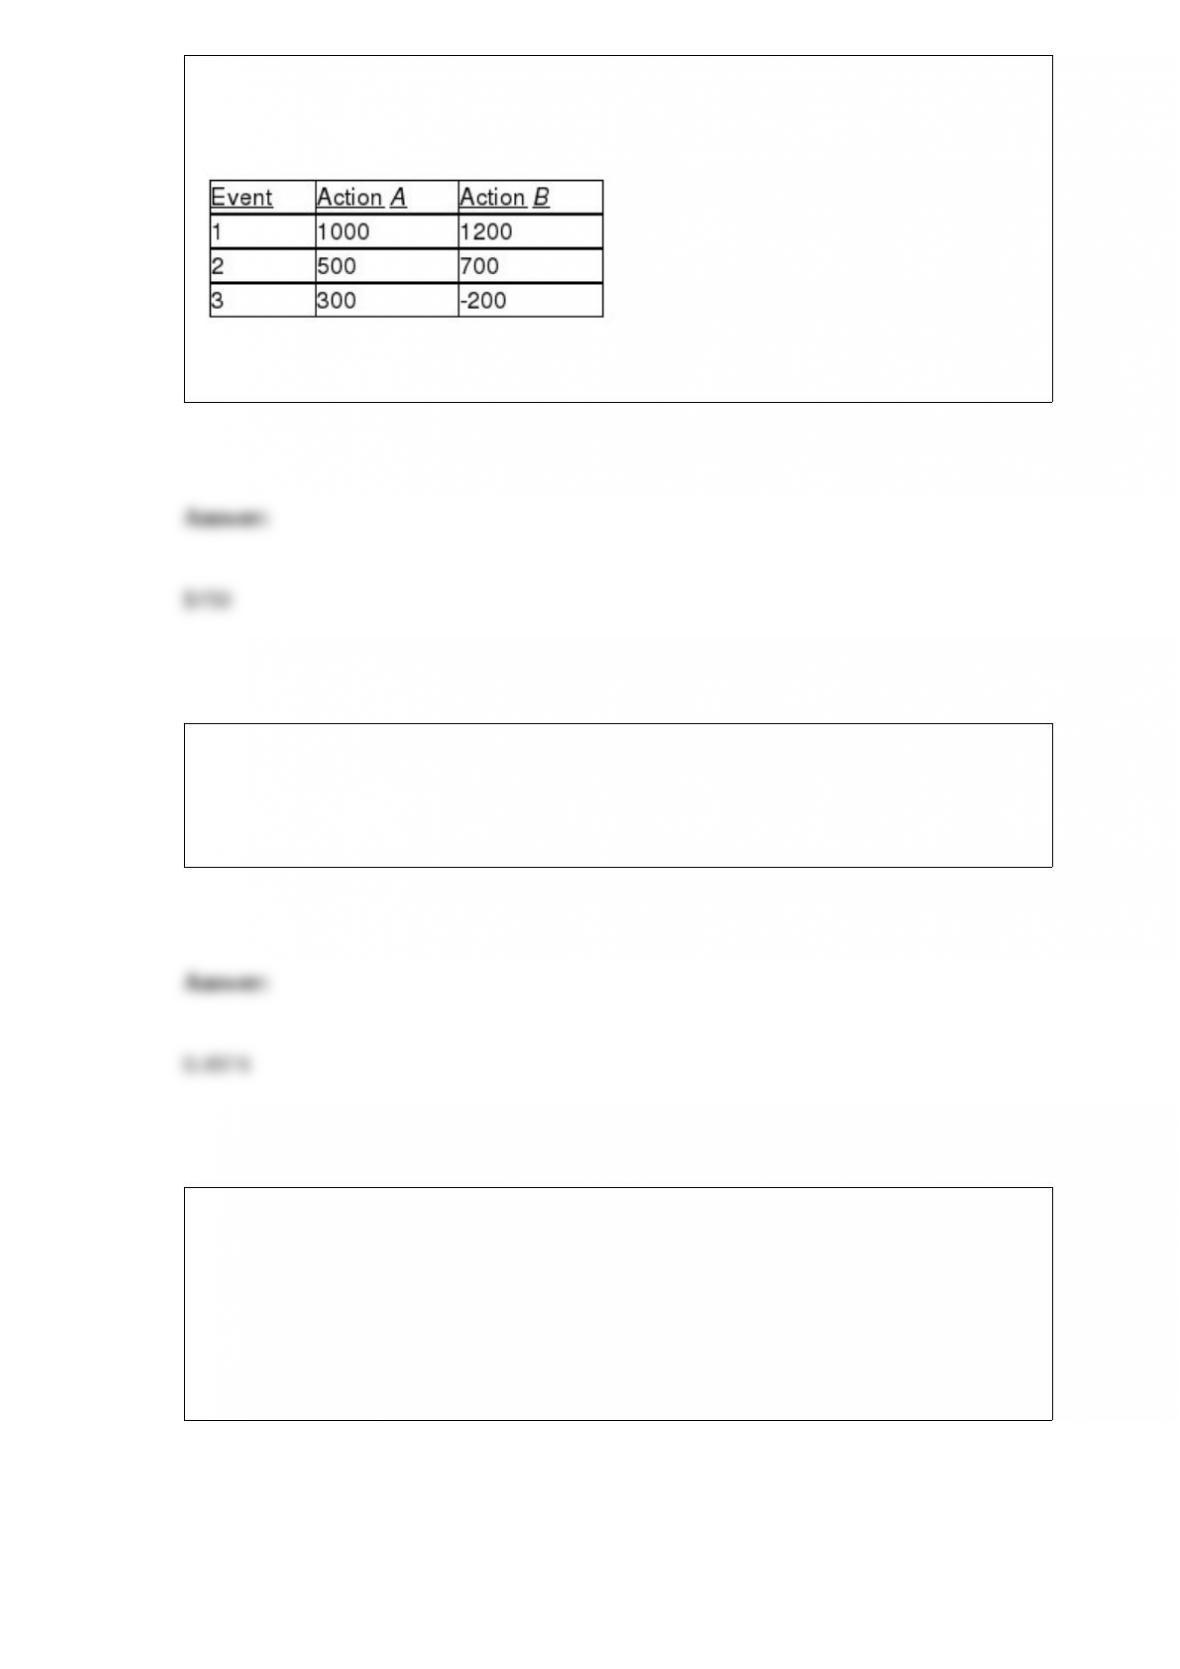
TABLE 19-5
The following payoff table shows profits associated with a set of 2 alternatives under 3
possible events.
Suppose that the probability of Event 1 is 0.2, Event 2 is 0.5, and Event 3 is 0.3.
Referring to Table 19-5, what is the EOL for Action B?
The amount of time required for an oil and filter change on an automobile is normally
distributed with a mean of 45 minutes and a standard deviation of 10 minutes. A
random sample of 16 cars is selected. What is the probability that the sample mean is
between 45 and 52 minutes?
TABLE 13-3
The director of cooperative education at a state college wants to examine the effect of
cooperative education job experience on marketability in the work place. She takes a
random sample of 4 students. For these 4, she finds out how many times each had a
cooperative education job and how many job offers they received upon graduation.
These data are presented in the table below.
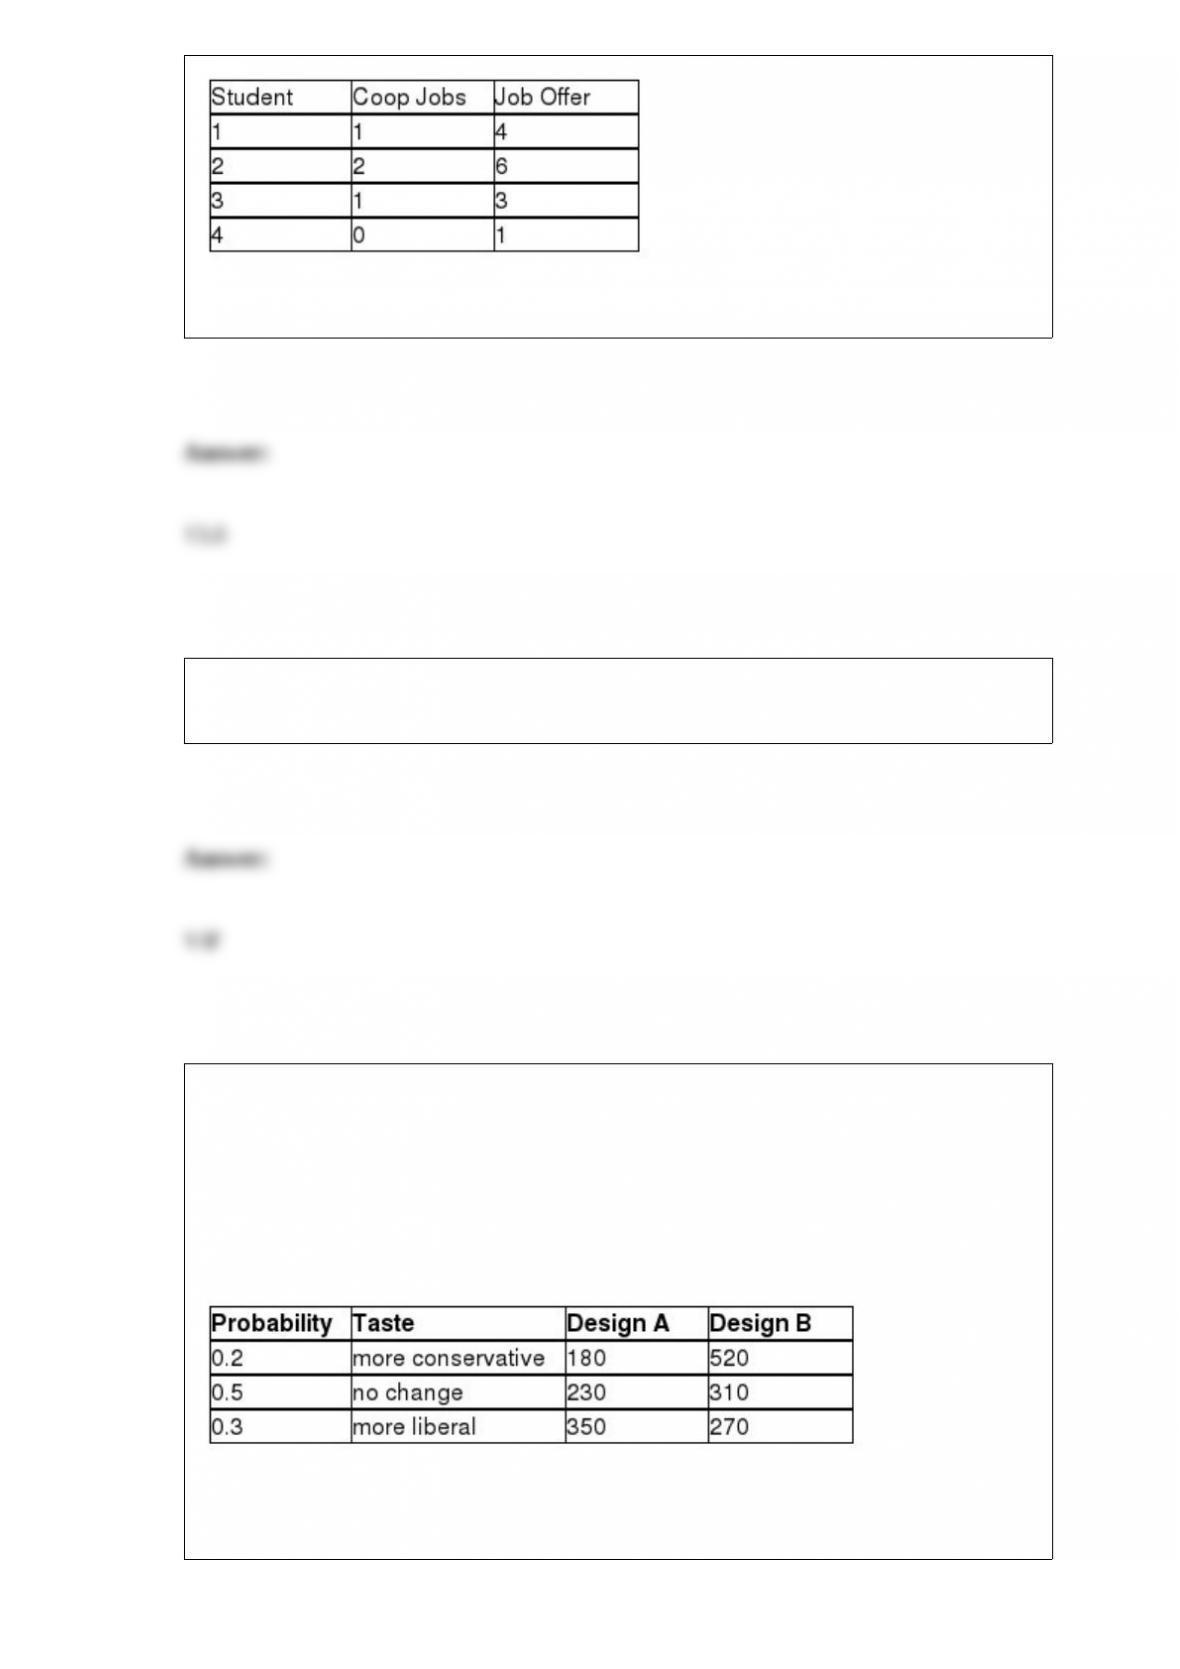
Referring to Table 13-3, the total sum of squares (SST) is ________.
A regression diagnostic tool used to study the possible effects of collinearity is
________.
TABLE 5-8
Two different designs on a new line of winter jackets for the coming winter are
available for your manufacturing plants. Your profit (in thousands of dollars) will
depend on the taste of the consumers when winter arrives. The probability of the three
possible different tastes of the consumers and the corresponding profits are presented in
the following table.
Referring to Table 5-8, what is the total variance of the profit if you increase the shift of
your production lines and choose to produce both designs?
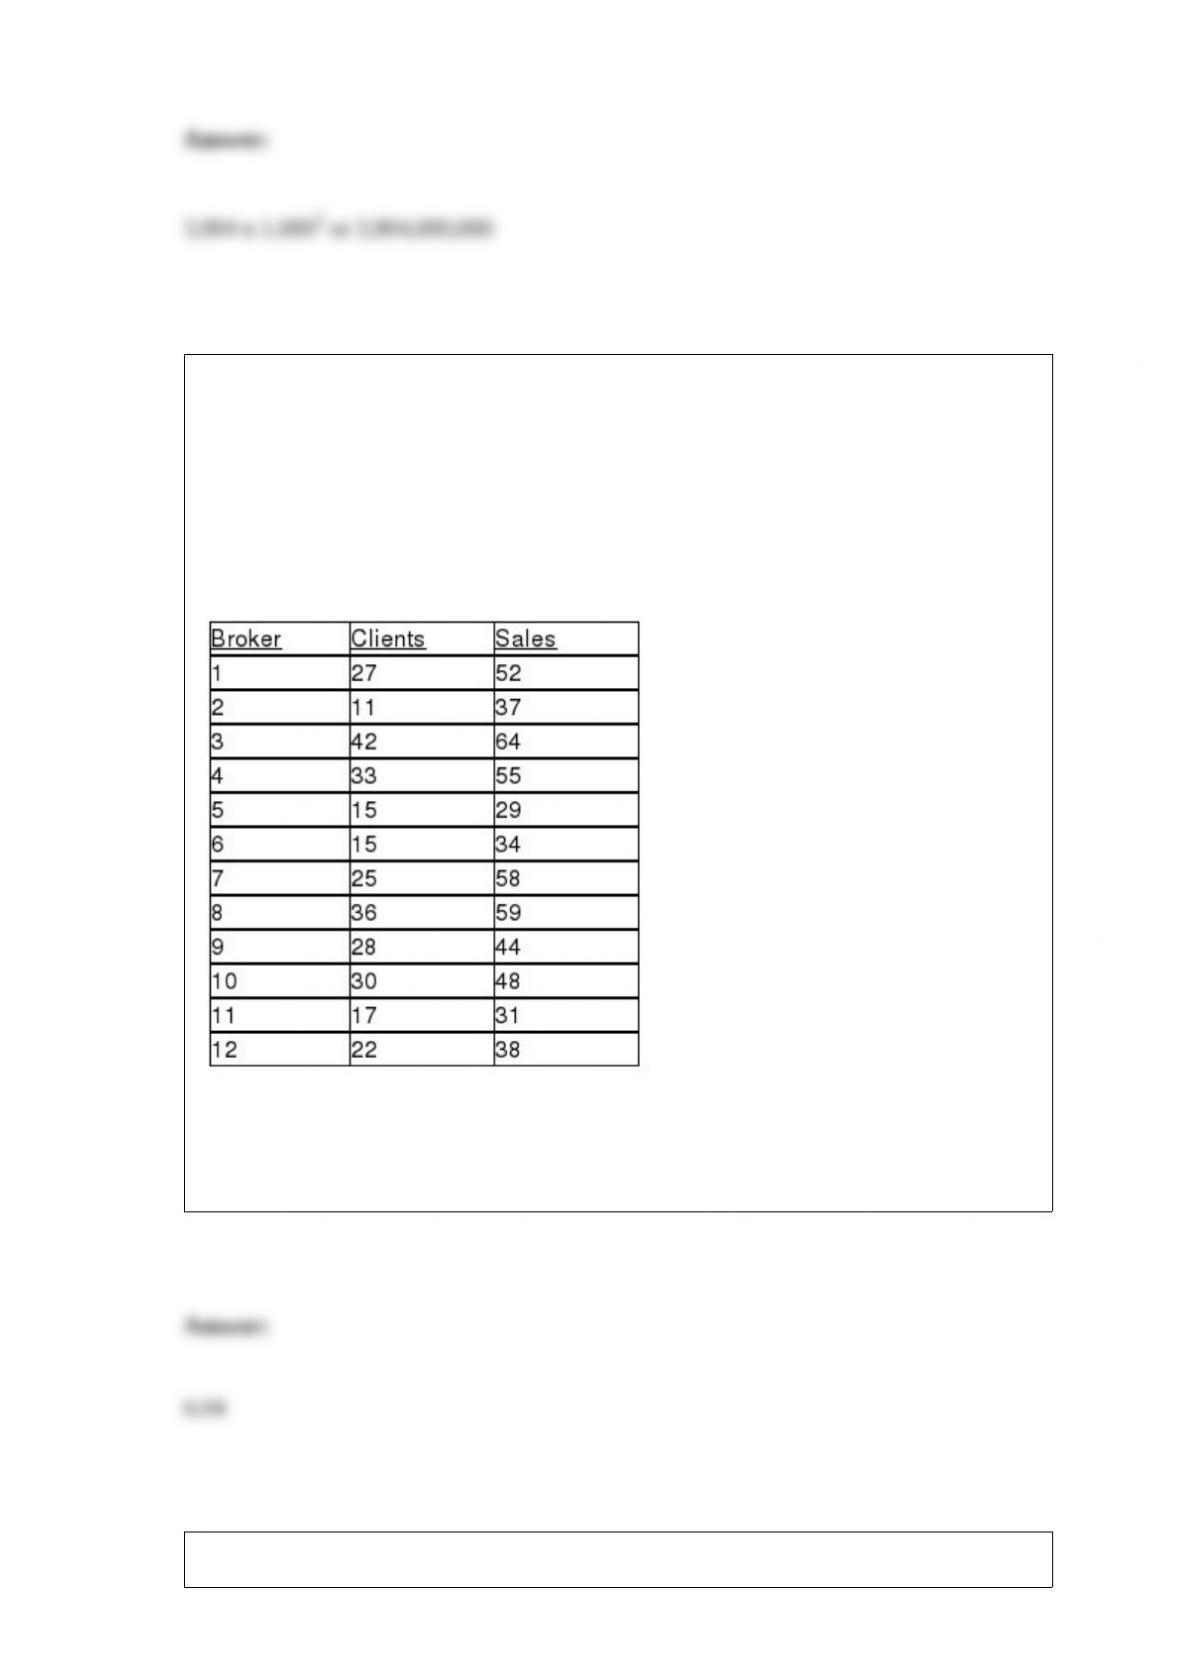
TABLE 13-4
The managers of a brokerage firm are interested in finding out if the number of new
clients a broker brings into the firm affects the sales generated by the broker. They
sample 12 brokers and determine the number of new clients they have enrolled in the
last year and their sales amounts in thousands of dollars. These data are presented in the
table that follows.
Referring to Table 13-4, the managers of the brokerage firm wanted to test the
hypothesis that the number of new clients brought in did not affect the amount of sales
generated. The value of the test statistic is ________.
TABLE 10-4
Two samples each of size 25 are taken from independent populations assumed to be
normally distributed with equal variances. The first sample has a mean of 35.5 and
standard deviation of 3.0 while the second sample has a mean of 33.0 and standard
deviation of 4.0.
Referring to Table 10-4, a two-tail test of the null hypothesis of no difference would
________ (be rejected/not be rejected) at the = 0.05 level of significance.
TABLE 3-3
The ordered array below represents the number of vitamin supplements sold by a health
food store in a sample of 16 days.
19, 19, 20, 20, 22, 23, 25, 26, 27, 30, 33, 34, 35, 36, 38, 41
Note: For this sample, the sum of the values is 448, and the sum of the squared
differences between each value and the mean is 812.
Referring to Table 3-3, the median number of vitamin supplements sold in this sample
is ________.
TABLE 17-8
The superintendent of a school district wanted to predict the percentage of students
passing a sixth-grade proficiency test. She obtained the data on percentage of students
passing the proficiency test (% Passing), daily mean of the percentage of students
attending class (% Attendance), mean teacher salary in dollars (Salaries), and
instructional spending per pupil in dollars (Spending) of 47 schools in the state.
Following is the multiple regression output with Y = % Passing as the dependent
variable, X1 = % Attendance, X2 = Salaries and X3 = Spending:
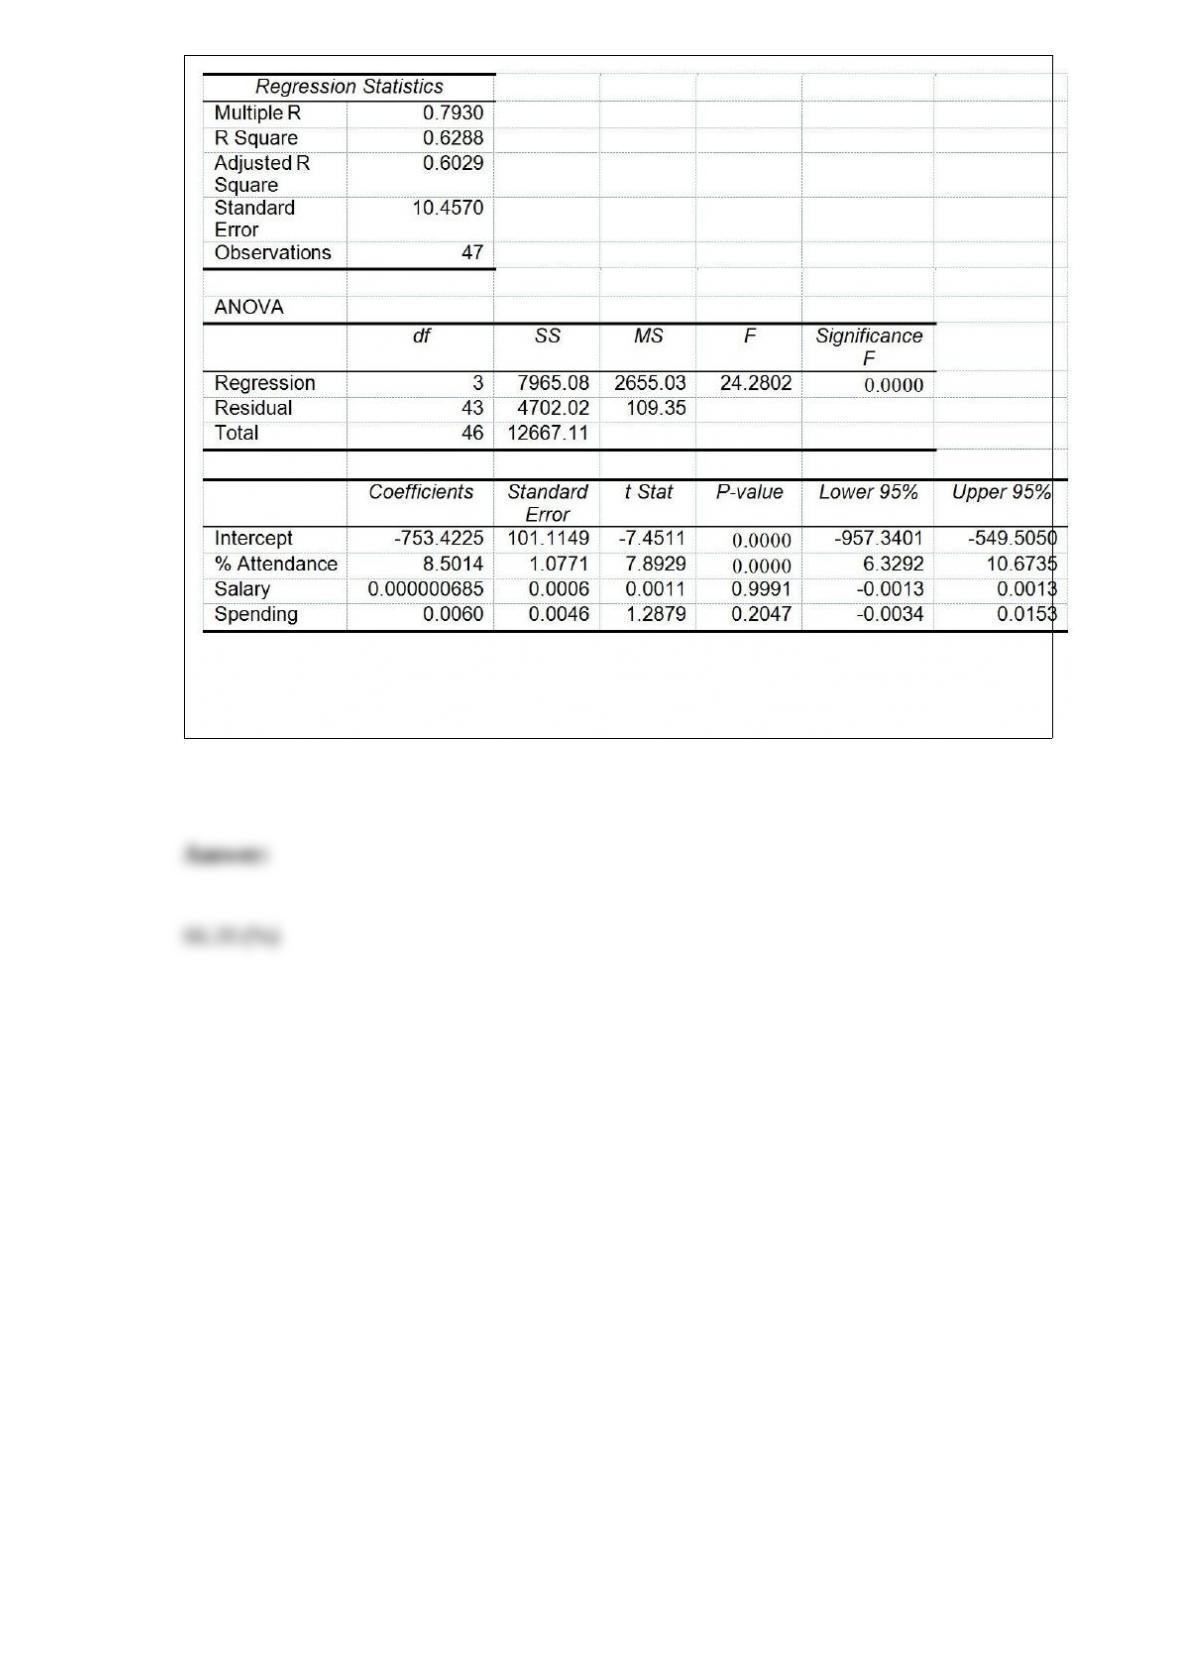
Referring to Table 17-8, predict the percentage of students passing the proficiency test
for a school which has a daily mean of 95% of students attending class, a mean teacher
salary of 40,000 dollars, and an instructional spending per pupil of 2,000 dollars.