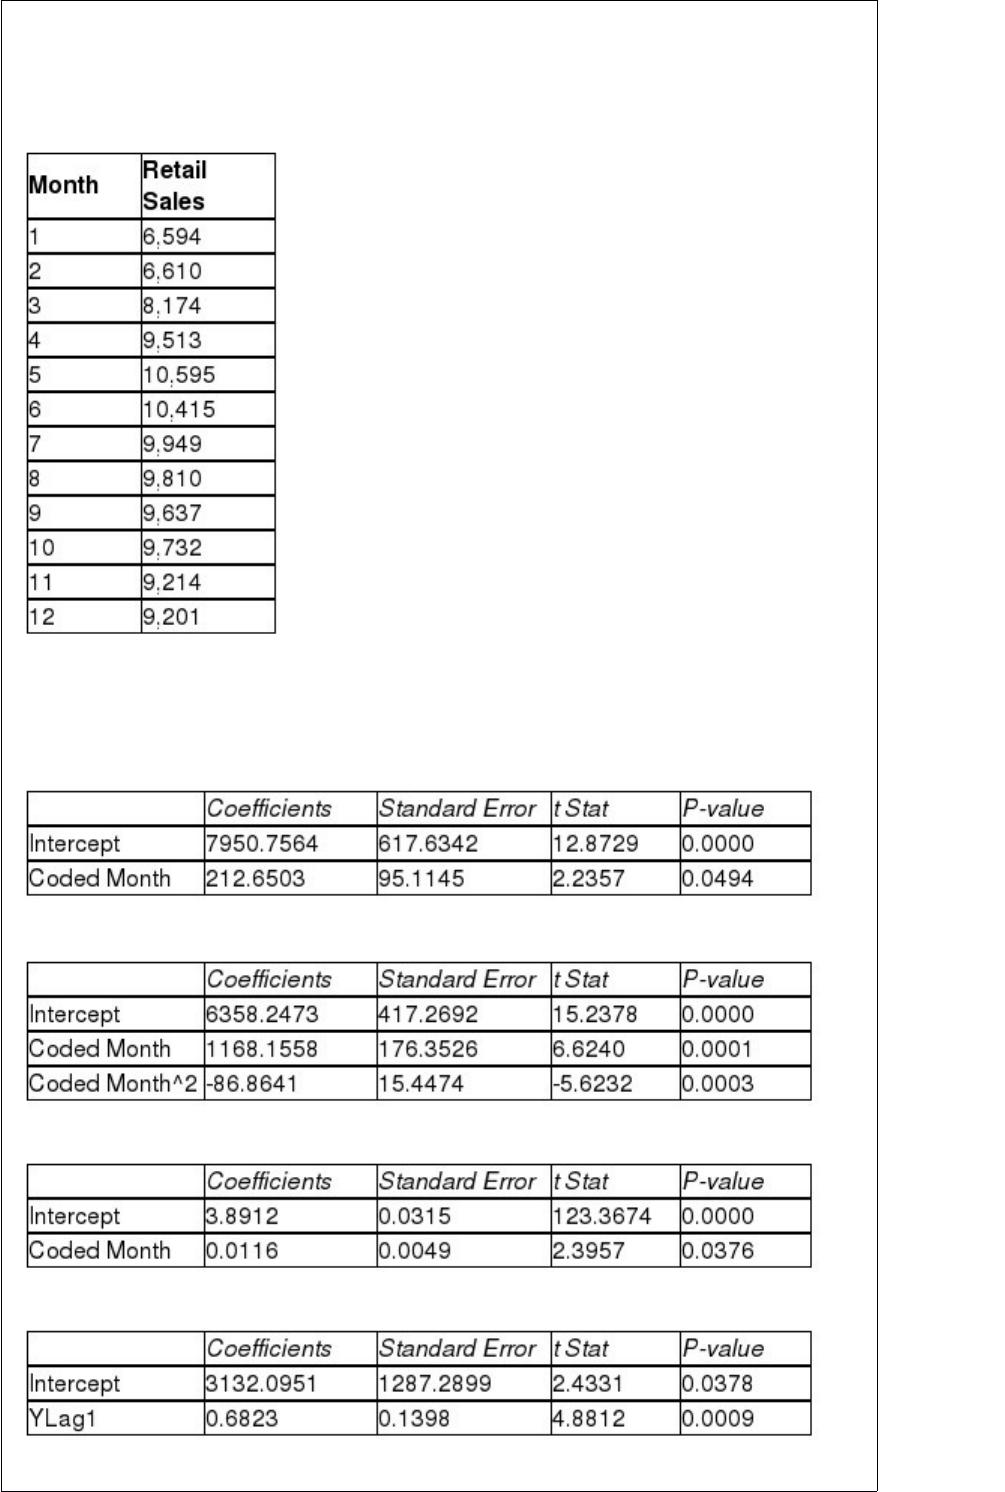
TABLE 16-13
Given below is the monthly time-series data for U.S. retail sales of building materials
over a specific year.
The results of the linear trend, quadratic trend, exponential trend, first-order
autoregressive, second-order autoregressive and third-order autoregressive model are
presented below in which the coded month for the 1st month is 0:
Linear trend model:
Quadratic trend model:
Exponential trend model:
First-order autoregressive:
Second-order autoregressive:
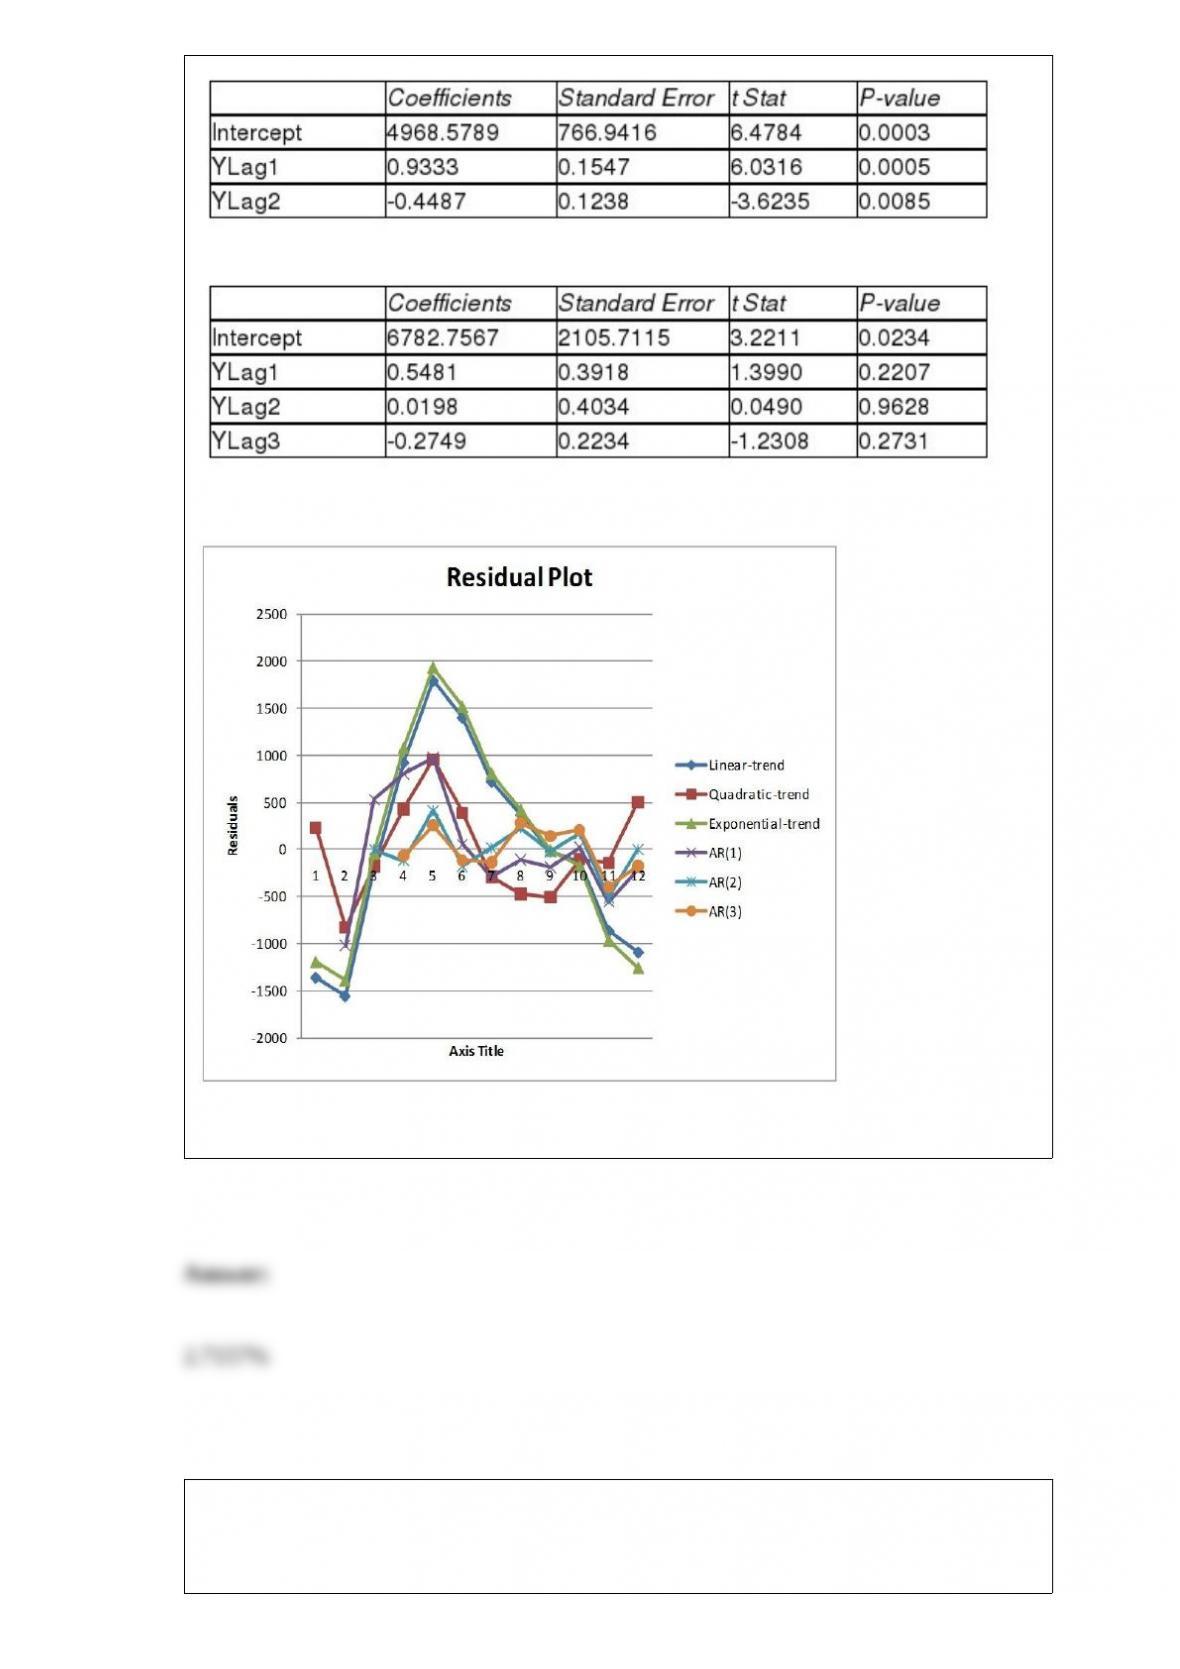
Third-order autoregressive:
Below is the residual plot of the various models:
Referring to Table 16-13, what is your estimated annual compound growth rate using
the exponential-trend model?
TABLE 4-10
Are whites more likely to claim bias? It was found that 60% of the workers were white,
30% were black and 10% are other races. Given that a worker was white, the
probability that the worker had claimed bias was 30%. Given that a worker was black,
the probability that the worker had claimed bias was 40%. Given that a worker was
other race, the probability that the worker had claimed bias was 0%.
Referring to Table 4-10, what is the probability that a randomly selected worker is not
black and had not claimed bias?
The interval between patients arriving at an outpatient clinic follows an exponential
distribution at a rate of 15 patients per hour. What is the probability that a randomly
chosen arrival interval will be more than 5 minutes?
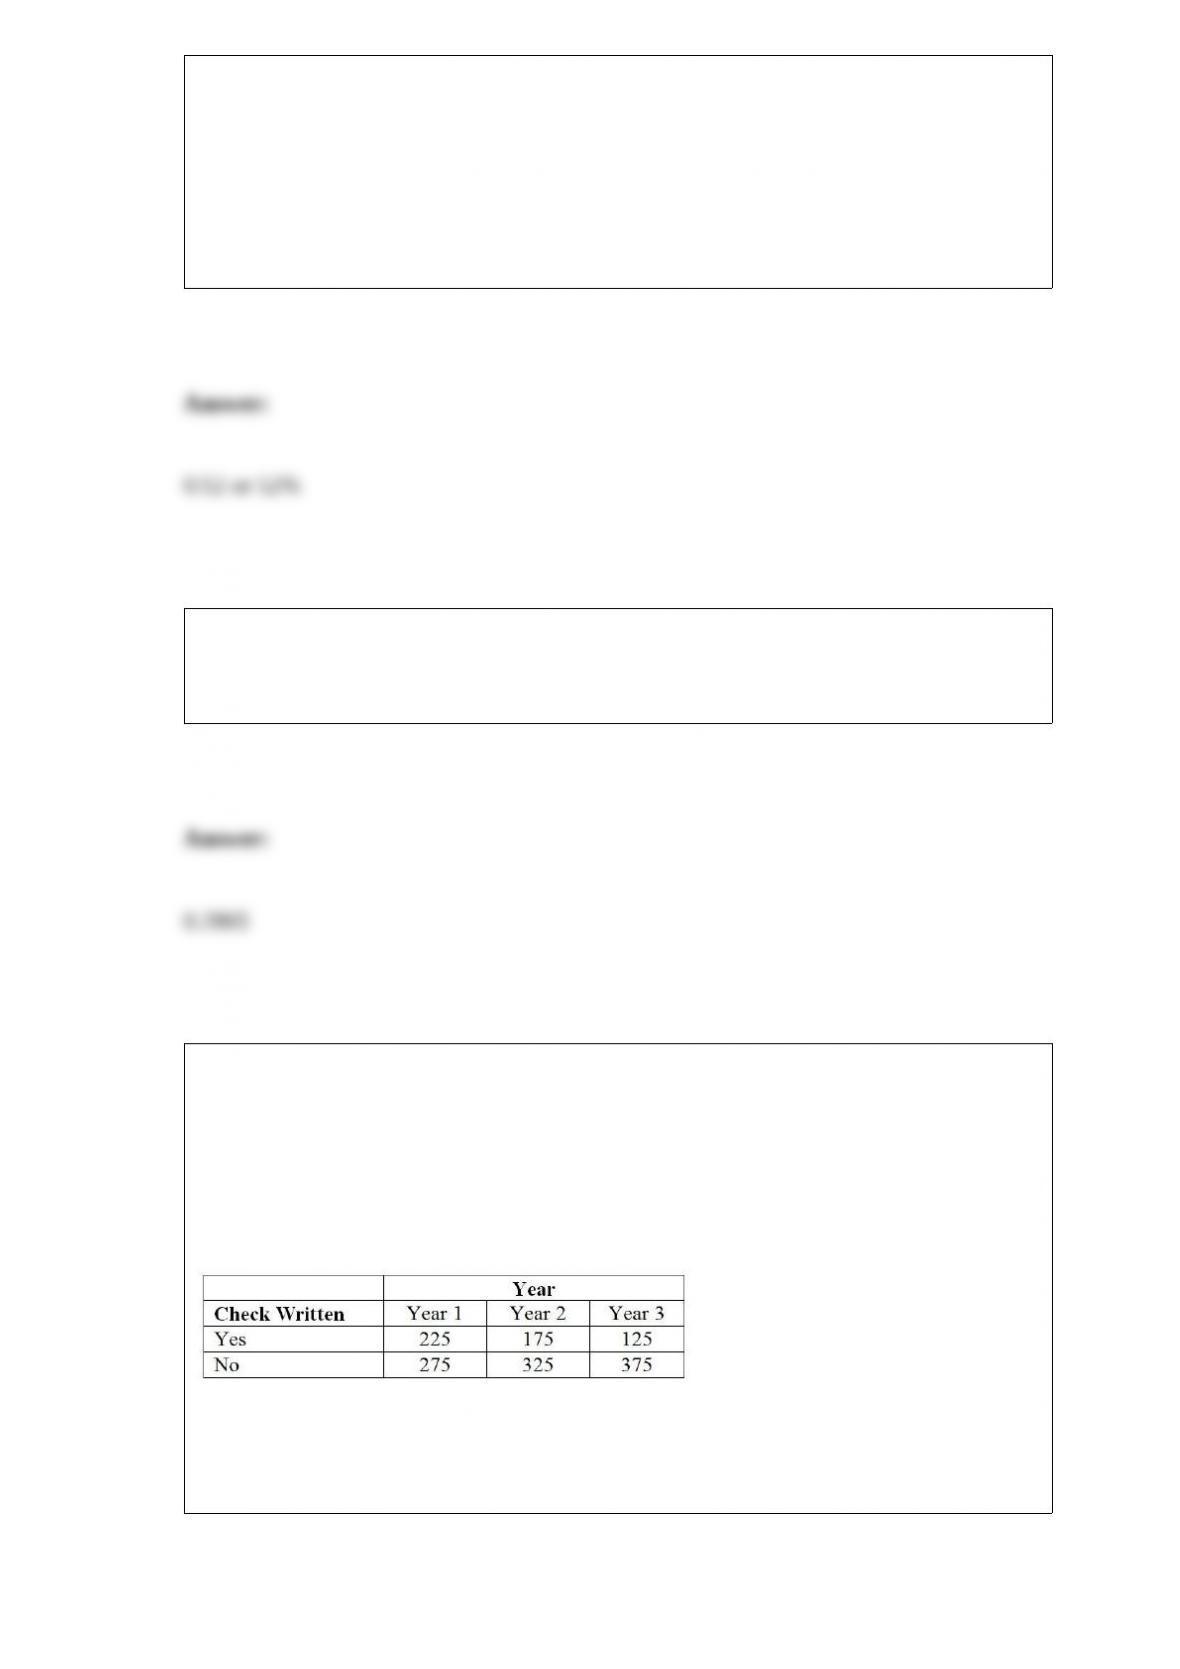
TABLE 12-6
According to an article in Marketing News, fewer checks are being written at the
grocery store checkout than in the past. To determine whether there is a difference in
the proportion of shoppers who pay by check among three consecutive years at a 0.05
level of significance, the results of a survey of 500 shoppers in three consecutive years
are obtained and presented below.
Referring to Table 12-6, what is the value of the critical range for the Marascuilo
procedure to test for the difference in proportions between year 1 and year 2 using a
0.05 level of significance?

An Undergraduate Study Committee of 6 members at a major university is to be formed
from a pool of faculty of 18 men and 6 women. If the committee members are chosen
randomly, what is the probability that precisely half of the members will be women?
TABLE 6-4
The interval between consecutive hits at a website is assumed to follow an exponential
distribution with an average of 40 hits per minute.
Referring to Table 6-4, what is the probability that the next hit at the website will occur
no sooner than 5 seconds after just being hit by a visitor?
Referring to Table 14-19, what is the estimated probability that a
home owner with a family income of $100,000 and a lawn size of
5,000 square feet will purchase a lawn service?
TABLE 14-19
The marketing manager for a nationally franchised lawn service
company would like to study the characteristics that differentiate
home owners who do and do not have a lawn service. A random
sample of 30 home owners located in a suburban area near a large
city was selected; 11 did not have a lawn service (code 0) and 19 had
a lawn service (code 1). Additional information available concerning
these 30 home owners includes family income (Income, in thousands
of dollars) and lawn size (Lawn Size, in thousands of square feet).
The PHStat output is given below:
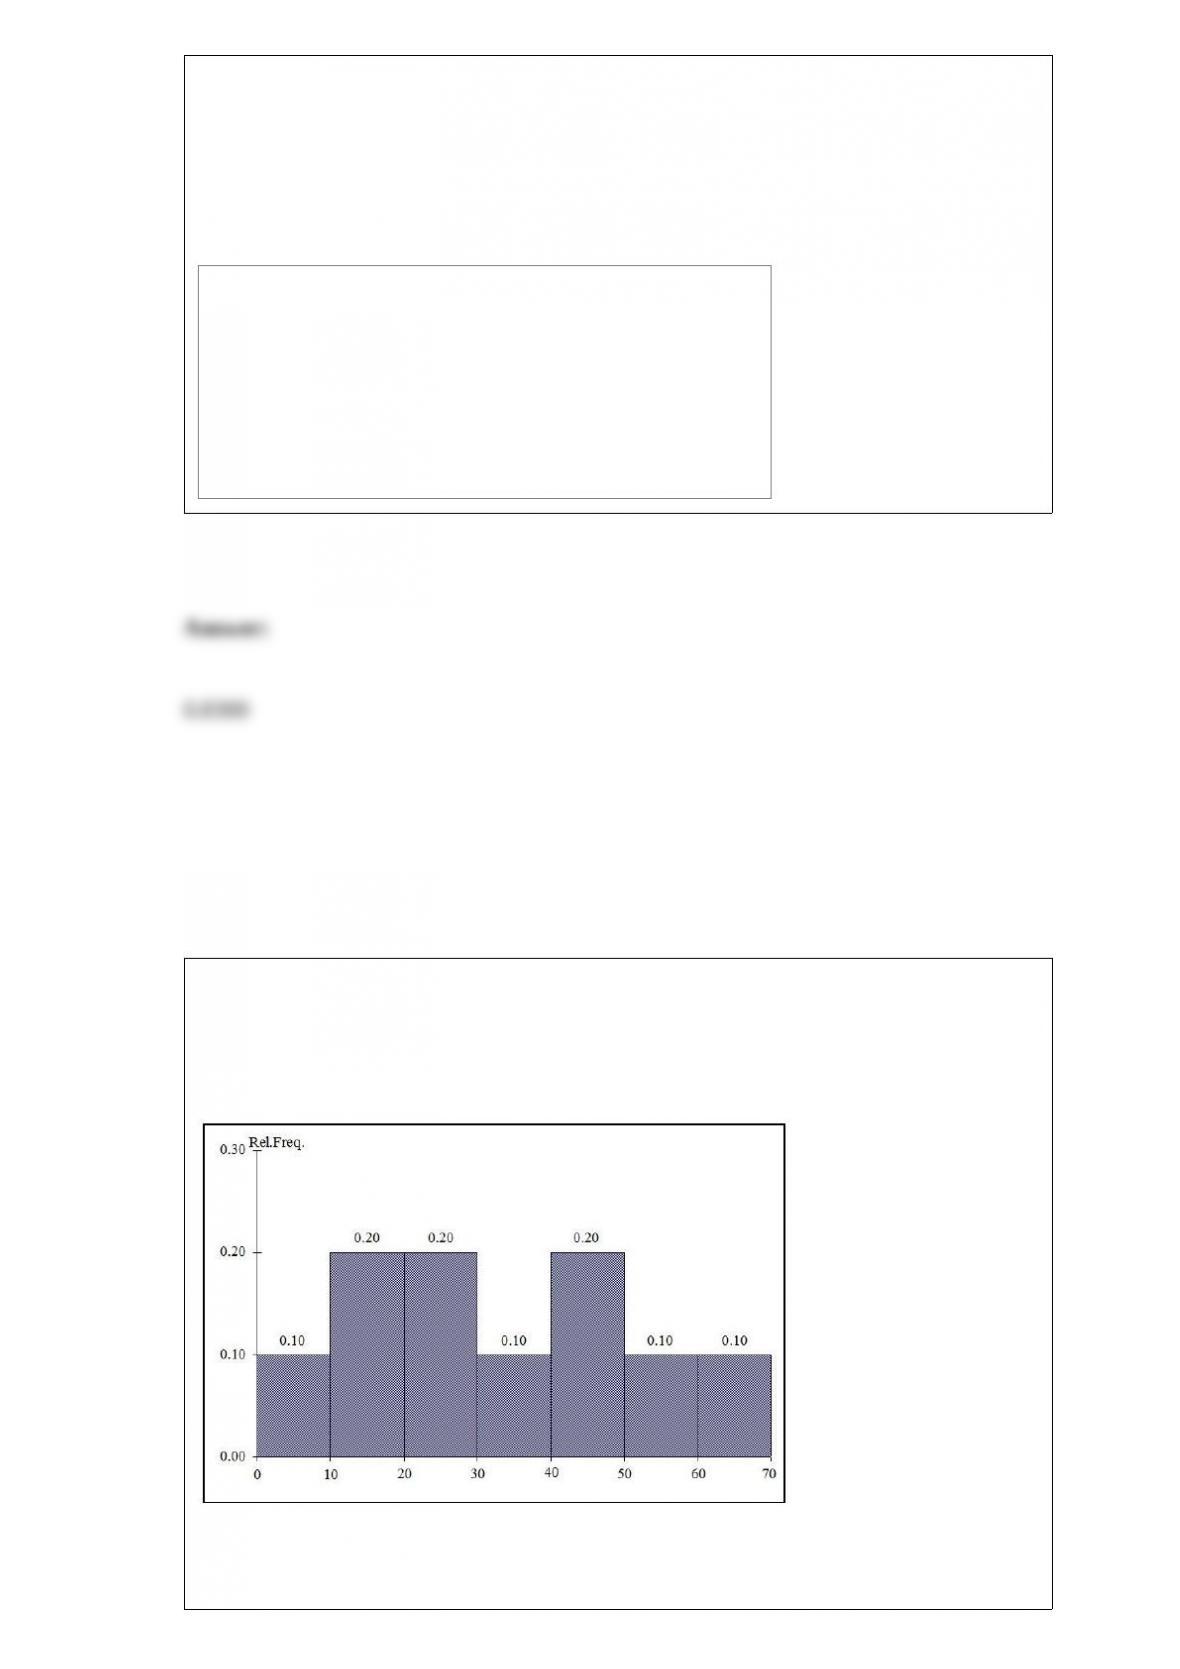
TABLE 2-10
The histogram below represents scores achieved by 200 job applicants on a personality
profile.
Referring to the histogram from Table 2-10, ________ percent of the job applicants
scored below 50.