
TABLE 14-7
The department head of the accounting department wanted to see if
she could predict the GPA of students using the number of course
units (credits) and total SAT scores of each. She takes a sample of
students and generates the following Microsoft Excel output:
True or False: Referring to Table 14-7, the department head wants to
test H0 : β1 = β2 = 0. At a level of signiticance of 0.05, the null
hypothesis is rejected.
TABLE 8-8
The president of a university would like to estimate the proportion of the student
population that owns a personal computer. In a sample of 500 students, 417 own a
personal computer.
True or False: Referring to Table 8-8, a 95% confidence interval for the proportion of
the student population who own a personal computer is narrower than a 99%
confidence interval.
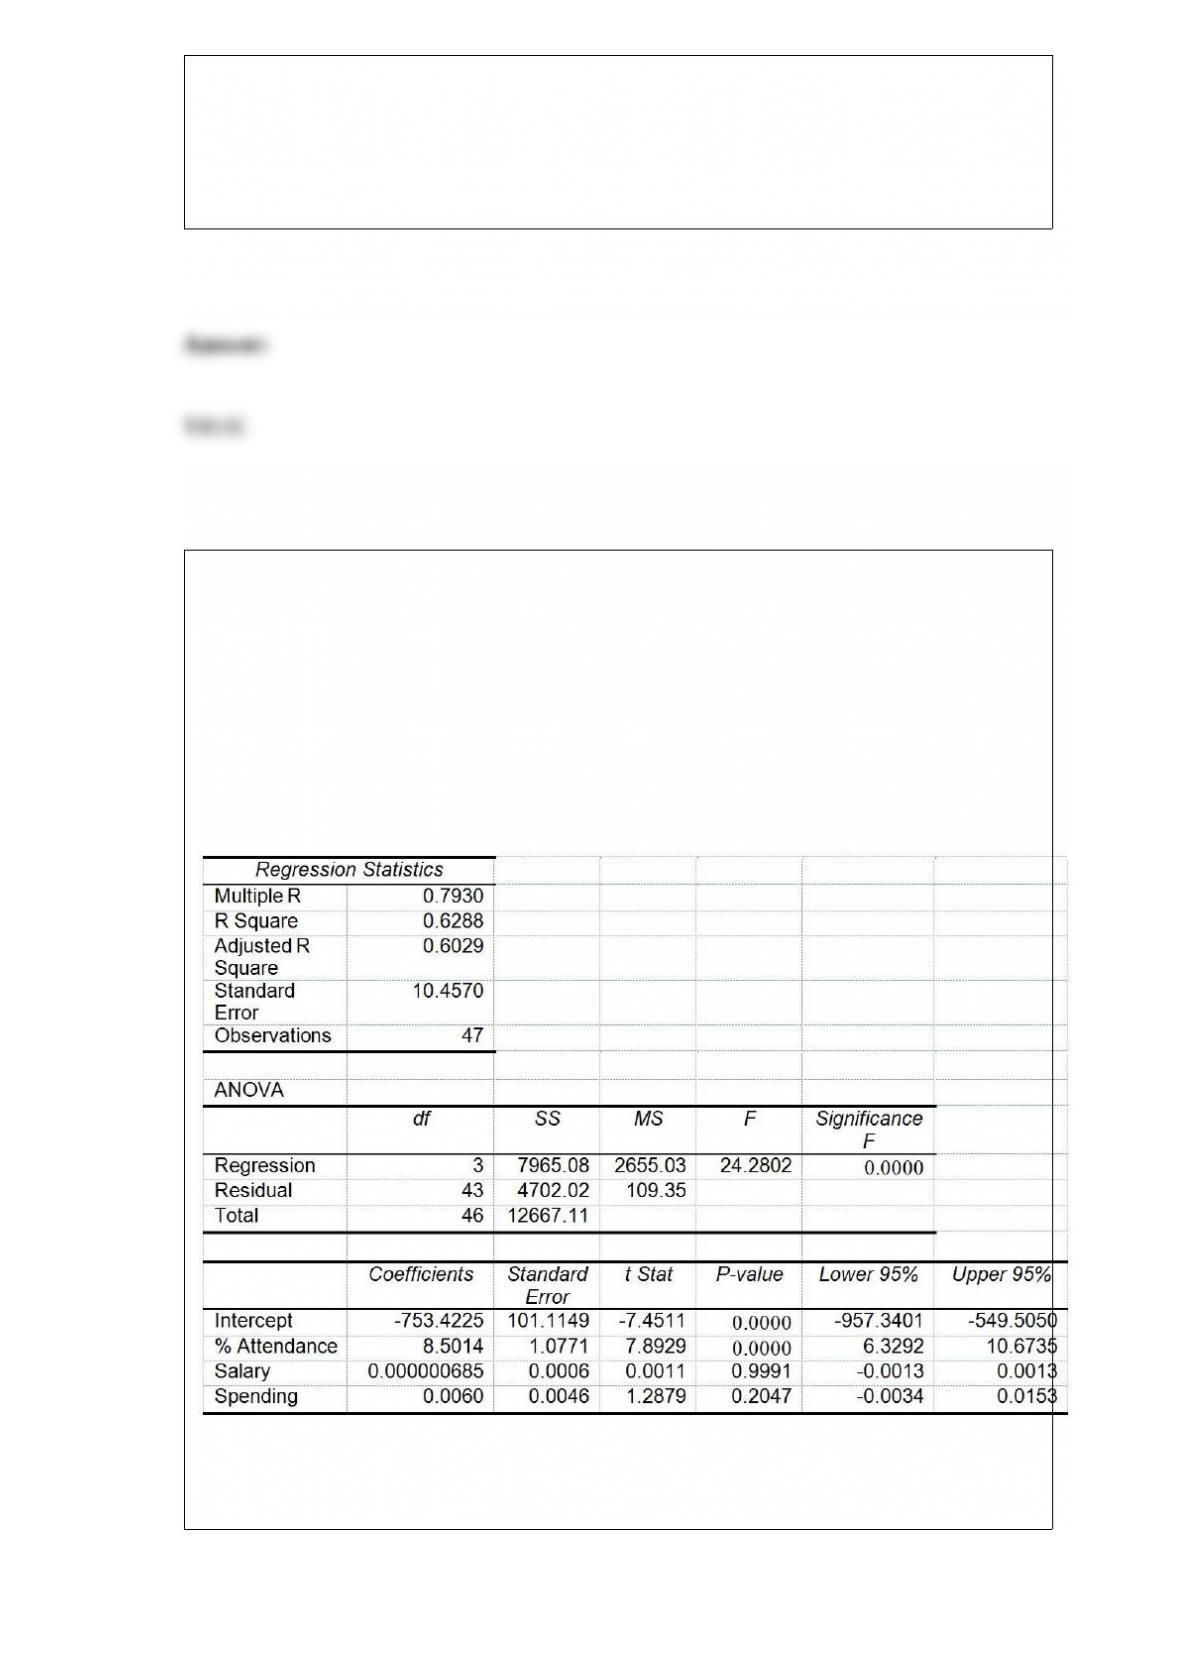
True or False: TABLE 17-8
The superintendent of a school district wanted to predict the percentage of students
passing a sixth-grade proficiency test. She obtained the data on percentage of students
passing the proficiency test (% Passing), daily mean of the percentage of students
attending class (% Attendance), mean teacher salary in dollars (Salaries), and
instructional spending per pupil in dollars (Spending) of 47 schools in the state.
Following is the multiple regression output with Y = % Passing as the dependent
variable, X1 = % Attendance, X2 = Salaries and X3 = Spending:
Referring to Table 17-8, the null hypothesis H0 : β1 = β2 = β3 = 0 implies that the
percentage of students passing the proficiency test is not related to any of the
explanatory variables.

True or False: The Paasche price index has the disadvantage that current consumption
quantities are usually hard to obtain.
True or False: Items or individuals in a judgment sample are chosen according to their
probability of occurrence.
True or False: You give a pre-employment examination to your applicants. The test is
scored from 1 to 100. You have data on their sales at the end of one year measured in
dollars. You want to know if there is any linear relationship between pre-employment
examination score and sales. An appropriate test to use is the t test of the population
correlation coefficient.
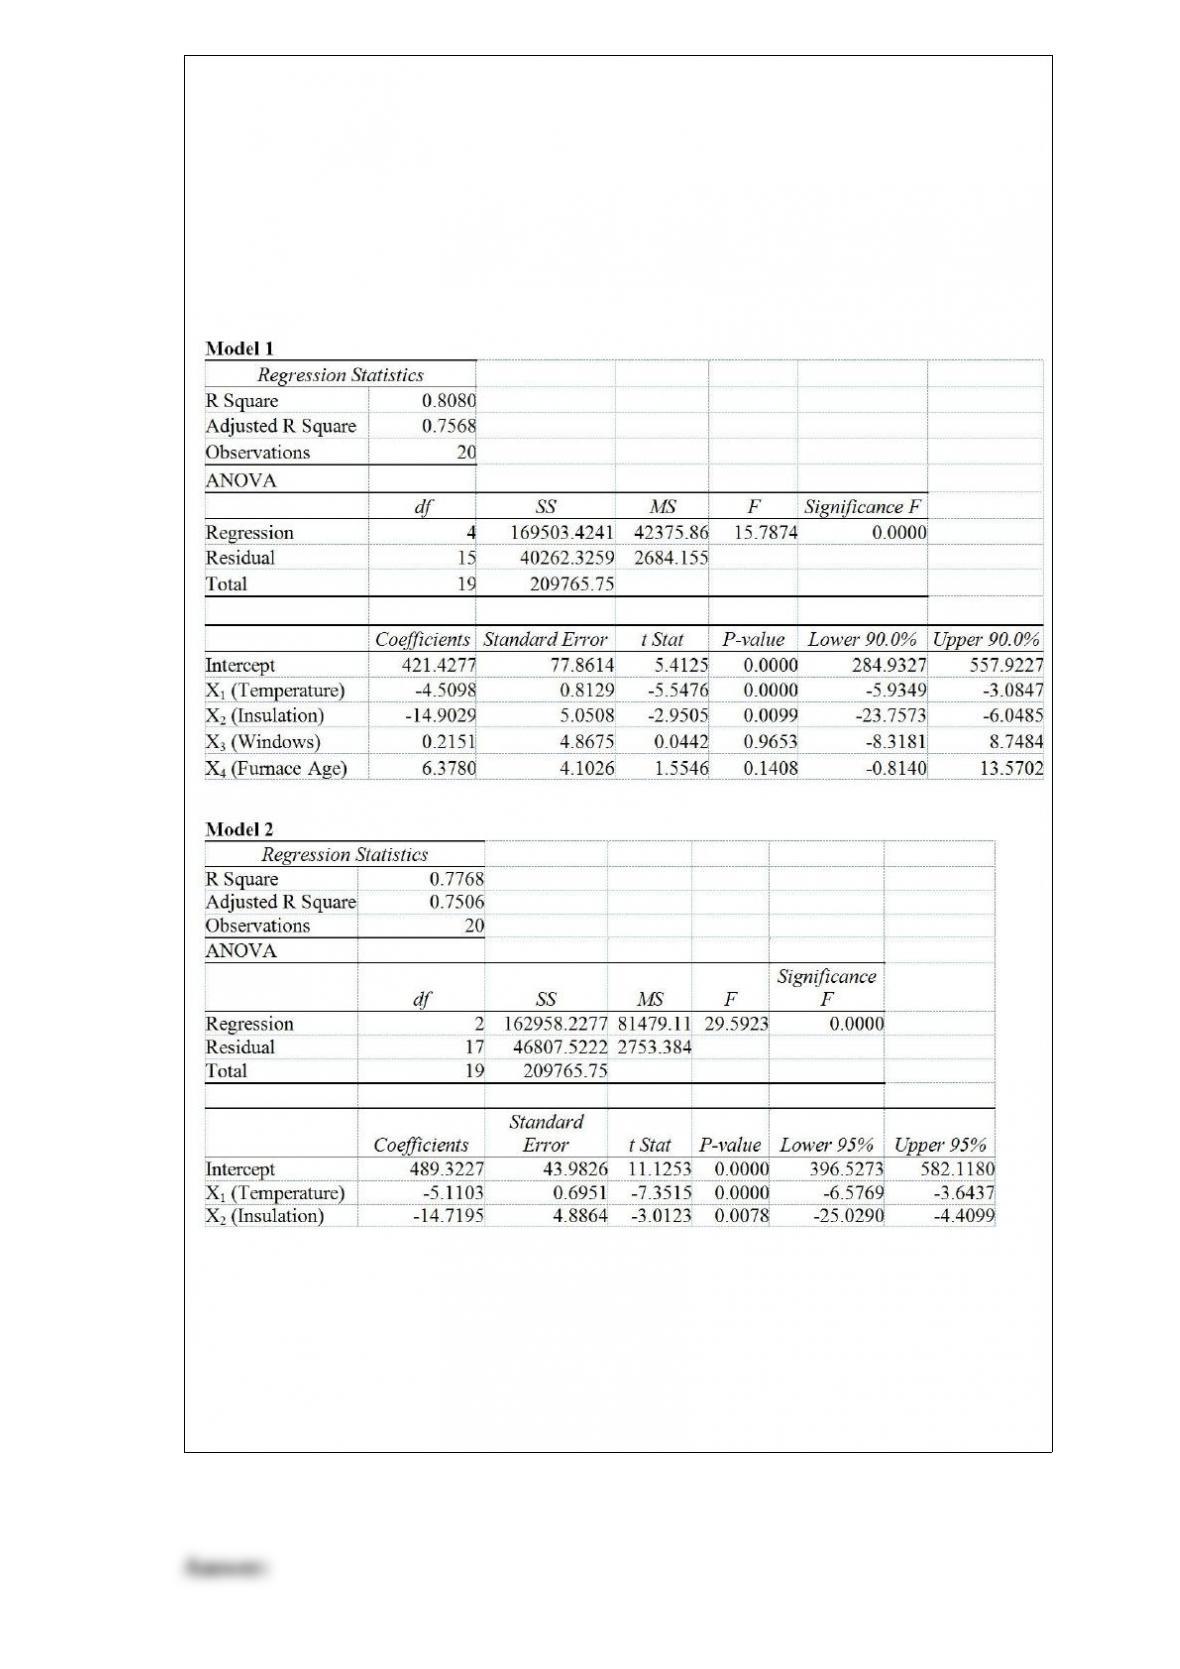
TABLE 17-2
One of the most common questions of prospective house buyers pertains to the cost of
heating in dollars (Y). To provide its customers with information on that matter, a large
real estate firm used the following 4 variables to predict heating costs: the daily
minimum outside temperature in degrees of Fahrenheit (X1), the amount of insulation in
inches (X2), the number of windows in the house (X3), and the age of the furnace in
years (X4). Given below are the EXCEL outputs of two regression models.
Referring to Table 17-2, what is the 90% confidence interval for the expected change in
heating costs as a result of a 1 degree Fahrenheit change in the daily minimum outside
temperature using Model 1?
A) [-6.58, -3.65]
B) [-6.24, -2.78]
C) [-5.94, -3.08]
D) [-2.37, 15.12]

In what type of test is the variable of interest the difference between the values of the
observations rather than the observations themselves?
A) a test for the equality of variances from 2 independent populations
B) a test for the difference between the means of 2 related populations
C) a test for the difference between the means of 2 independent populations
D) All of the above
Referring to Table 14-5, at the 0.01 level of significance, what conclusion should the
microeconomist reach regarding the inclusion of Capital in the regression model?
TABLE 14-5
A microeconomist wants to determine how corporate sales are influenced by capital and
wage spending by companies. She proceeds to randomly select 26 large corporations
and record information in millions of dollars. The Microsoft Excel output below shows
results of this multiple regression.
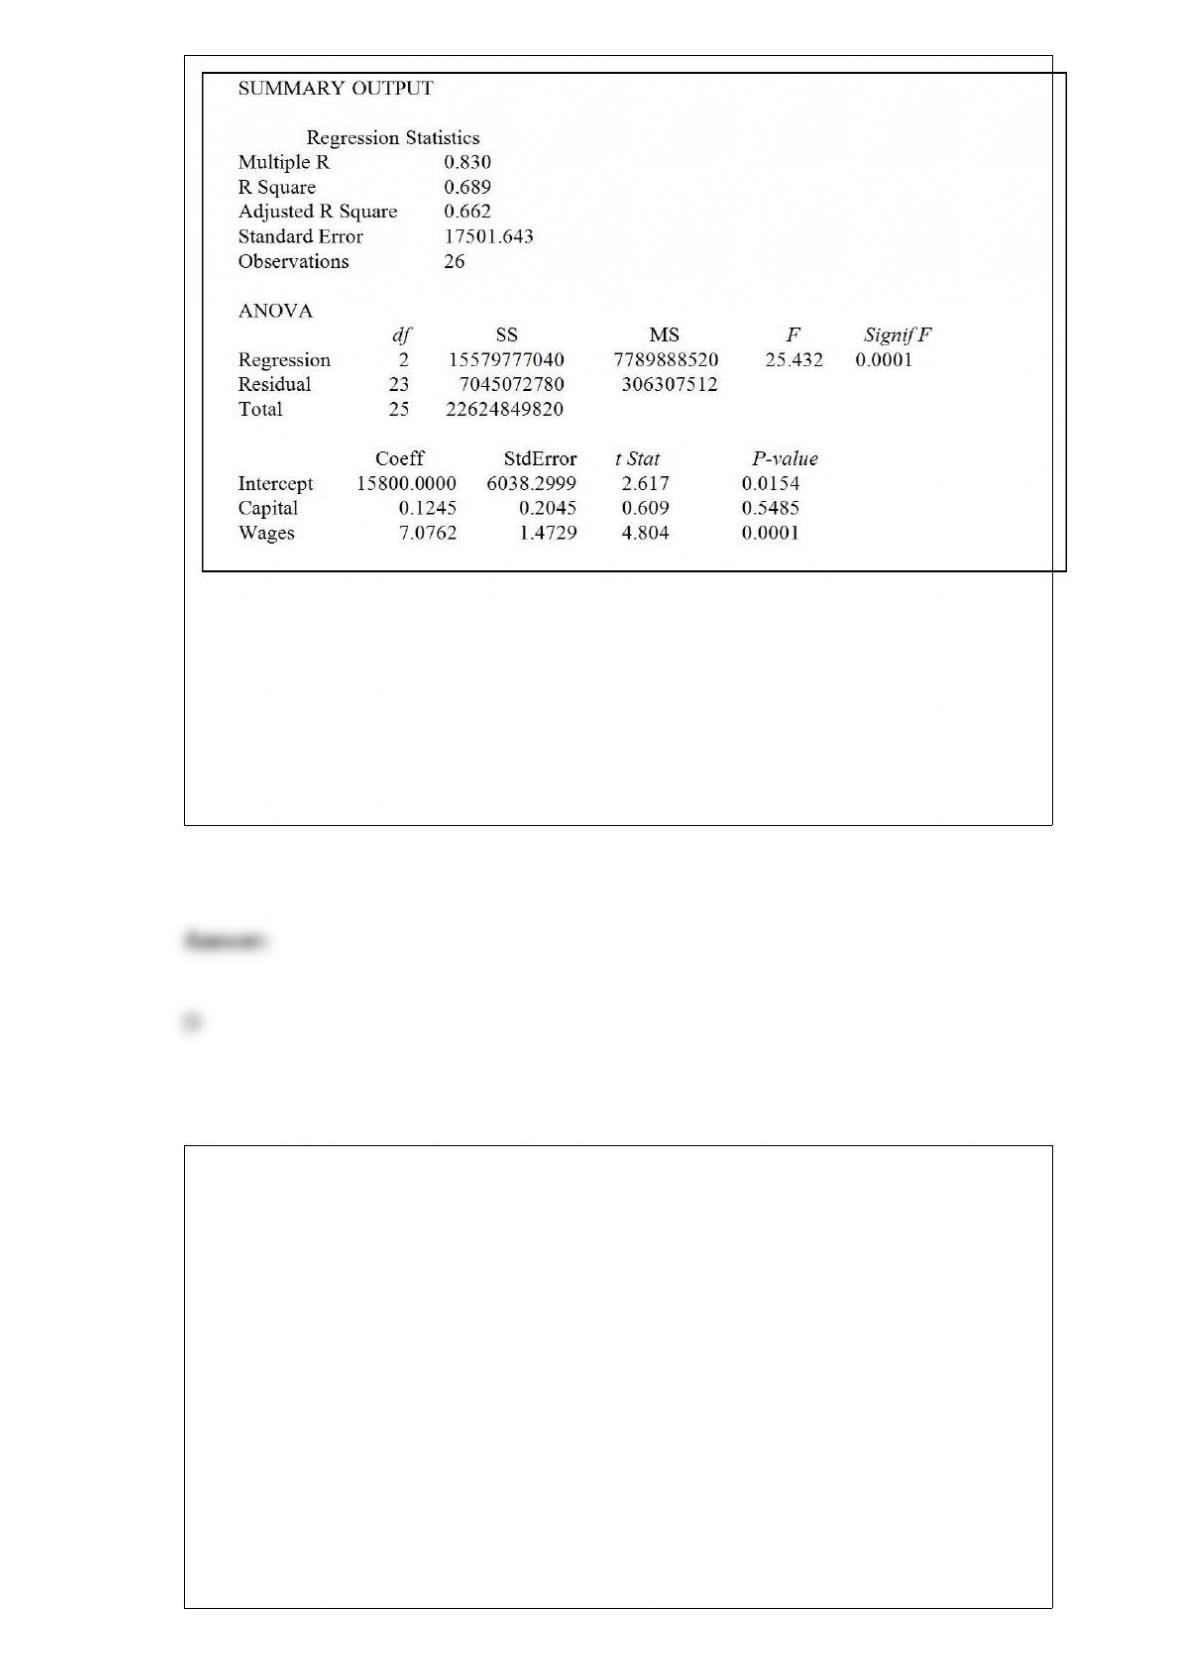
A) Capital is significant in explaining corporate sales and should be included in the
model because its p-value is less than 0.01.
B) Capital is significant in explaining corporate sales and should be included in the
model because its p-value is more than 0.01.
C) Capital is not significant in explaining corporate sales and should not be included in
the model because its p-value is less than 0.01.
D) Capital is not significant in explaining corporate sales and should not be included in
the model because its p-value is more than 0.01.
Referring to Table 14-16, which of the following assumptions is most
likely violated based on the normal probability plot?
TABLE 14-16
What are the factors that determine the acceleration time (in sec.)
from 0 to 60 miles per hour of a car? Data on the following variables
for 30 different vehicle models were collected:
Y (Accel Time): Acceleration time in sec.
X1 (Engine Size): c.c.
X2 (Sedan): 1 if the vehicle model is a sedan and 0 otherwise
The regression results using acceleration time as the dependent
variable and the remaining variables as the independent variables are

presented below.
The various residual plots are as shown below.

The coefficient of partial determinations and are 0.3301,
and 0.0594, respectively.
The coefficient of determination for the regression model using each
of the 2 independent variables as the dependent variable and the
other independent variable as independent variables ( ) are,
respectively 0.0077, and 0.0077.
A) Linearity
B) Normality
C) Equal variance
D) Independence

The portion of the universe that has been selected for analysis is called
A) a sample.
B) a frame.
C) a primary data source.
D) a secondary data source.
Referring to Table 14-15, which of the following is the correct
alternative hypothesis to determine whether there is a signiticant
relationship between percentage of students passing the proficiency
test and the entire set of explanatory variables?
TABLE 14-15
The superintendent of a school district wanted to predict the
percentage of students passing a sixth-grade proficiency test. She
obtained the data on percentage of students passing the proficiency
test (% Passing), mean teacher salary in thousands of dollars
(Salaries), and instructional spending per pupil in thousands of dollars
(Spending) of 47 schools in the state.
Following is the multiple regression output with Y = % Passing as the
dependent variable, X1 = Salaries and X2 = Spending:

A) H1 : β0 = β1 = β2 ≠0
B) H1 : β1 = β2 ≠0
C) H1 : At least one of βj ≠0 for j = 0, 1, 2
D) H1 : At least one of βj≠0 for j = 1, 2
True or False: The analysis of variance (ANOVA) tests hypotheses about the population
variance.
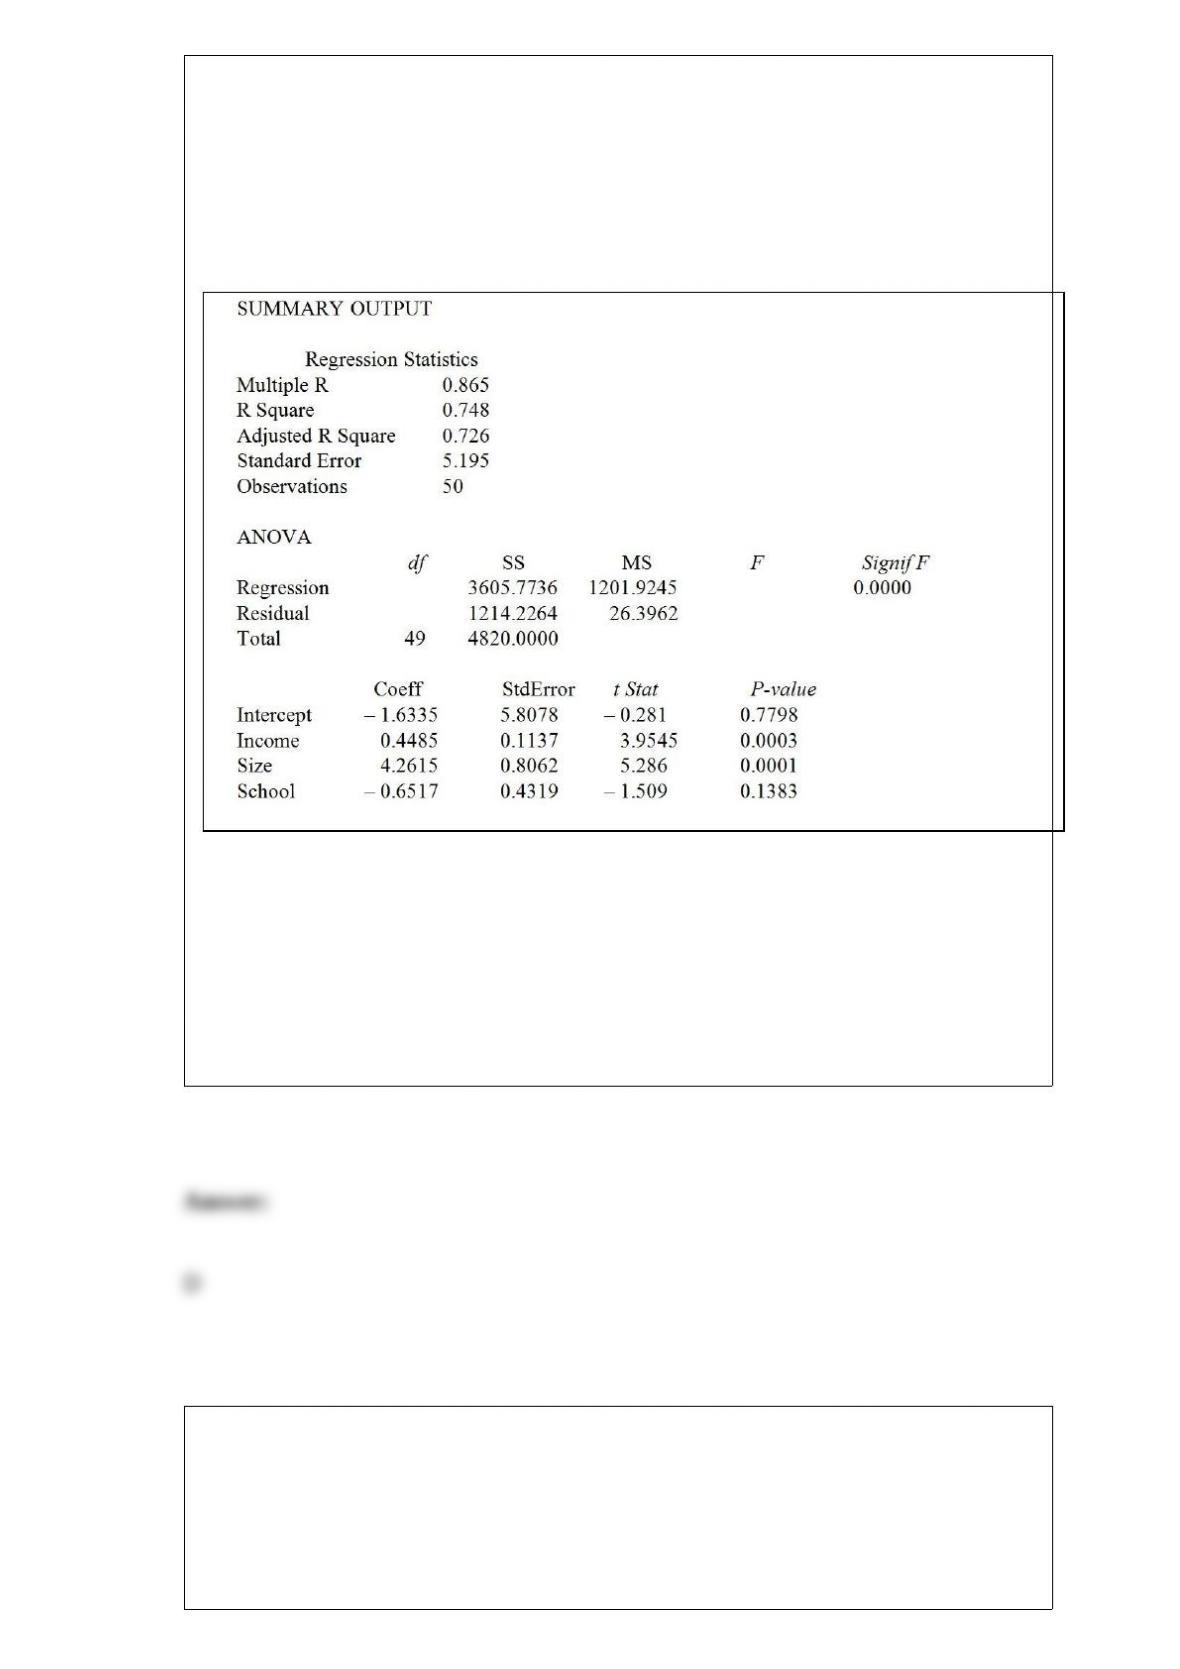
TABLE 17-1
A real estate builder wishes to determine how house size (House) is influenced by
family income (Income), family size (Size), and education of the head of household
(School). House size is measured in hundreds of square feet, income is measured in
thousands of dollars, and education is in years. The builder randomly selected 50
families and ran the multiple regression. Microsoft Excel output is provided below:
Referring to Table 17-1, one individual in the sample had an annual income of
$100,000, a family size of 10, and an education of 16 years. This individual owned a
home with an area of 7,000 square feet (House = 70.00). What is the residual (in
hundreds of square feet) for this data point?
A) 7.40
B) 2.52
C) -2.52
D) -5.40
TABLE 1-2
A Wall Street Journal poll asked 2,150 adults in the United States a series of questions
to find out their view on the U.S. economy.
Referring to Table 1-2, the possible responses to the question “What do you think is the
current number of people unemployed in the country?” are values from a
A) discrete numerical variable.
B) continuous numerical variable.
C) categorical variable.
D) table of random numbers.
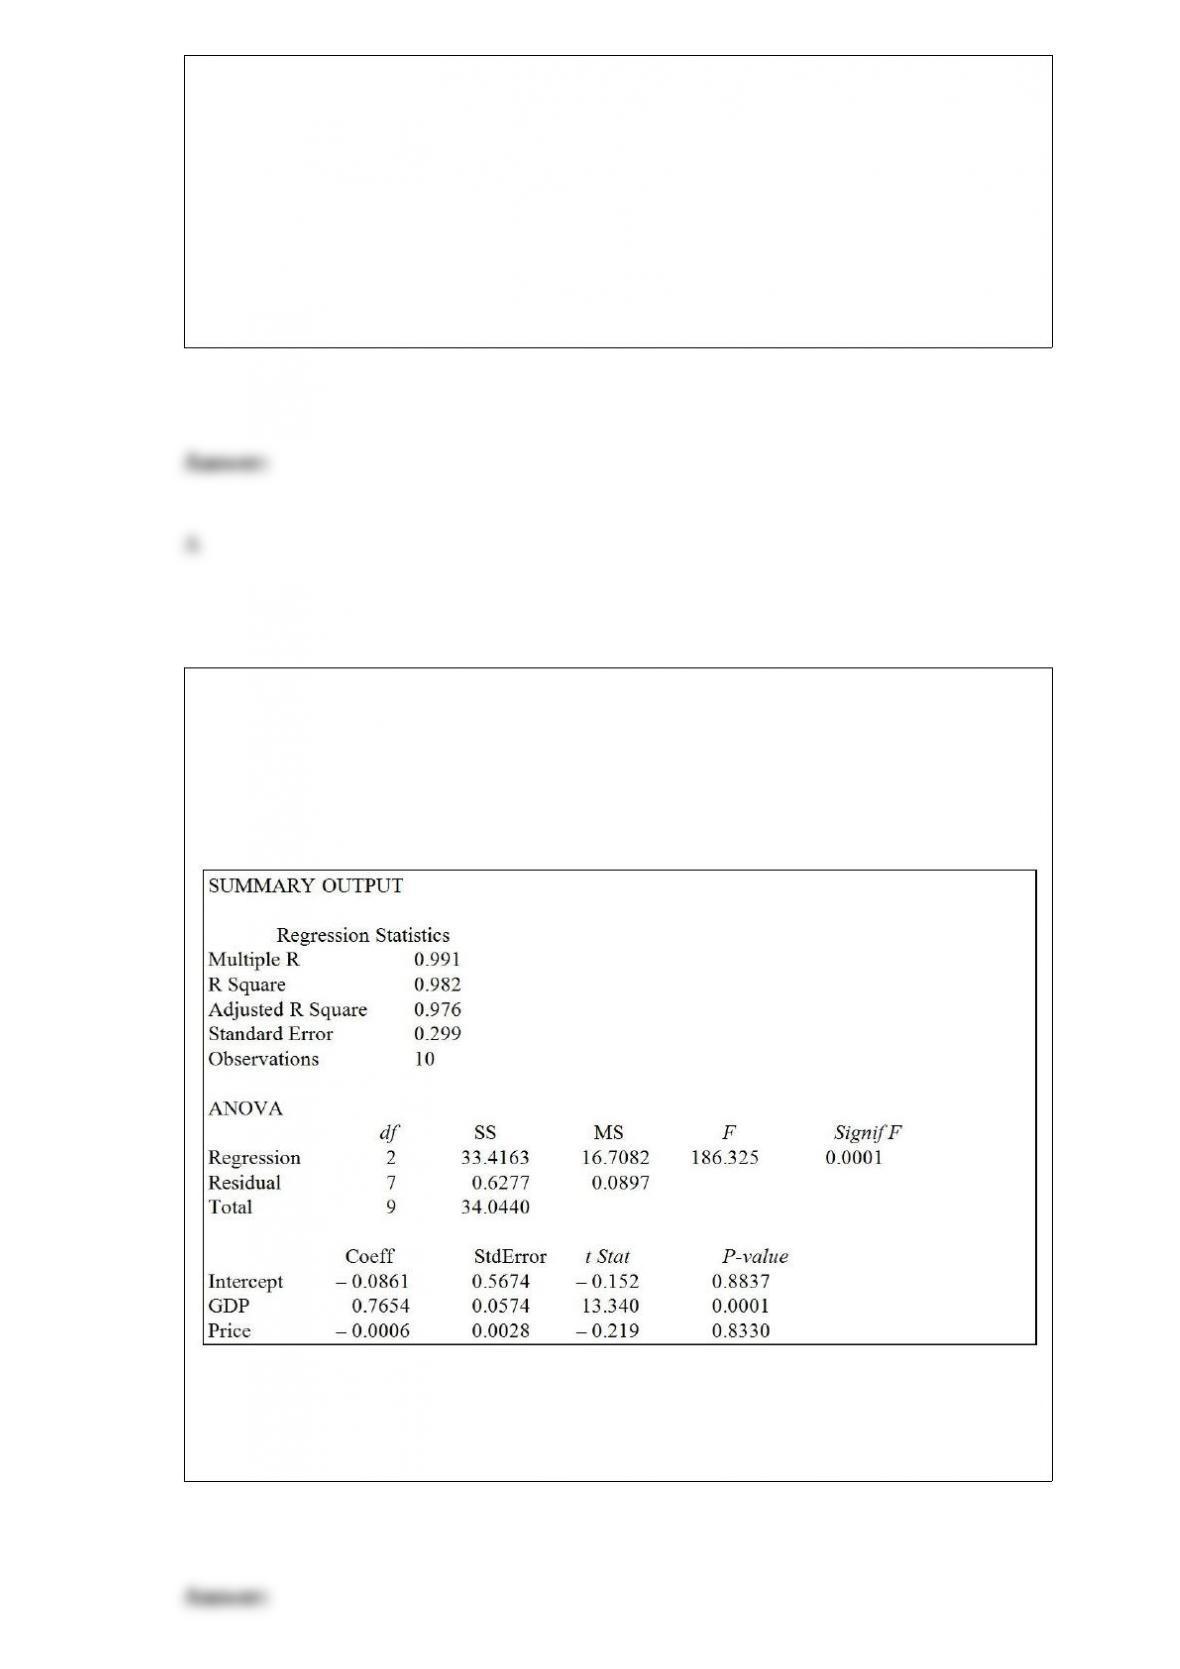
Referring to Table 14-3, the p-value for the regression model as a whole is
TABLE 14-3
An economist is interested to see how consumption for an economy (in $ billions) is
influenced by gross domestic product ($ billions) and aggregate price (consumer price
index). The Microsoft Excel output of this regression is partially reproduced below.
A) 0.05.
B) 0.01.
C) 0.001.
D) None of the above.
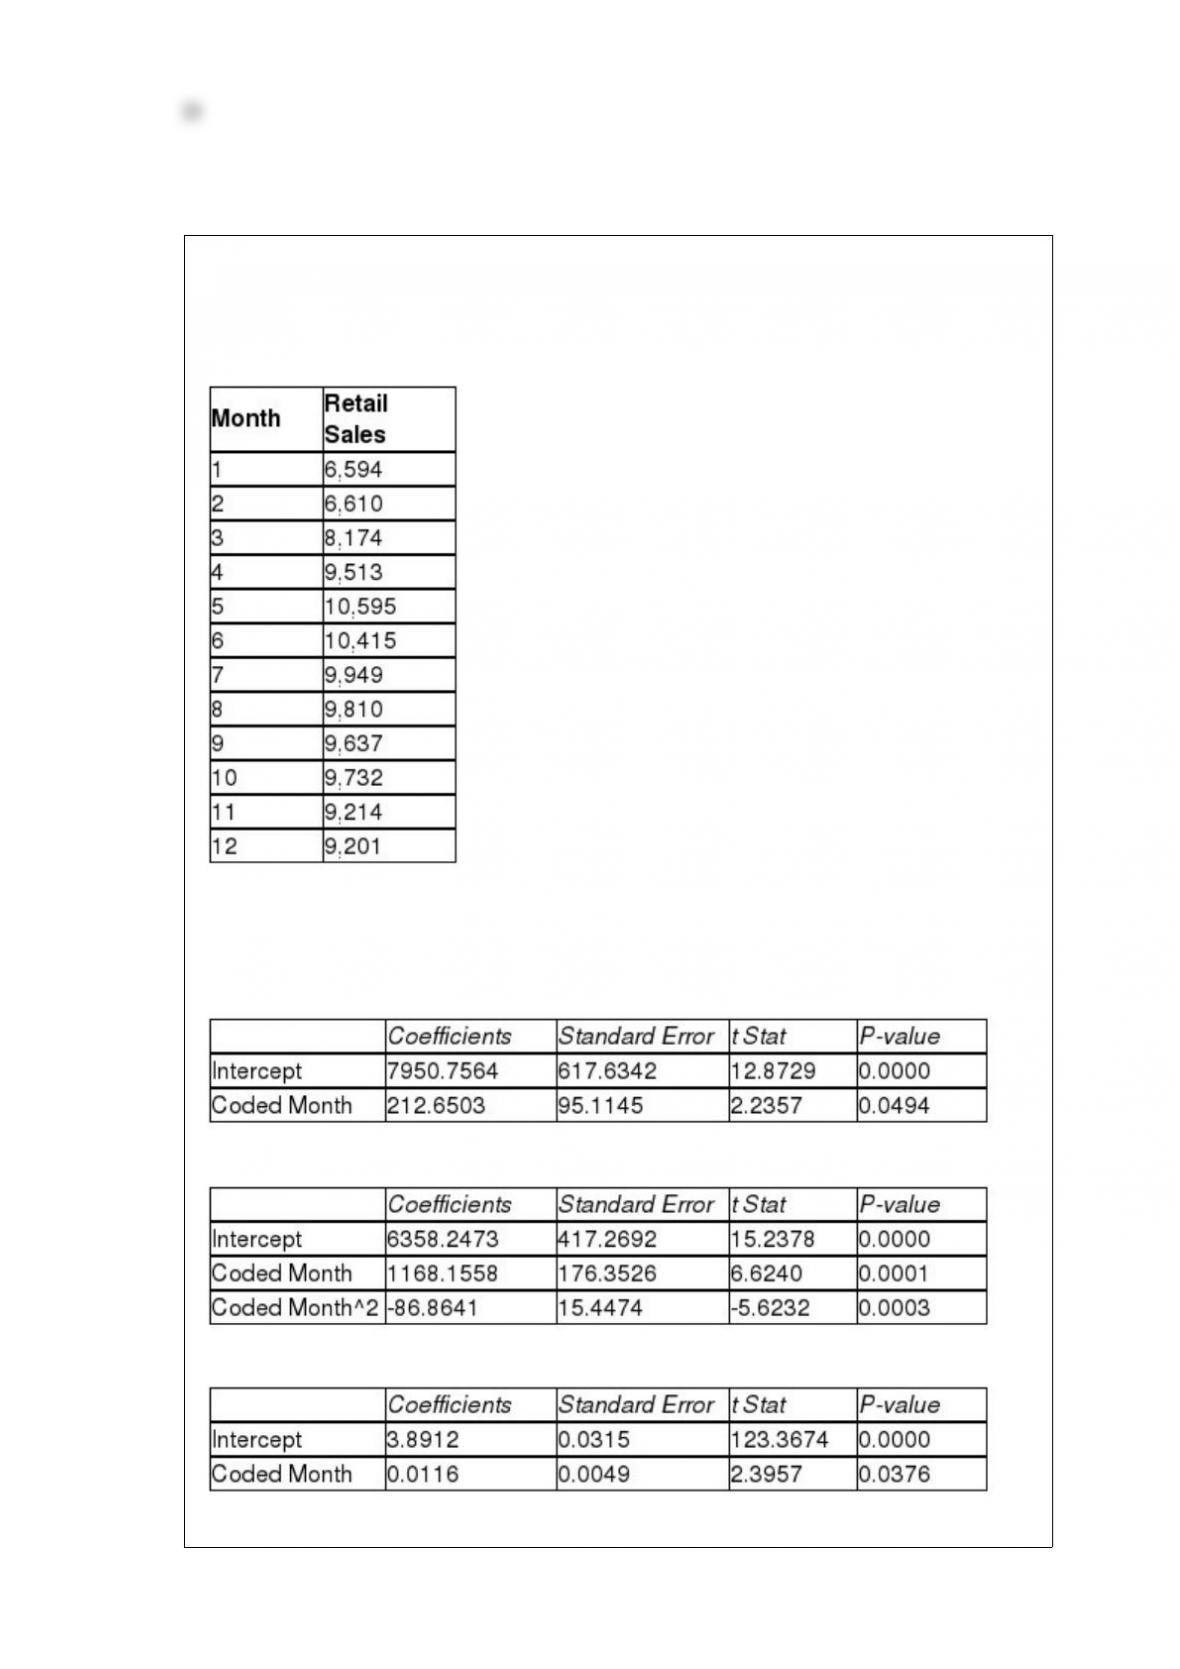
TABLE 16-13
Given below is the monthly time-series data for U.S. retail sales of building materials
over a specific year.
The results of the linear trend, quadratic trend, exponential trend, first-order
autoregressive, second-order autoregressive and third-order autoregressive model are
presented below in which the coded month for the 1st month is 0:
Linear trend model:
Quadratic trend model:
Exponential trend model:
First-order autoregressive:
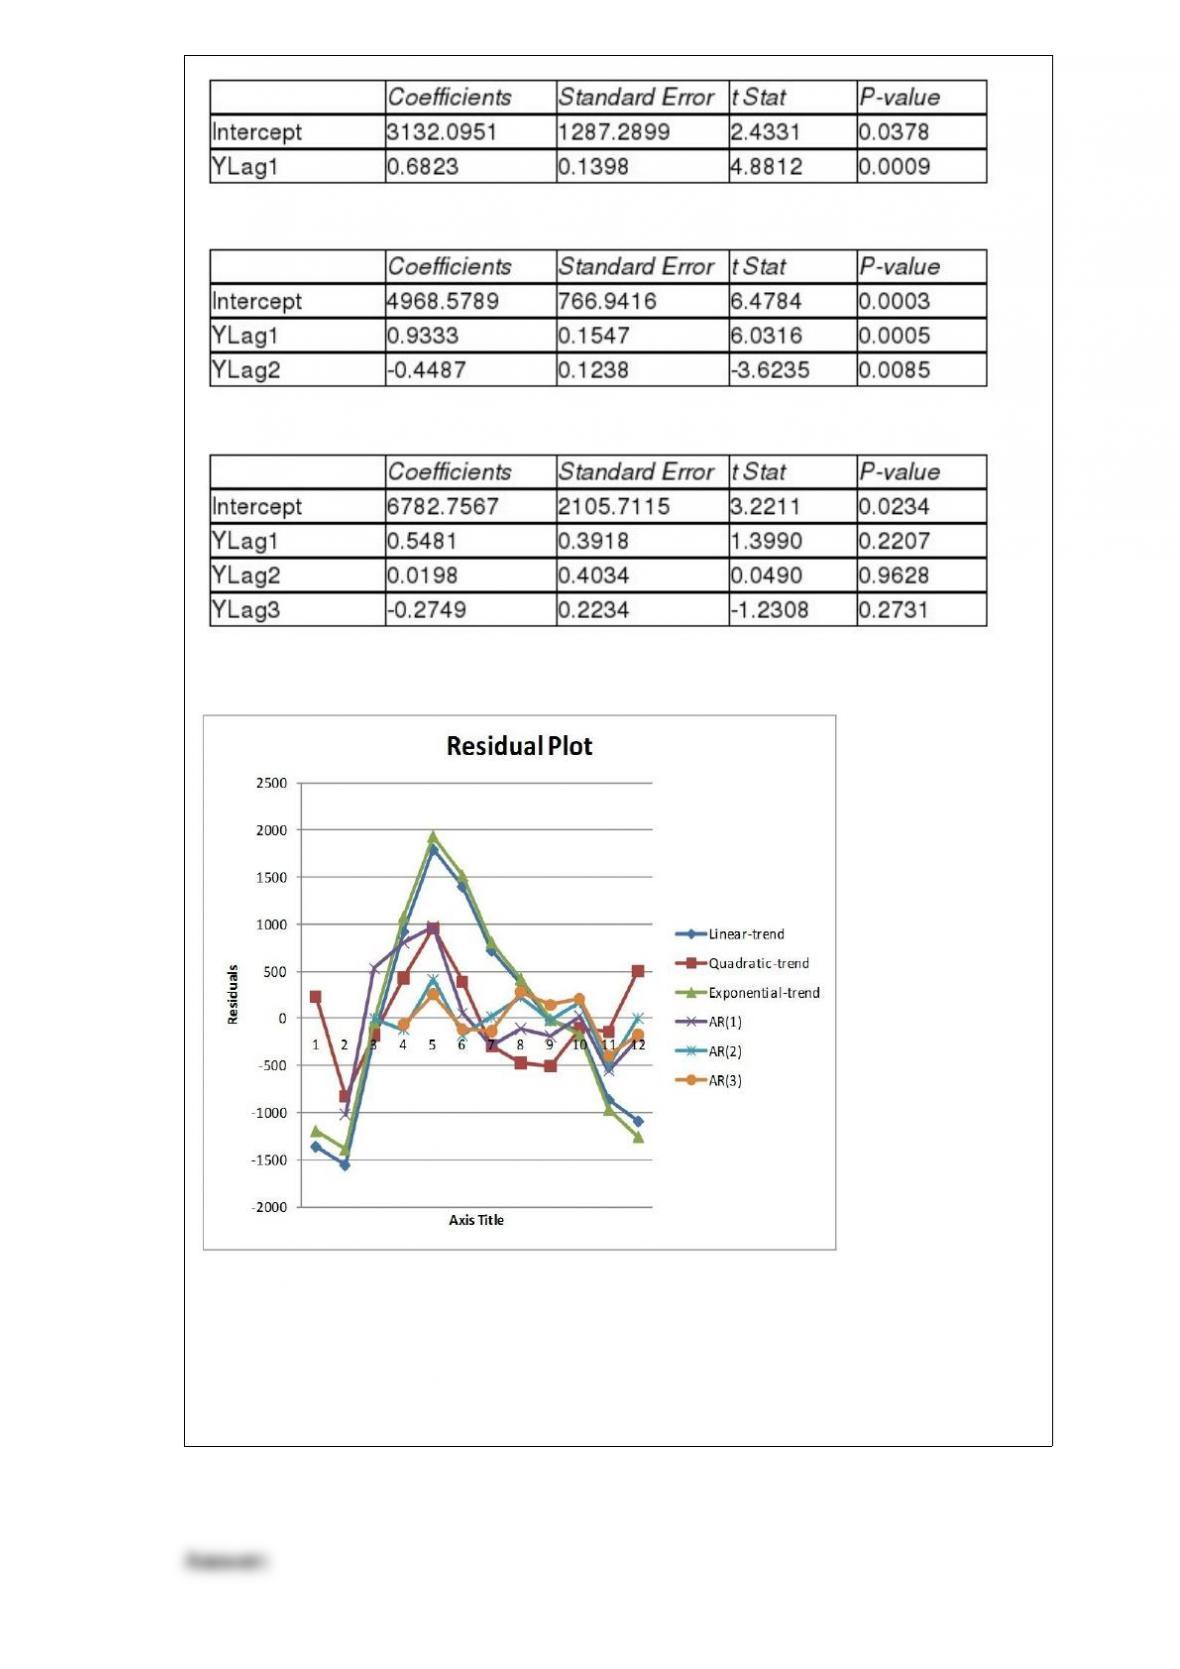
Second-order autoregressive:
Third-order autoregressive:
Below is the residual plot of the various models:
Referring to Table 16-13, the best autoregressive model using the 5% level of
significance is
A) first-order.
B) second-order.
C) third-order.
D) None of the above.

TABLE 2-1
An insurance company evaluates many numerical variables about a person before
deciding on an appropriate rate for automobile insurance. A representative from a local
insurance agency selected a random sample of insured drivers and recorded, X, the
number of claims each made in the last 3 years, with the following results.
Referring to Table 2-1, how many total claims are represented in the sample?
A) 15
B) 50
C) 111
D) 250
TABLE 19-1
The following payoff table shows profits associated with a set of 3 alternatives under 2
possible states of nature
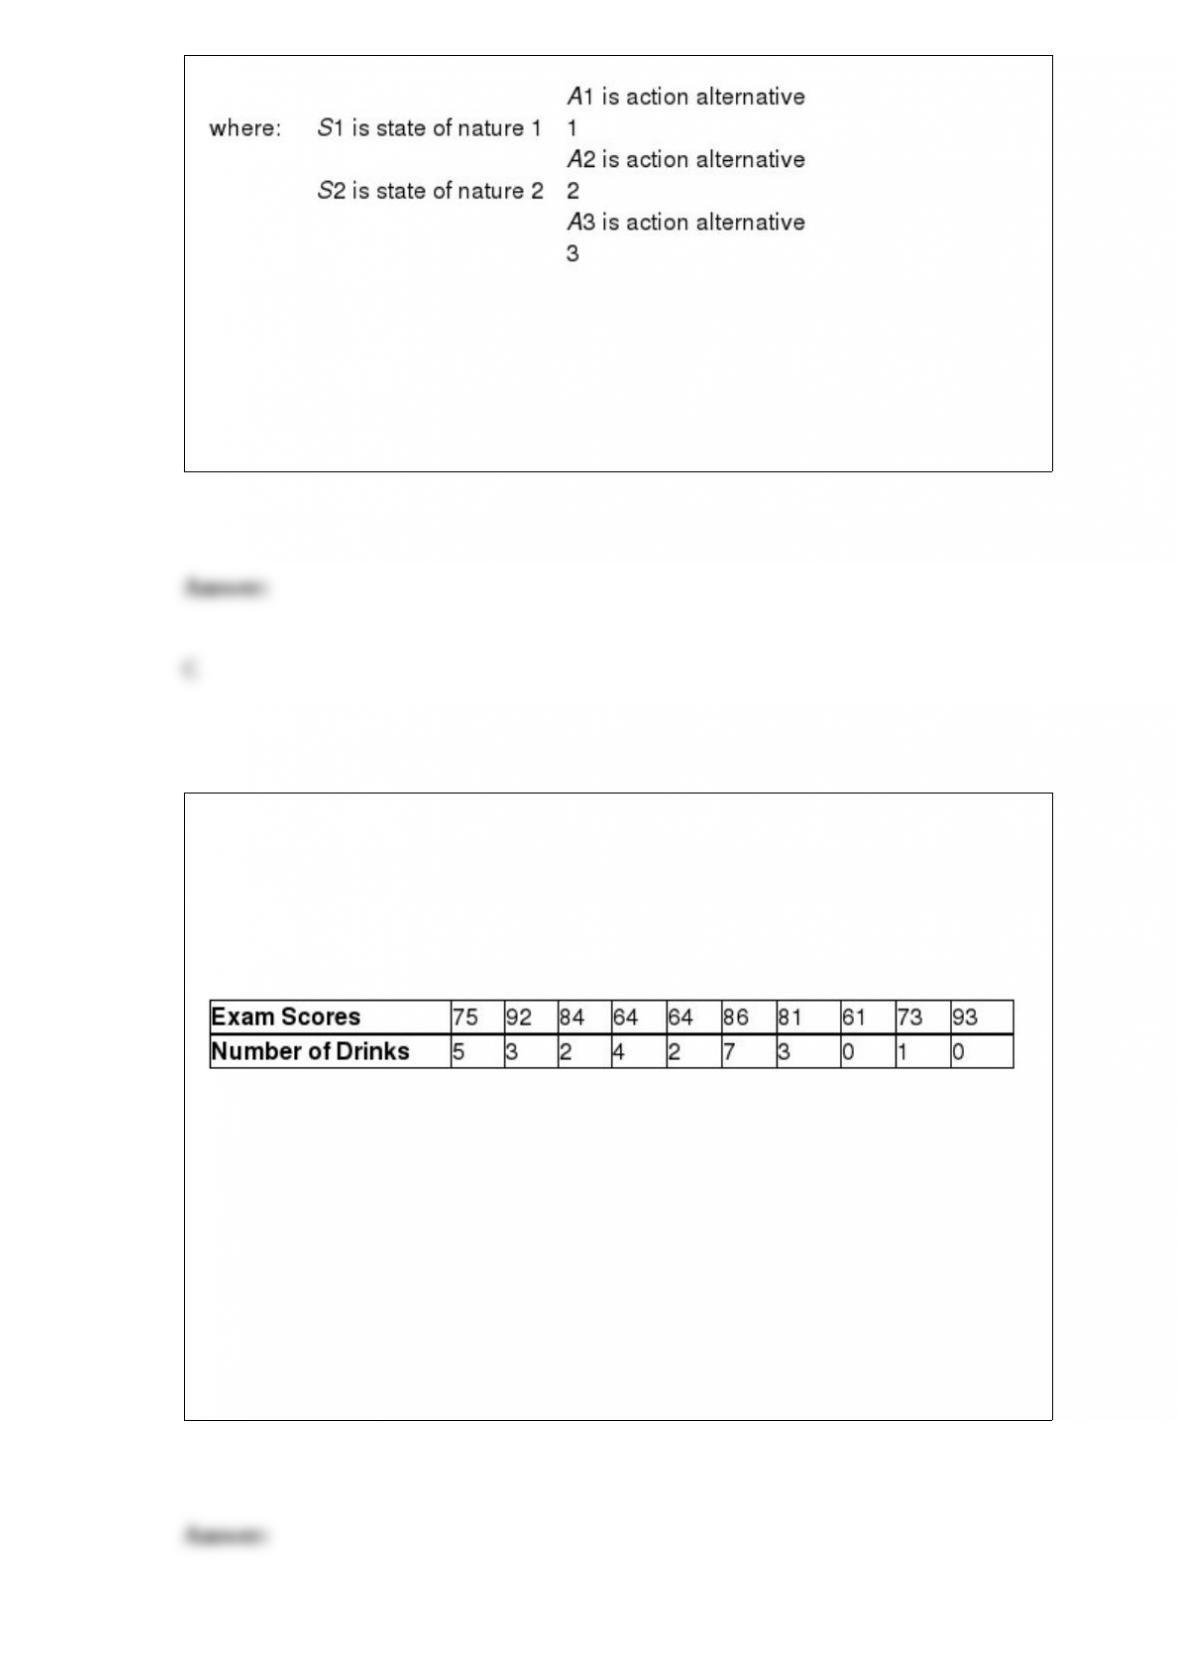
Referring to Table 19-1, if the probability of S1 is 0.5, then the return to risk ratio for
A1 is
A) 0.667.
B) 1.5.
C) 2.
D) 4.333.
TABLE 3-13
Energy drink consumption has continued to gain in popularity since the 1997 debut of
Red Bull, the current leader in the energy drink market. Given below are the exam
scores and the number of 12-ounce energy drinks consumed within a week prior to the
exam of 10 college students.
Referring to Table 3-13, how will you classify the linear relationship between the exam
scores and the number of energy drinks consumed?
A) weak
B) moderate
C) strong
D) no relationship

Blossom’s Flowers purchases roses for sale for Valentine’s Day. The roses are purchased
for $10 a dozen and are sold for $20 a dozen. Any roses not sold on Valentine’s Day can
be sold for $5 per dozen. The owner will purchase 1 of 3 amounts of roses for
Valentine’s Day: 100, 200, or 400 dozen roses. Given 0.2, 0.4, and 0.6 are the
probabilities for the sale of 100, 200, or 400 dozen roses, respectively, then the EMV for
buying 200 dozen roses is
A) $4,500.
B) $2,500.
C) $1,700.
D) $1,000.
TABLE 1-1
The manager of the customer service division of a major consumer electronics company
is interested in determining whether the customers who have purchased a Blu-ray
player made by the company over the past 12 months are satisfied with their products.
Referring to Table 1-1, the possible responses to the question “Are you happy,
indifferent, or unhappy with the performance per dollar spent on the Blu-ray player?”
are values from a
A) discrete numerical variable.
B) continuous numerical variable.
C) categorical variable.
D) table of random numbers.
The director of a training program wanted to know if a one-week orientation would
change the perception of potential clients who would perceive the program as being
good. He collected information on the number of clients who would rate the program as
being good before and after the orientation. Which of the following tests will be the
most appropriate?
A) χ2 test for proportions
B) McNemar test
C) Wilcoxon rank sum test
D) Tukey-Kramer procedure
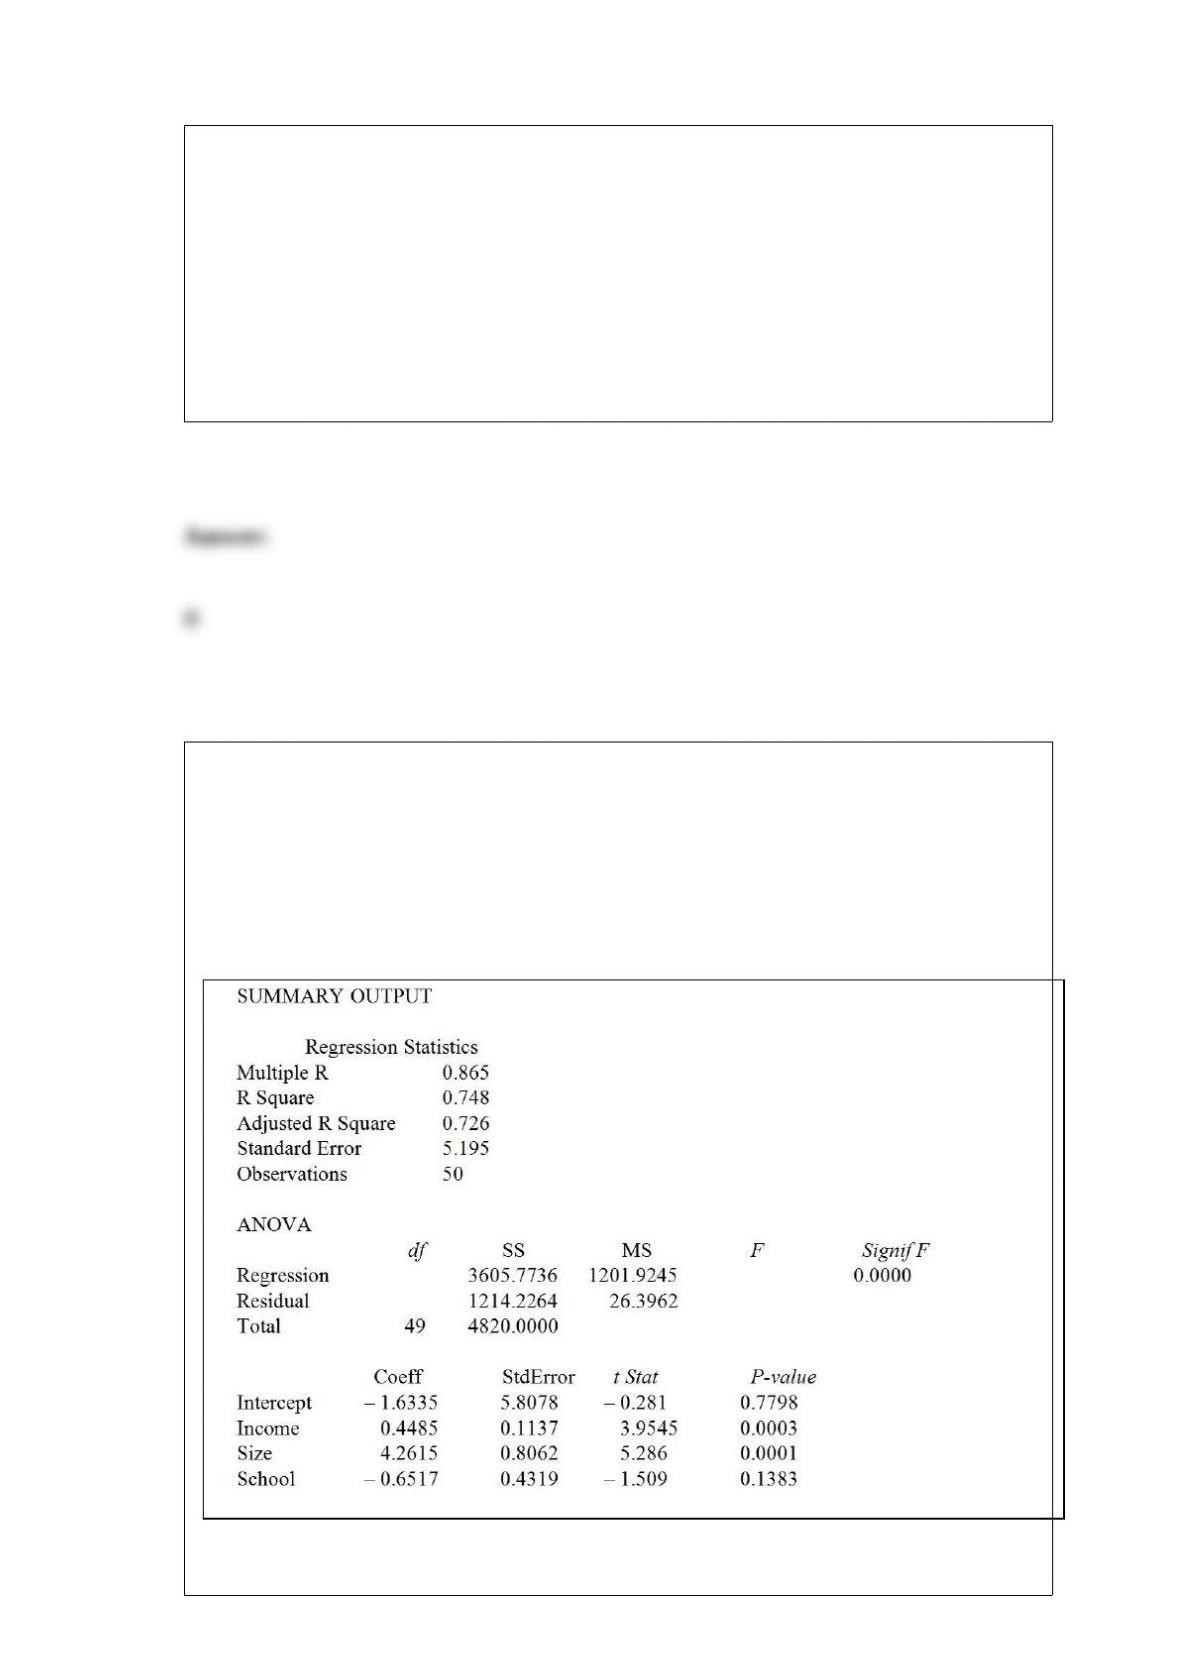
TABLE 17-1
A real estate builder wishes to determine how house size (House) is influenced by
family income (Income), family size (Size), and education of the head of household
(School). House size is measured in hundreds of square feet, income is measured in
thousands of dollars, and education is in years. The builder randomly selected 50
families and ran the multiple regression. Microsoft Excel output is provided below:
Referring to Table 17-1, what fraction of the variability in house size is explained by
income, size of family, and education?

A) 27.0%
B) 33.4%
C) 74.8%
D) 86.5%
If we are testing for the difference between the means of 2 independent populations
presuming equal variances with samples of n1 = 20 and n2 = 20, the number of degrees
of freedom is equal to
A) 39.
B) 38.
C) 19.
D) 18.
Referring to Table 14-11, in terms of the βs in the model, give the
mean change in weight loss (Y) for every 1 month increase in time on
the program (X1) when attending the morning session.
TABLE 14-11
A weight-loss clinic wants to use regression analysis to build a model
for weight loss of a client (measured in pounds). Two variables
thought to affect weight loss are client’s length of time on the
weight-loss program and time of session. These variables are
described below:
Y = Weight loss (in pounds)

X1 = Length of time in weight-loss program (in months)
X2 = 1 if morning session, 0 if not
Data for 25 clients on a weight-loss program at the clinic were
collected and used to /t the interaction model:
Y = β0 + β1X1 + β2X2 + β3X1X2 + ε
Output from Microsoft Excel follows:
A) β1
B) β1 + β2
C) β1 + β3
D) β2 + β3
TABLE 3-2
The data below represent the amount of grams of carbohydrates in a serving of
breakfast cereal in a sample of 11 different servings.
Referring to Table 3-2, the median carbohydrate amount in the cereal is ________
grams.
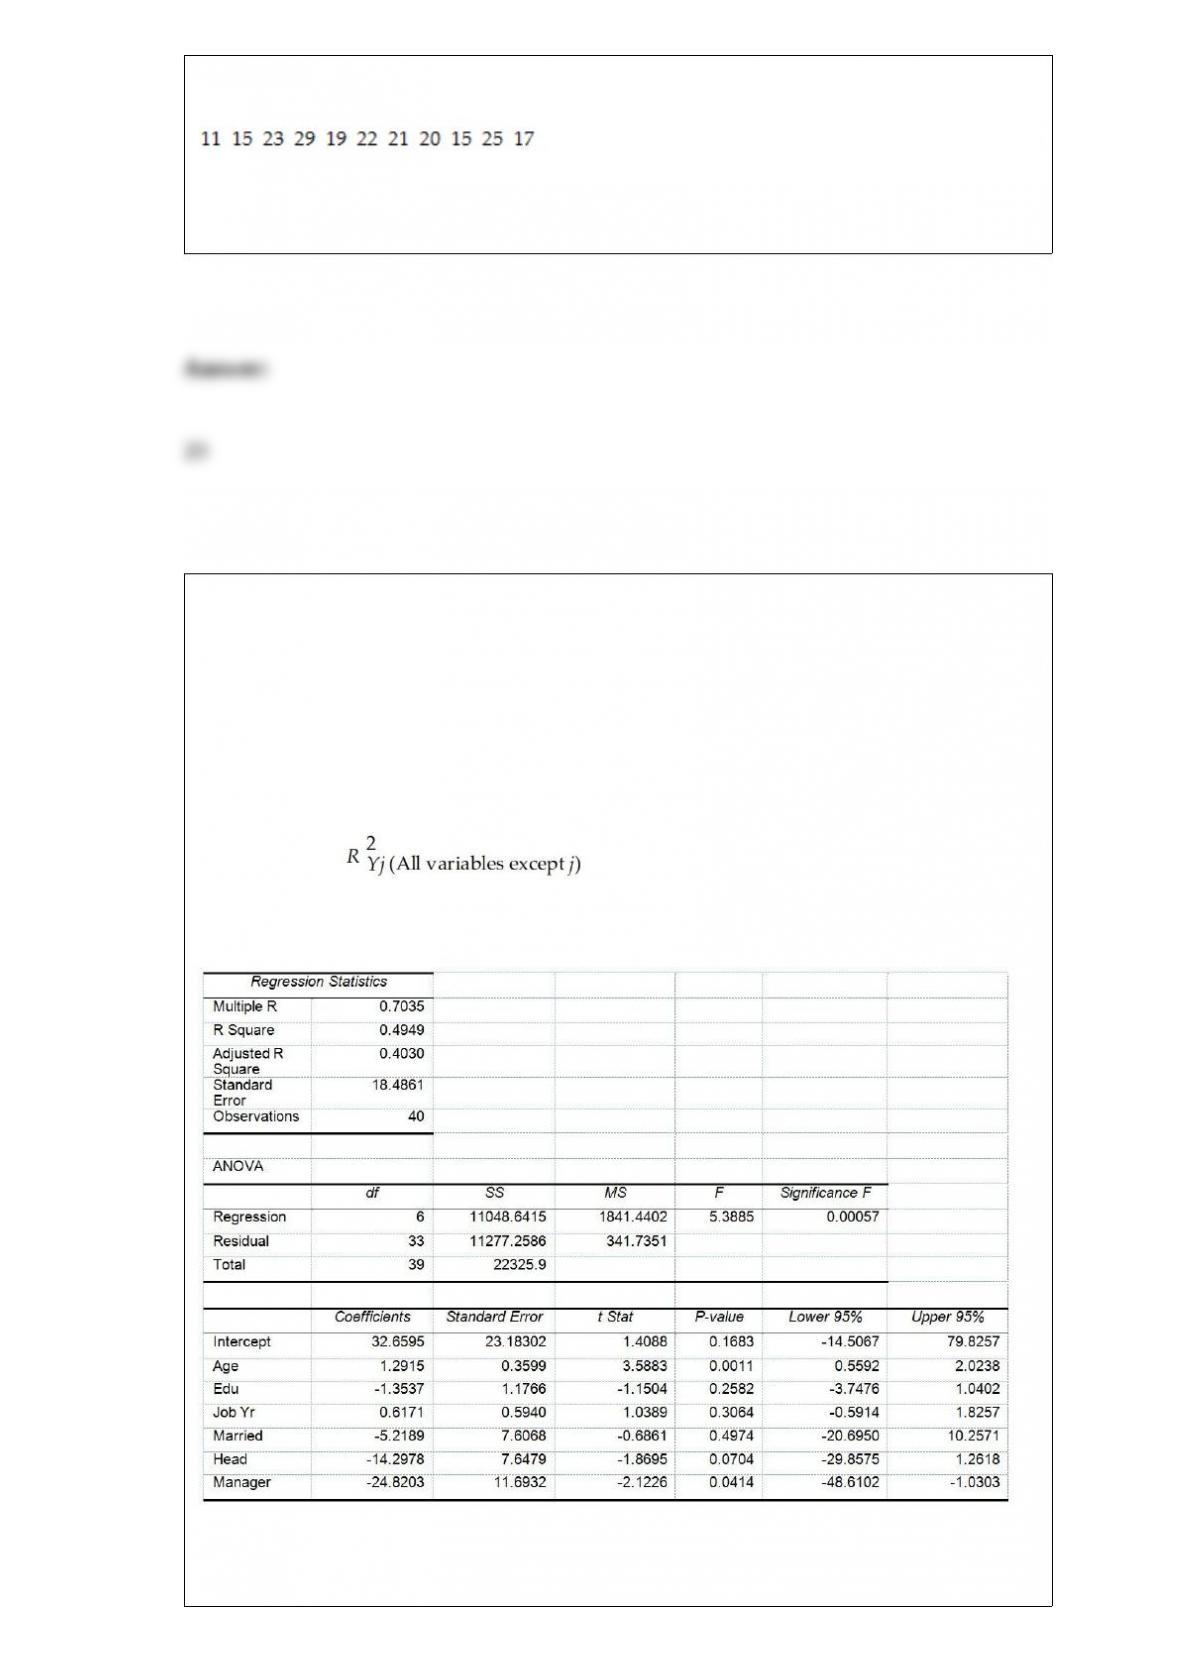
TABLE 17-10
Given below are results from the regression analysis where the dependent variable is
the number of weeks a worker is unemployed due to a layoff (Unemploy) and the
independent variables are the age of the worker (Age), the number of years of education
received (Edu), the number of years at the previous job (Job Yr), a dummy variable for
marital status (Married: 1 = married, 0 = otherwise), a dummy variable for head of
household (Head: 1 = yes, 0 = no) and a dummy variable for management position
(Manager: 1 = yes, 0 = no). We shall call this Model 1. The coefficient of partial
determination ( ) of each of the 6 predictors are, respectively,
0.2807, 0.0386, 0.0317, 0.0141, 0.0958, and 0.1201.
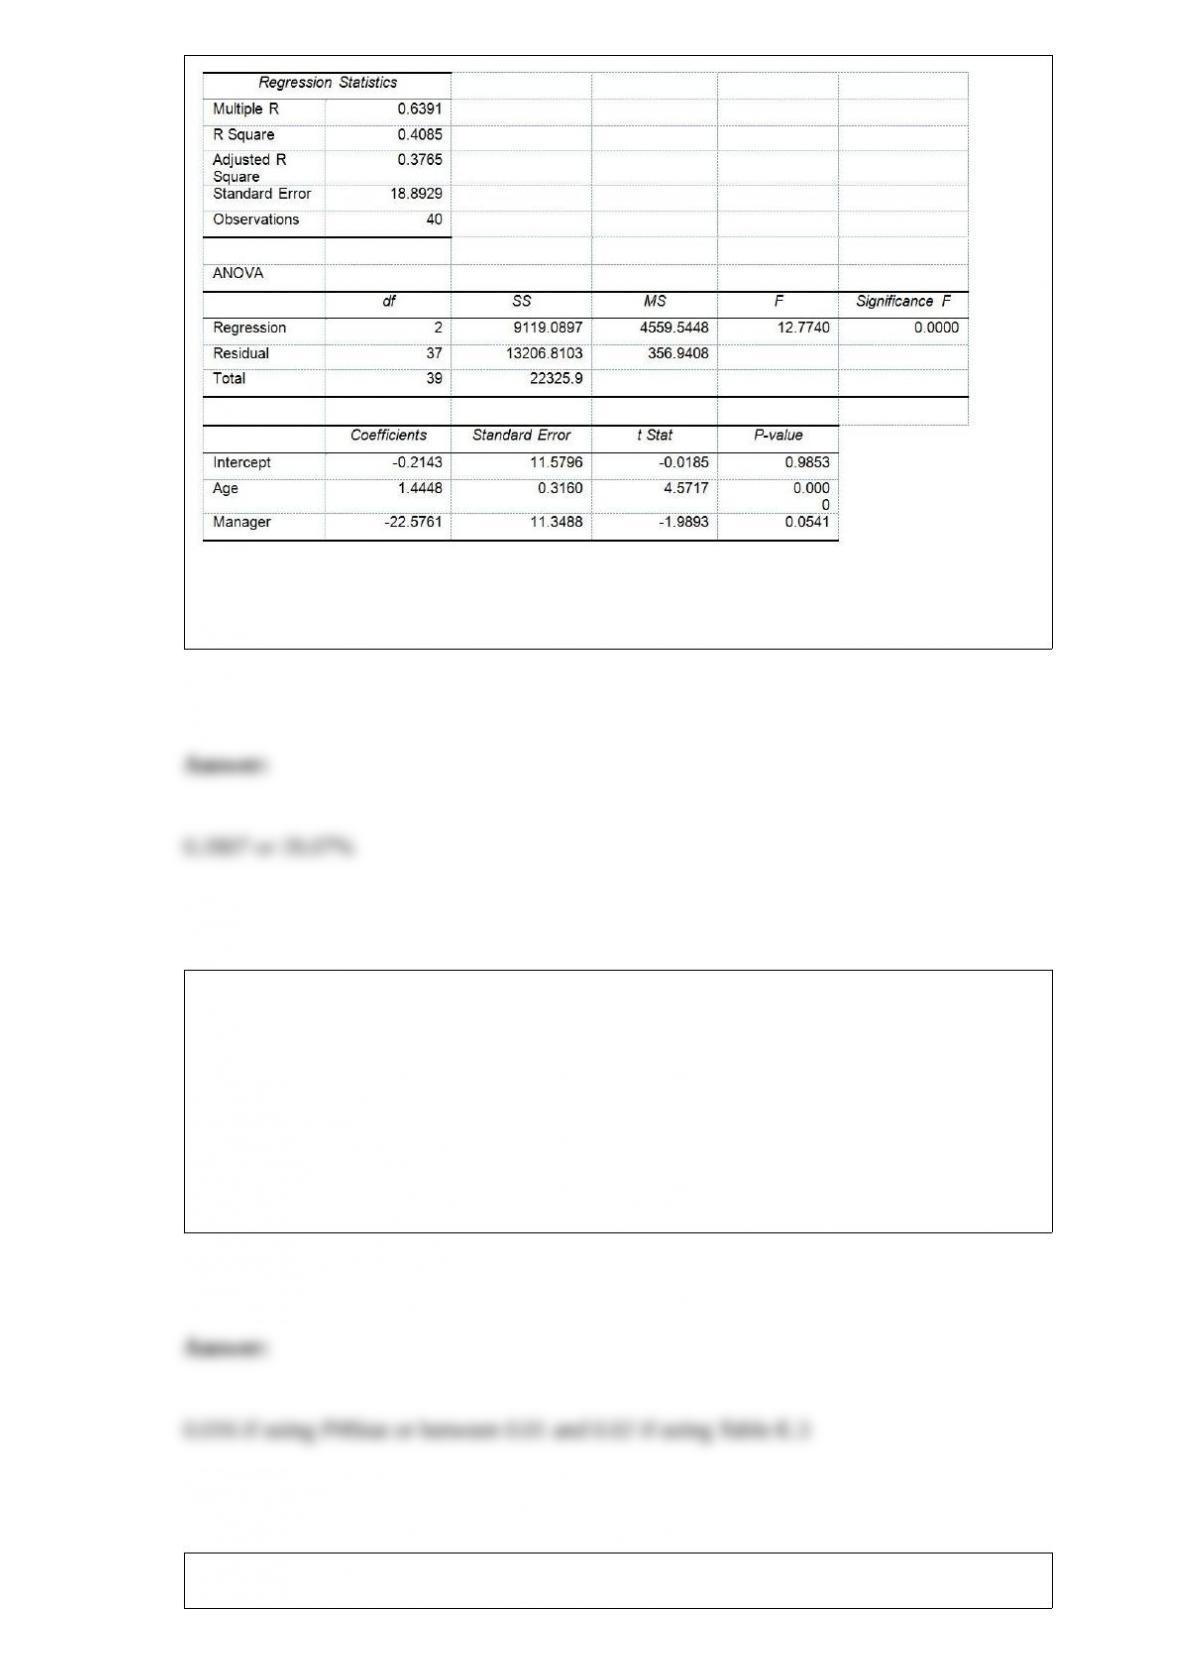
Model 2 is the regression analysis where the dependent variable is Unemploy and the
independent variables are Age and Manager. The results of the regression analysis are
given below:
Referring to Table 17-10, Model 1, ________ of the variation in the number of weeks a
worker is unemployed due to a layoff can be explained by the age of the worker while
controlling for the other independent variables.
TABLE 10-4
Two samples each of size 25 are taken from independent populations assumed to be
normally distributed with equal variances. The first sample has a mean of 35.5 and
standard deviation of 3.0 while the second sample has a mean of 33.0 and standard
deviation of 4.0.
Referring to Table 10-4, the p-value for a two-tail test is ________.
Referring to Table 17-3, the value of the adjusted coefficient of multiple determination,

adj r2, is ________.
TABLE 9-12
A drug company is considering marketing a new local anesthetic. The effective time of
the anesthetic the drug company is currently producing has a normal distribution with a
mean of 7.4 minutes with a standard deviation of 1.2 minutes. The chemistry of the new
anesthetic is such that the effective time should be normally distributed with the same
standard deviation. The company will market the new local anesthetic as being better if
there is evidence that the population mean effective time is greater than the 7.4 minutes
of the current local anesthetic.
Referring to Table 9-12, if you select a sample of 25 new local anesthetics and are
willing to have a level of significance of 0.05, the probability of the company
incorrectly marketing the new local anesthetic when it is not better is ________.
TABLE 17-10
Given below are results from the regression analysis where the dependent variable is
the number of weeks a worker is unemployed due to a layoff (Unemploy) and the
independent variables are the age of the worker (Age), the number of years of education
received (Edu), the number of years at the previous job (Job Yr), a dummy variable for
marital status (Married: 1 = married, 0 = otherwise), a dummy variable for head of
household (Head: 1 = yes, 0 = no) and a dummy variable for management position
(Manager: 1 = yes, 0 = no). We shall call this Model 1. The coefficient of partial
determination ( ) of each of the 6 predictors are, respectively,
0.2807, 0.0386, 0.0317, 0.0141, 0.0958, and 0.1201.
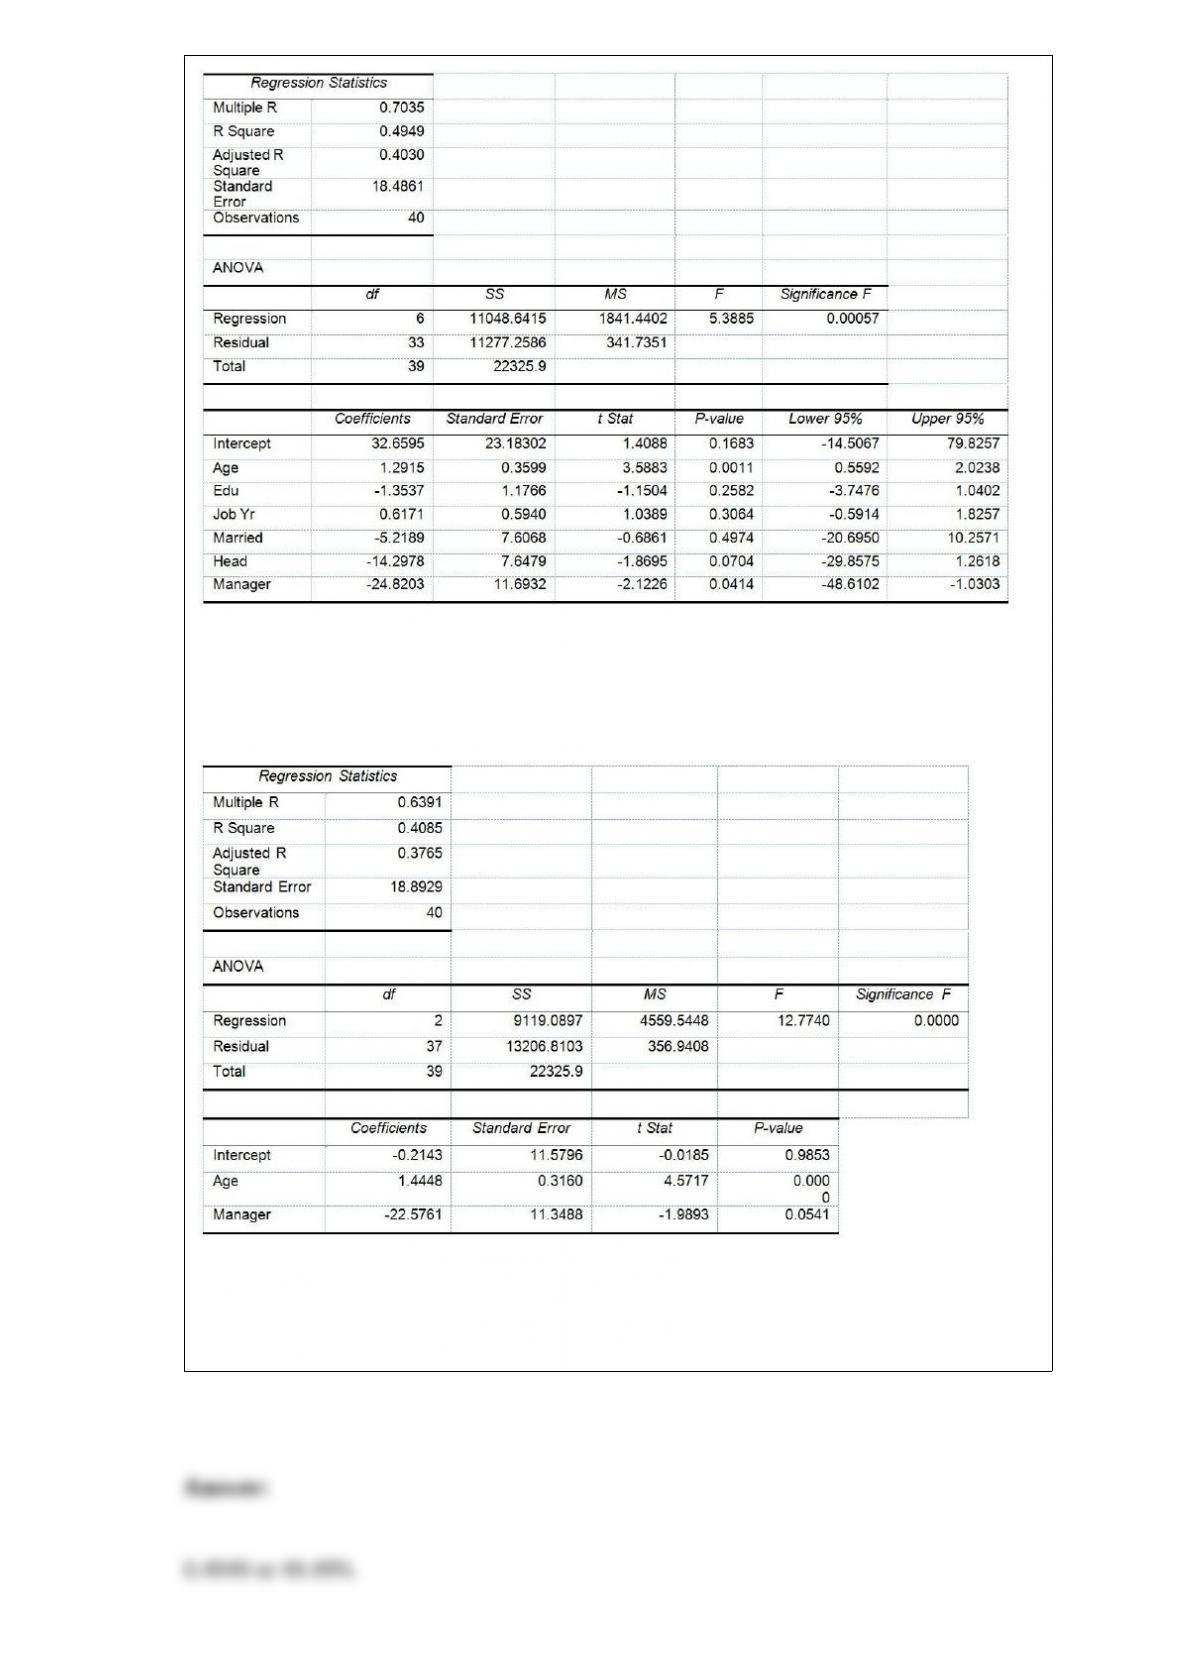
Model 2 is the regression analysis where the dependent variable is Unemploy and the
independent variables are Age and Manager. The results of the regression analysis are
given below:
Referring to Table 17-10, Model 1, ________ of the variation in the number of weeks a
worker is unemployed due to a layoff can be explained by the six independent
variables.

Referring to Table 14-17, what is the value of the test statistic to
determine whether there is a signiticant relationship between the
number of weeks a worker is unemployed due to a layo8 and the
entire set of explanatory variables?
TABLE 14-17
Given below are results from the regression analysis where the
dependent variable is the number of weeks a worker is unemployed
due to a layo8 (Unemploy) and the independent variables are the age
of the worker (Age) and a dummy variable for management position
(Manager: 1 = yes, 0 = no).
The results of the regression analysis are given below: