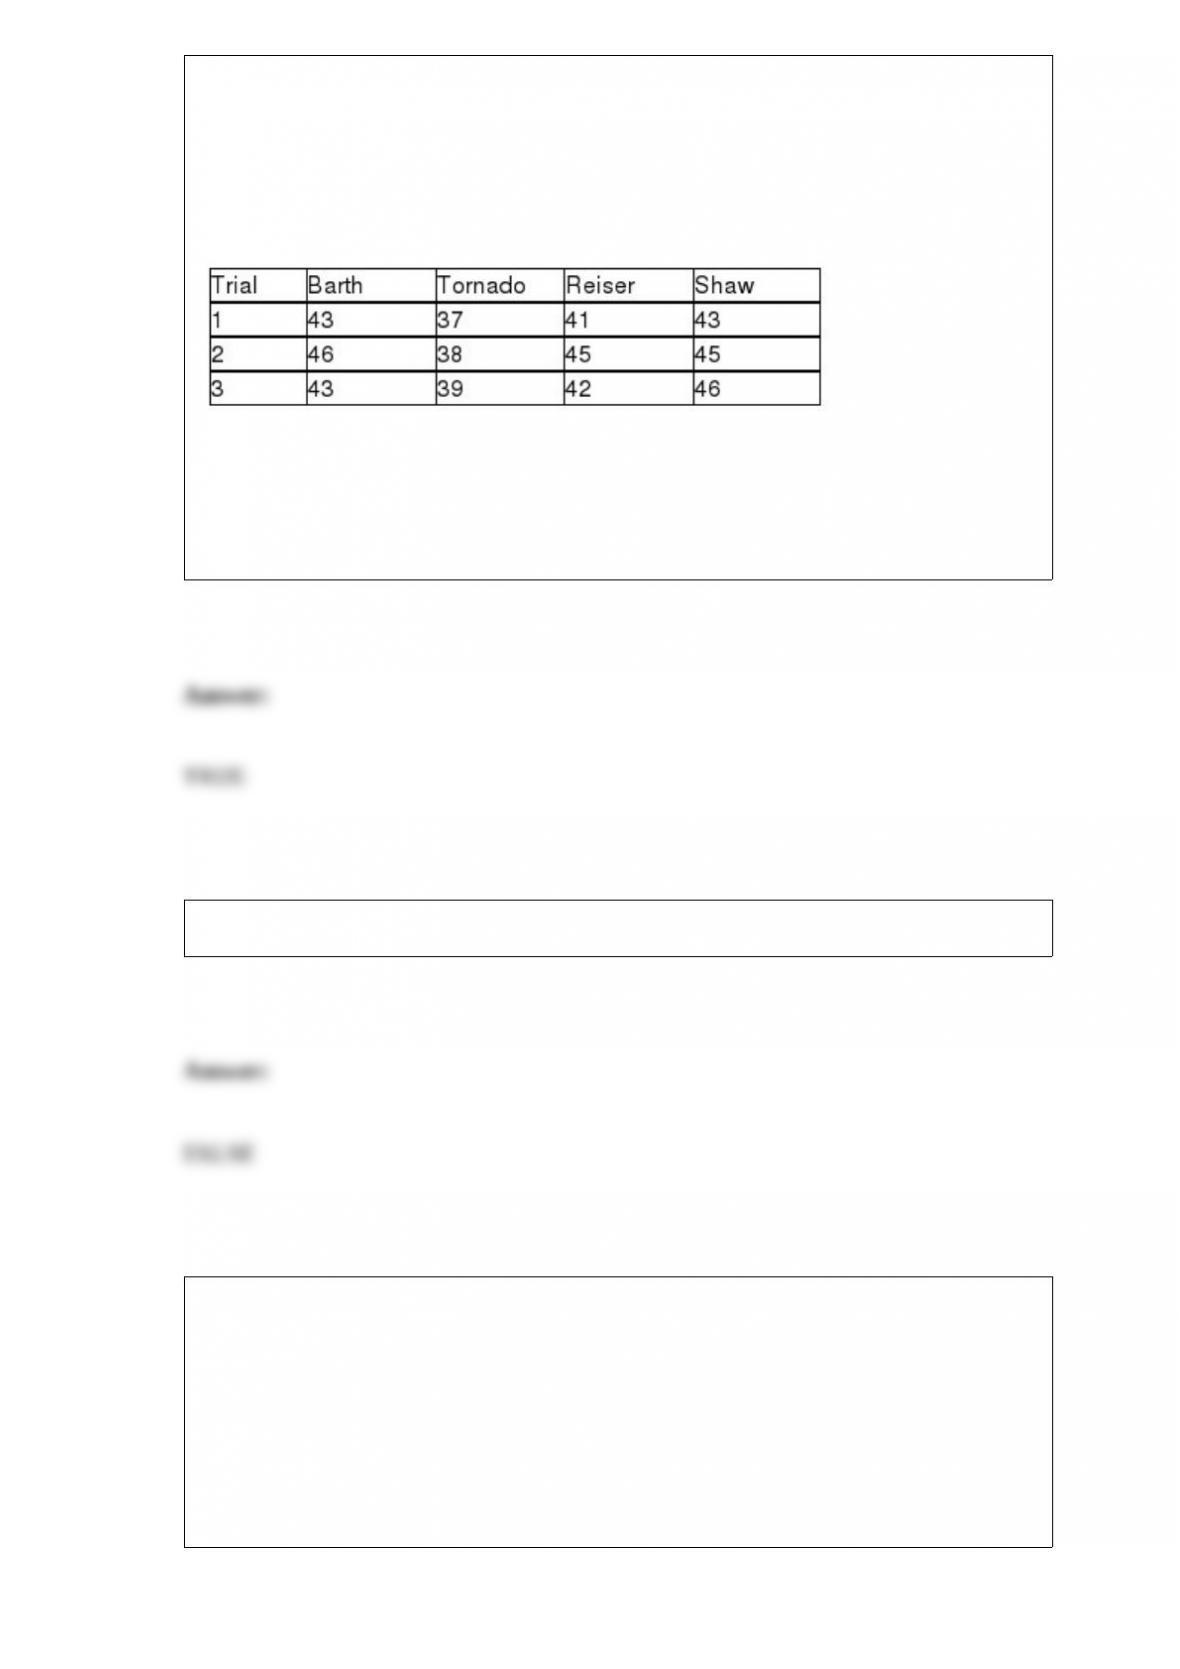
TABLE 11-3
As part of an evaluation program, a sporting goods retailer wanted to compare the
downhill coasting speeds of 4 brands of bicycles. She took 3 of each brand and
determined their maximum downhill speeds. The results are presented in miles per hour
in the table below.
True or False: Referring to Table 11-3, based on the Tukey-Kramer procedure with an
overall level of significance of 0.05, the retailer would decide that the mean speed for
the Tornado brand is significantly different from each of the mean speeds for other
brands.
True or False: The V in the DCOVA framework stands for “verify.”
TABLE 15-4
The superintendent of a school district wanted to predict the percentage of students
passing a sixth-grade proficiency test. She obtained the data on percentage of students
passing the proficiency test (% Passing), daily mean of the percentage of students
attending class (% Attendance), mean teacher salary in dollars (Salaries), and
instructional spending per pupil in dollars (Spending) of 47 schools in the state.
Let Y = % Passing as the dependent variable, X1 = % Attendance, X2 = Salaries and X3
= Spending.
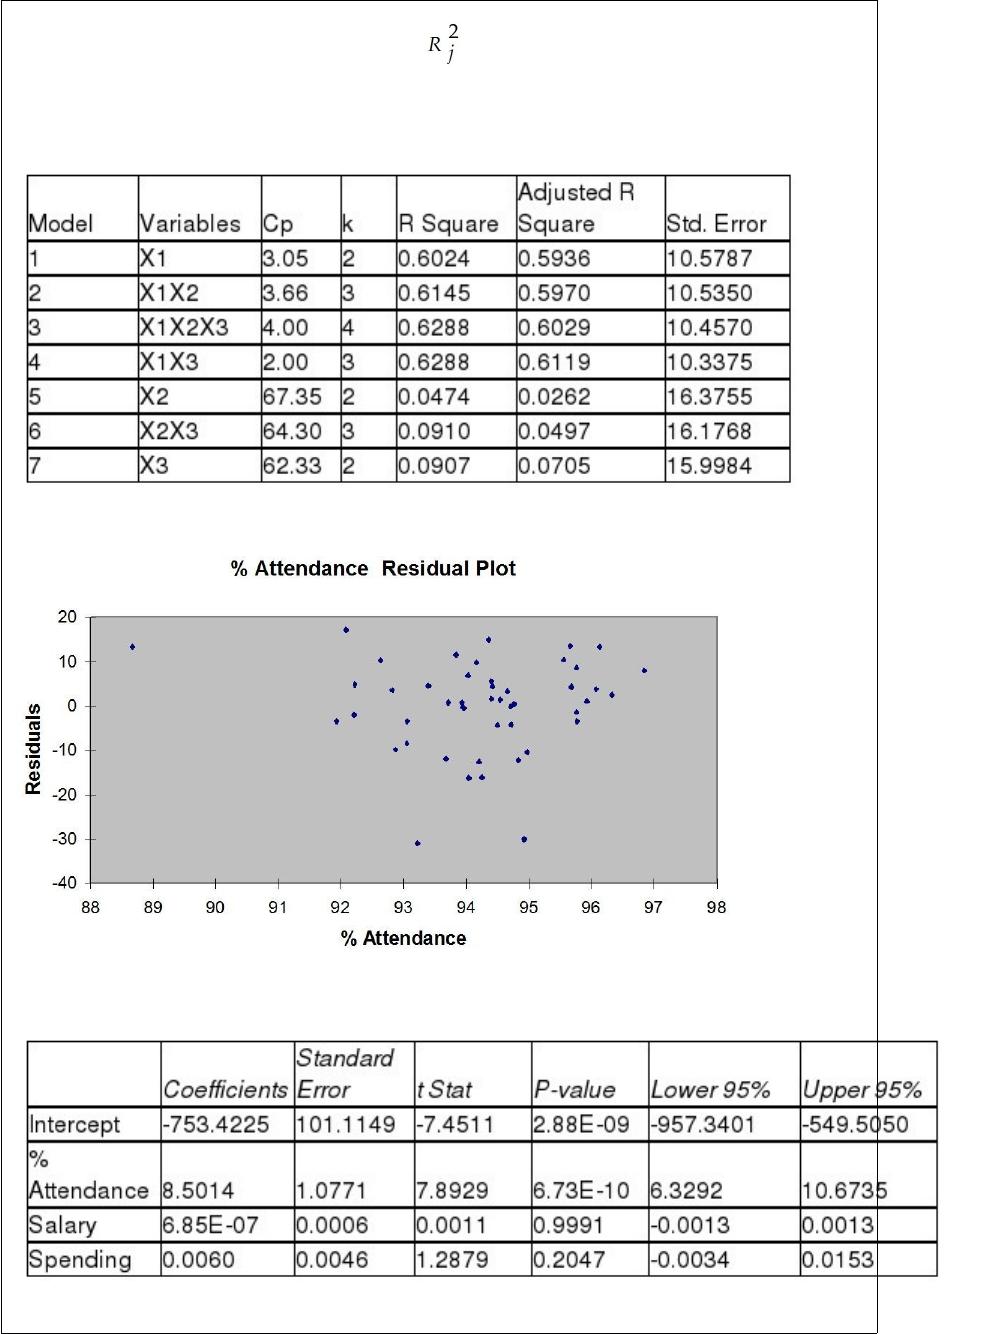
The coefficient of multiple determination ( ) of each of the 3 predictors with all the
other remaining predictors are, respectively, 0.0338, 0.4669, and 0.4743.
The output from the best-subset regressions is given below:
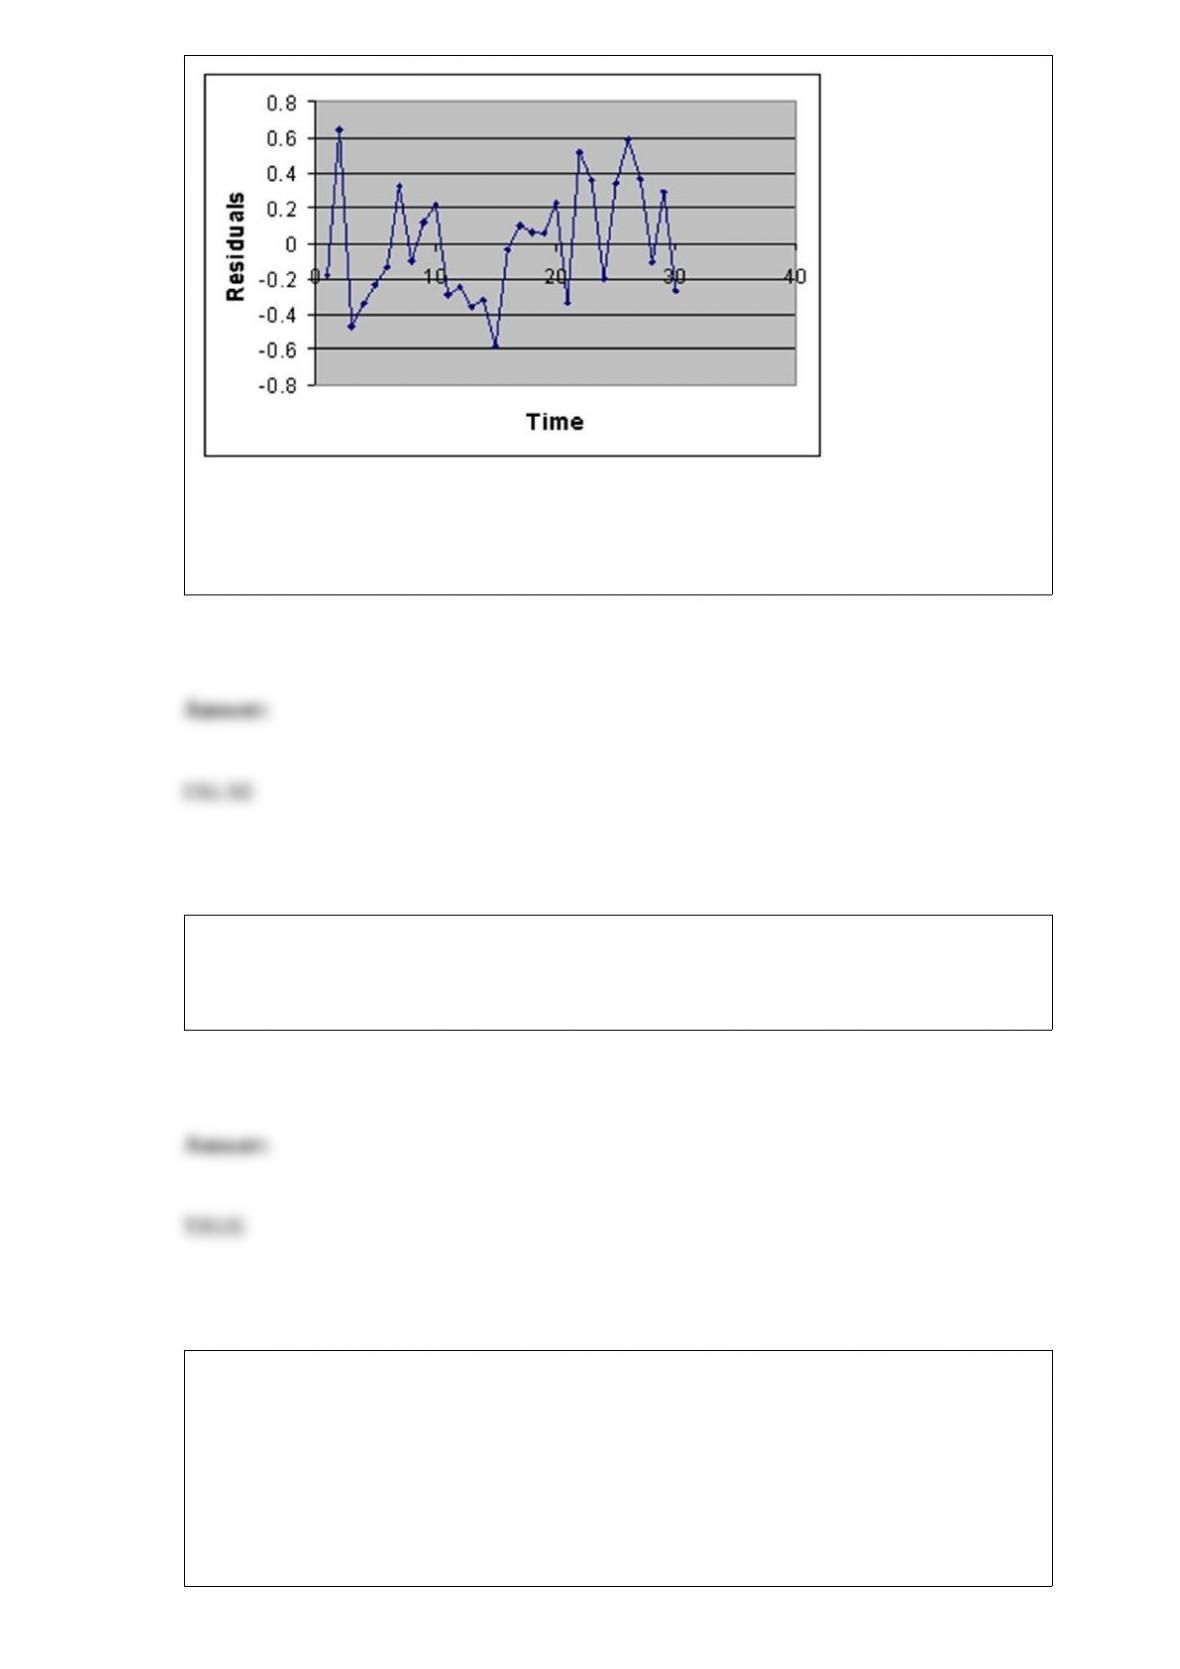
Following is the residual plot for % Attendance:
Following is the output of several multiple regression models:
Model (I):
Model (II):
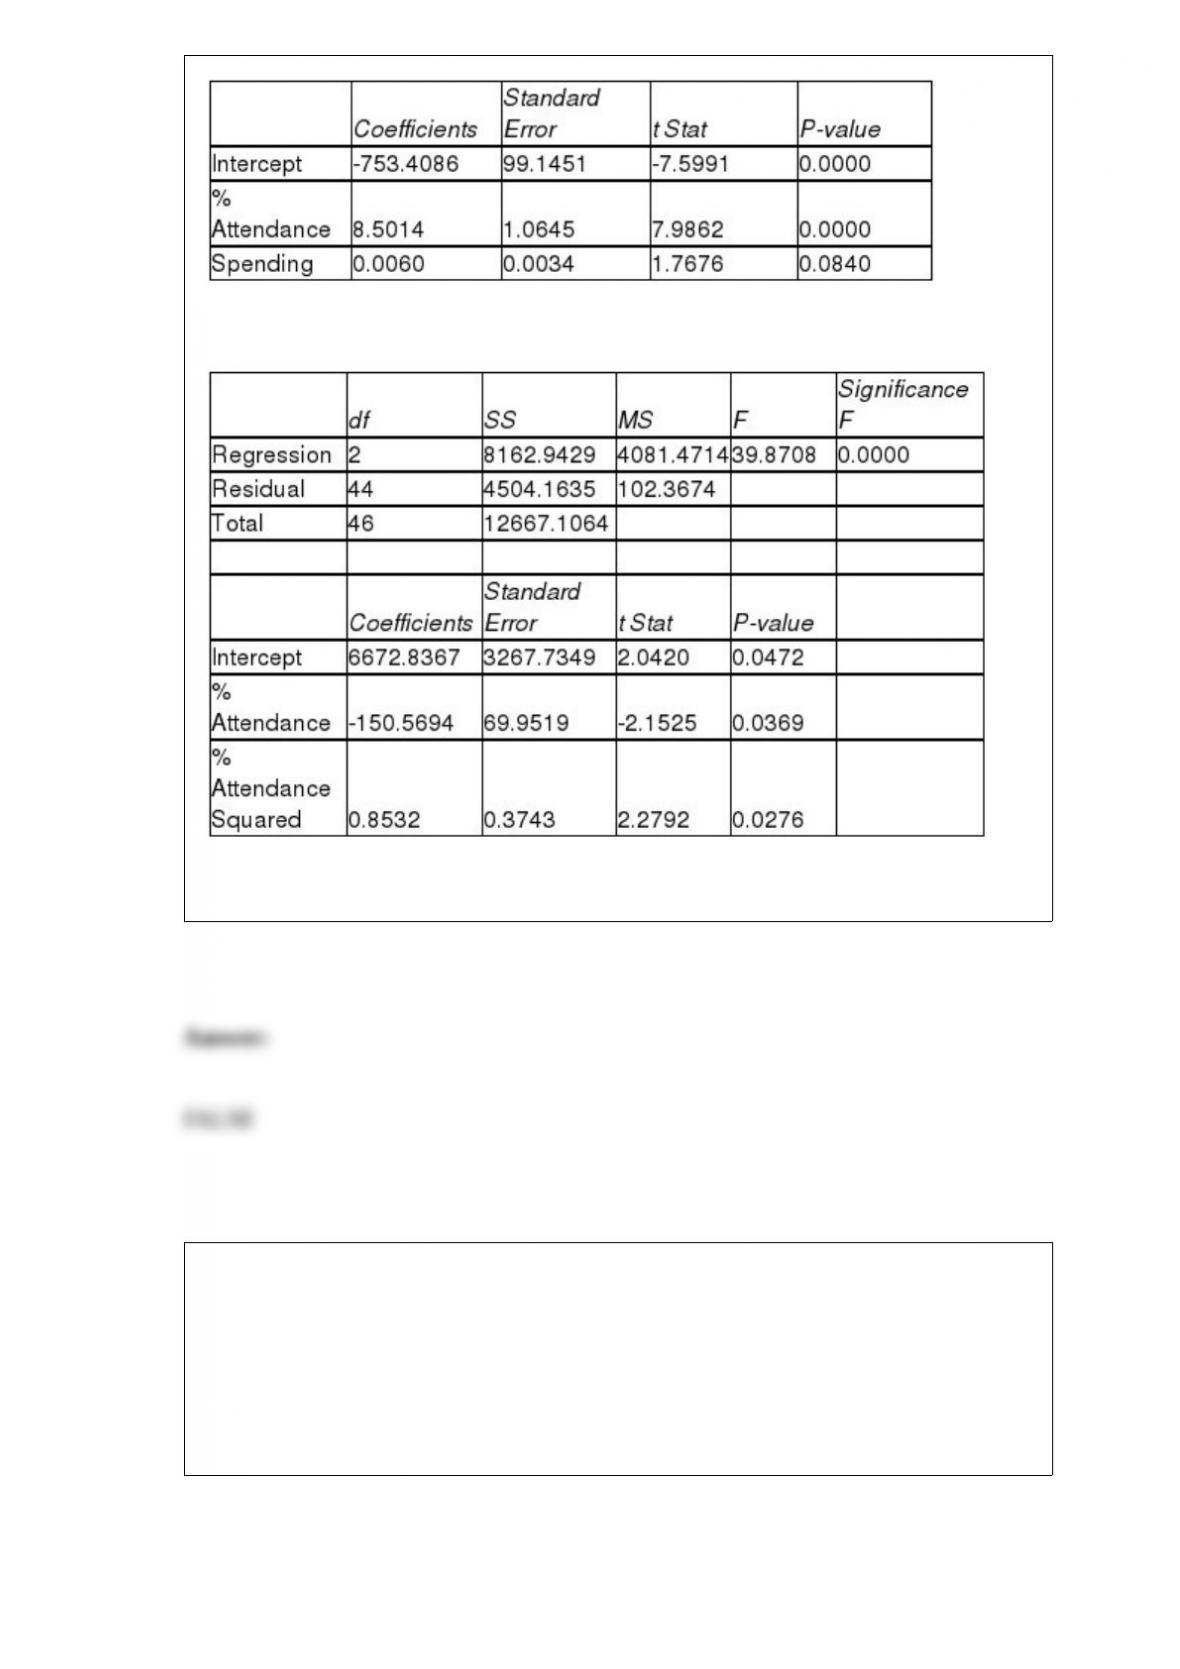
Model (III):
True or False: Referring to Table 15-4, there is reason to suspect collinearity between
some pairs of predictors.
TABLE 13-12
The manager of the purchasing department of a large saving and loan organization
would like to develop a model to predict the amount of time (measured in hours) it
takes to record a loan application. Data are collected from a sample of 30 days, and the
number of applications recorded and completion time in hours is recorded. Below is the
regression output:
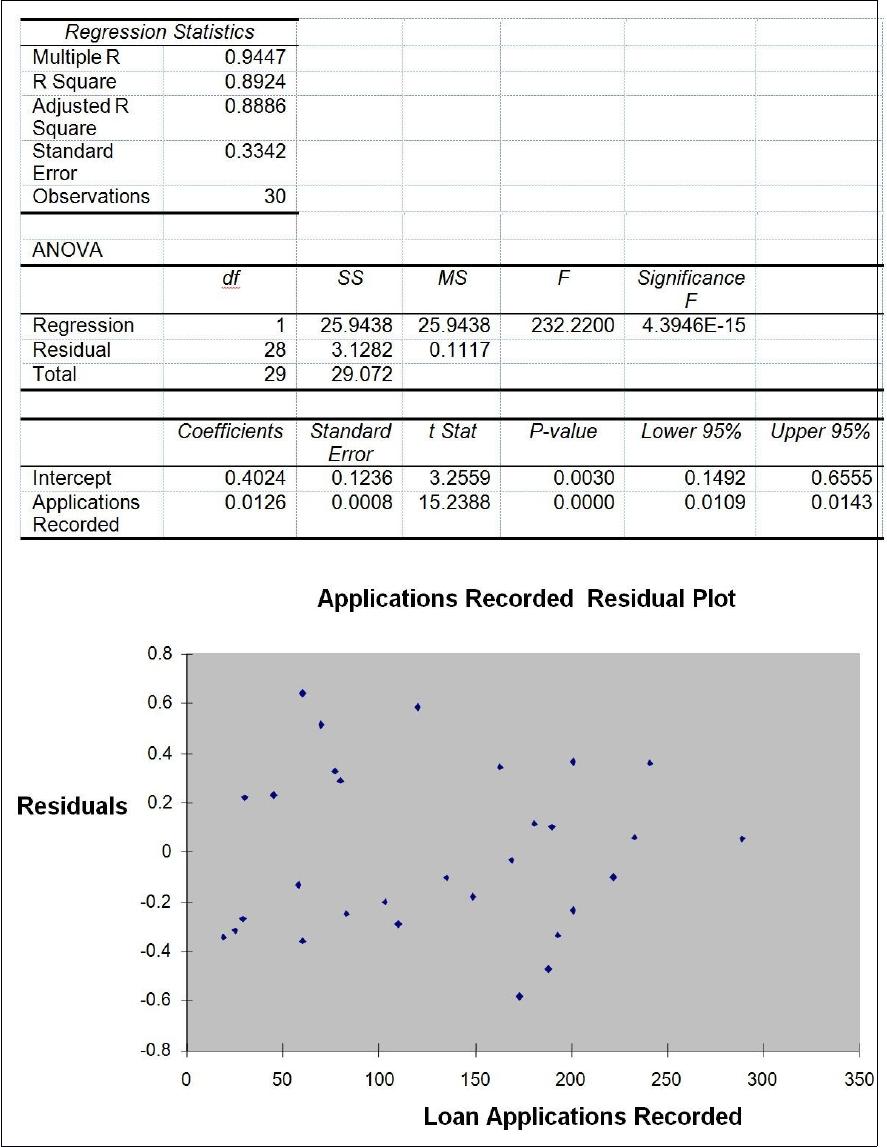
True or False: Referring to Table 13-12, there is a 95% probability that the mean
amount of time needed to record one additional loan application is somewhere between
0.0109 and 0.0143 hours.
True or False: A sample size of 5 provides a sample mean of 9.6. If the population
variance is known to be 5 and the population distribution is assumed to be normal, the
lower limit for a 90% confidence interval is 7.96.
TABLE 14-17
Given below are results from the regression analysis where the
dependent variable is the number of weeks a worker is unemployed
due to a layo! (Unemploy) and the independent variables are the age
of the worker (Age) and a dummy variable for management position
(Manager: 1 = yes, 0 = no).

The results of the regression analysis are given below:
True or False: Referring to Table 14-17, there is suffcient evidence
that the number of weeks a worker is unemployed due to a layo!
depends on all of the explanatory variables at a 10% level of
signiticance.
True or False: As the sample size increases, the standard error of the mean increases.
True or False: When you test for differences between the means of two independent
populations, you can only use a two-tail test.
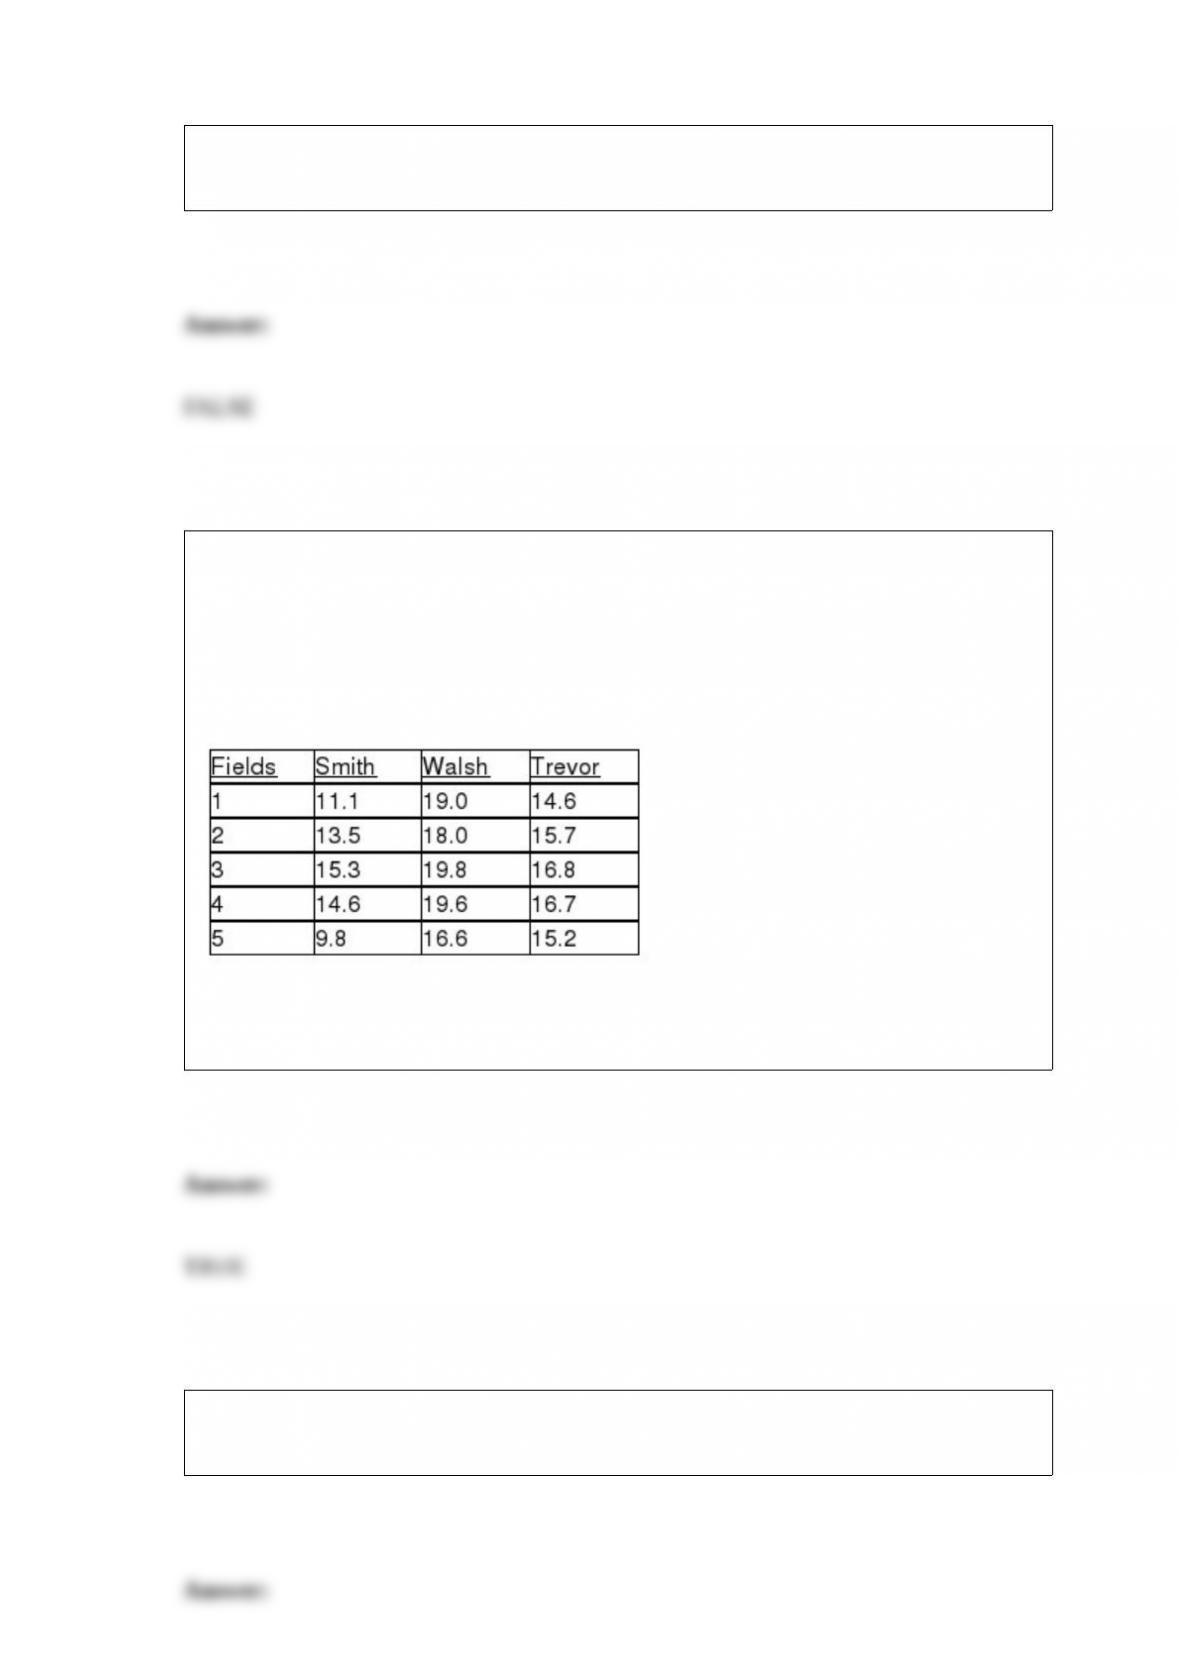
TABLE 11-10
An agronomist wants to compare the crop yield of 3 varieties of chickpea seeds. She
plants all 3 varieties of the seeds on each of 5 different patches of fields. She then
measures the crop yield in bushels per acre. Treating this as a randomized block design,
the results are presented in the table that follows.
True or False: Referring to Table 11-10, the null hypothesis for the randomized block F
test for the difference in the means should be rejected at a 0.01 level of significance.
True or False: The Durbin-Watson D statistic is used to check the assumption of
normality.
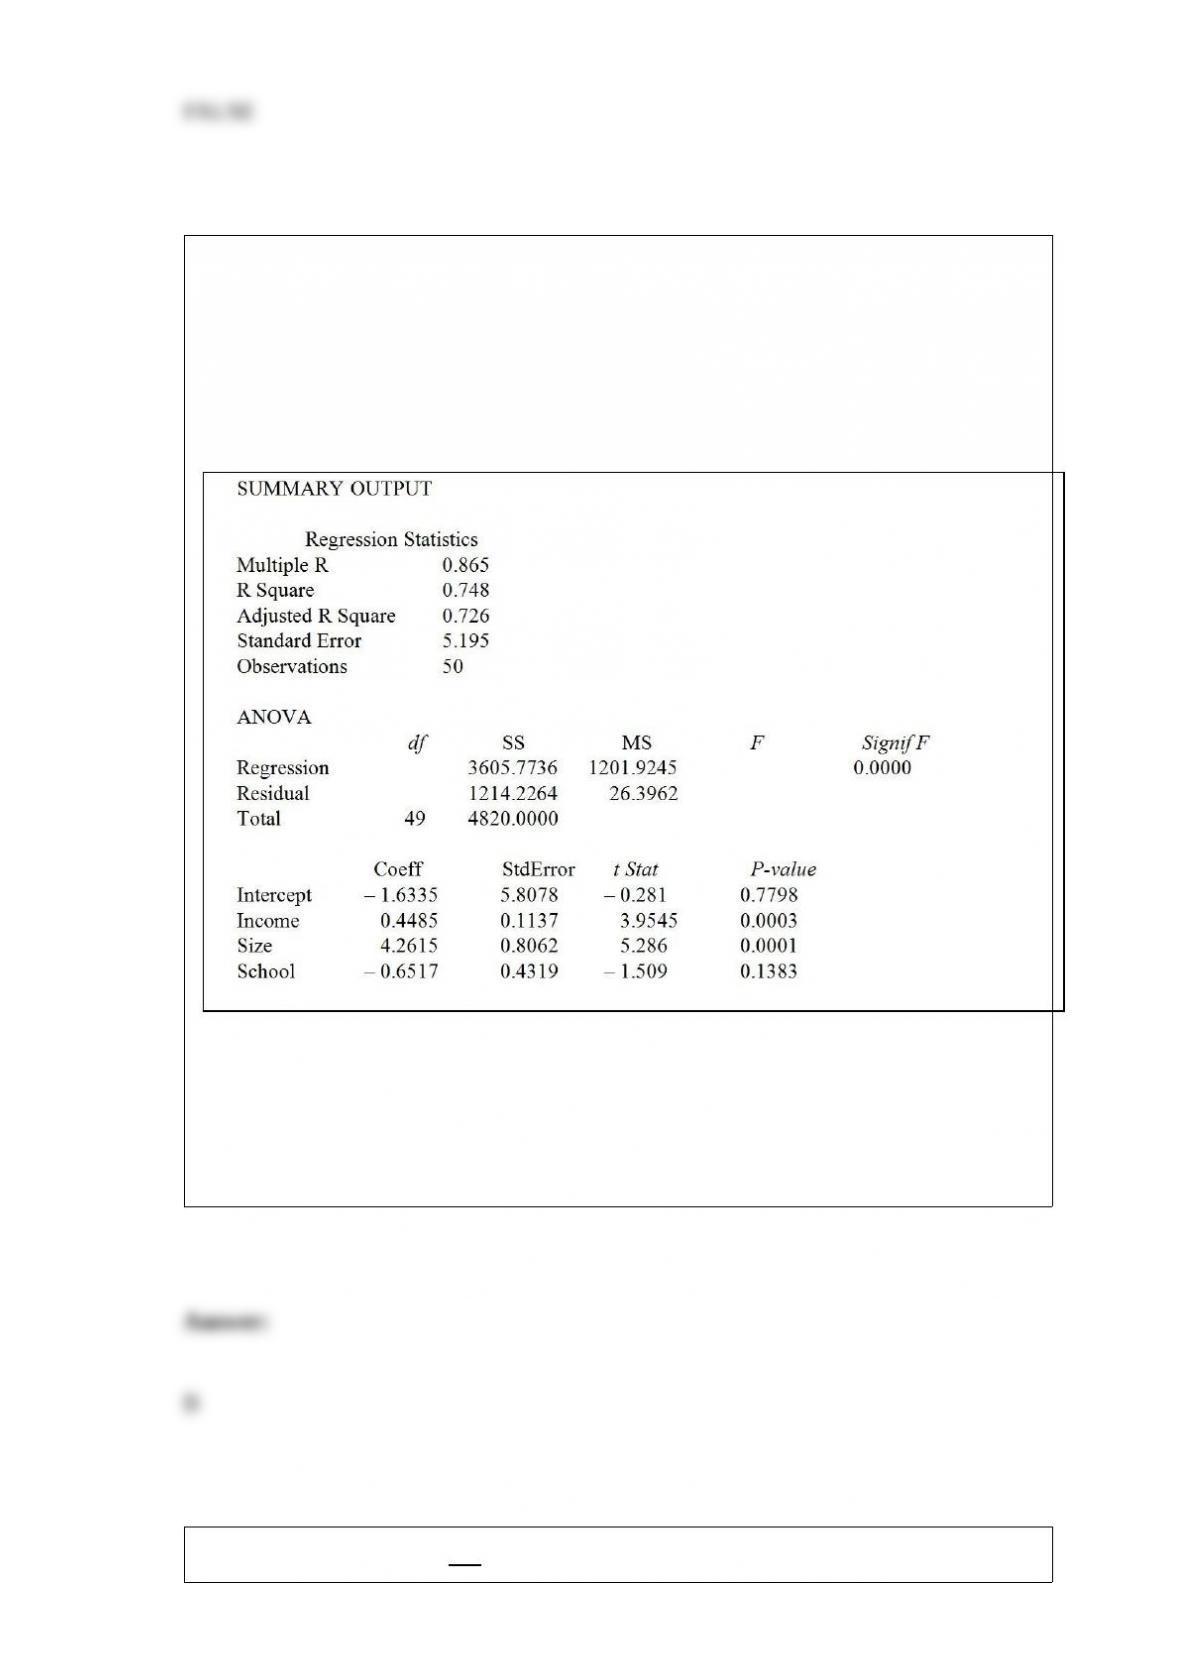
TABLE 17-1
A real estate builder wishes to determine how house size (House) is influenced by
family income (Income), family size (Size), and education of the head of household
(School). House size is measured in hundreds of square feet, income is measured in
thousands of dollars, and education is in years. The builder randomly selected 50
families and ran the multiple regression. Microsoft Excel output is provided below:
Referring to Table 17-1, what are the residual degrees of freedom that are missing from
the output?
A) 3
B) 46
C) 49
D) 50
Which of the following is not a measure of central tendency?
A) the arithmetic mean
B) the geometric mean
C) the mode
D) the interquartile range
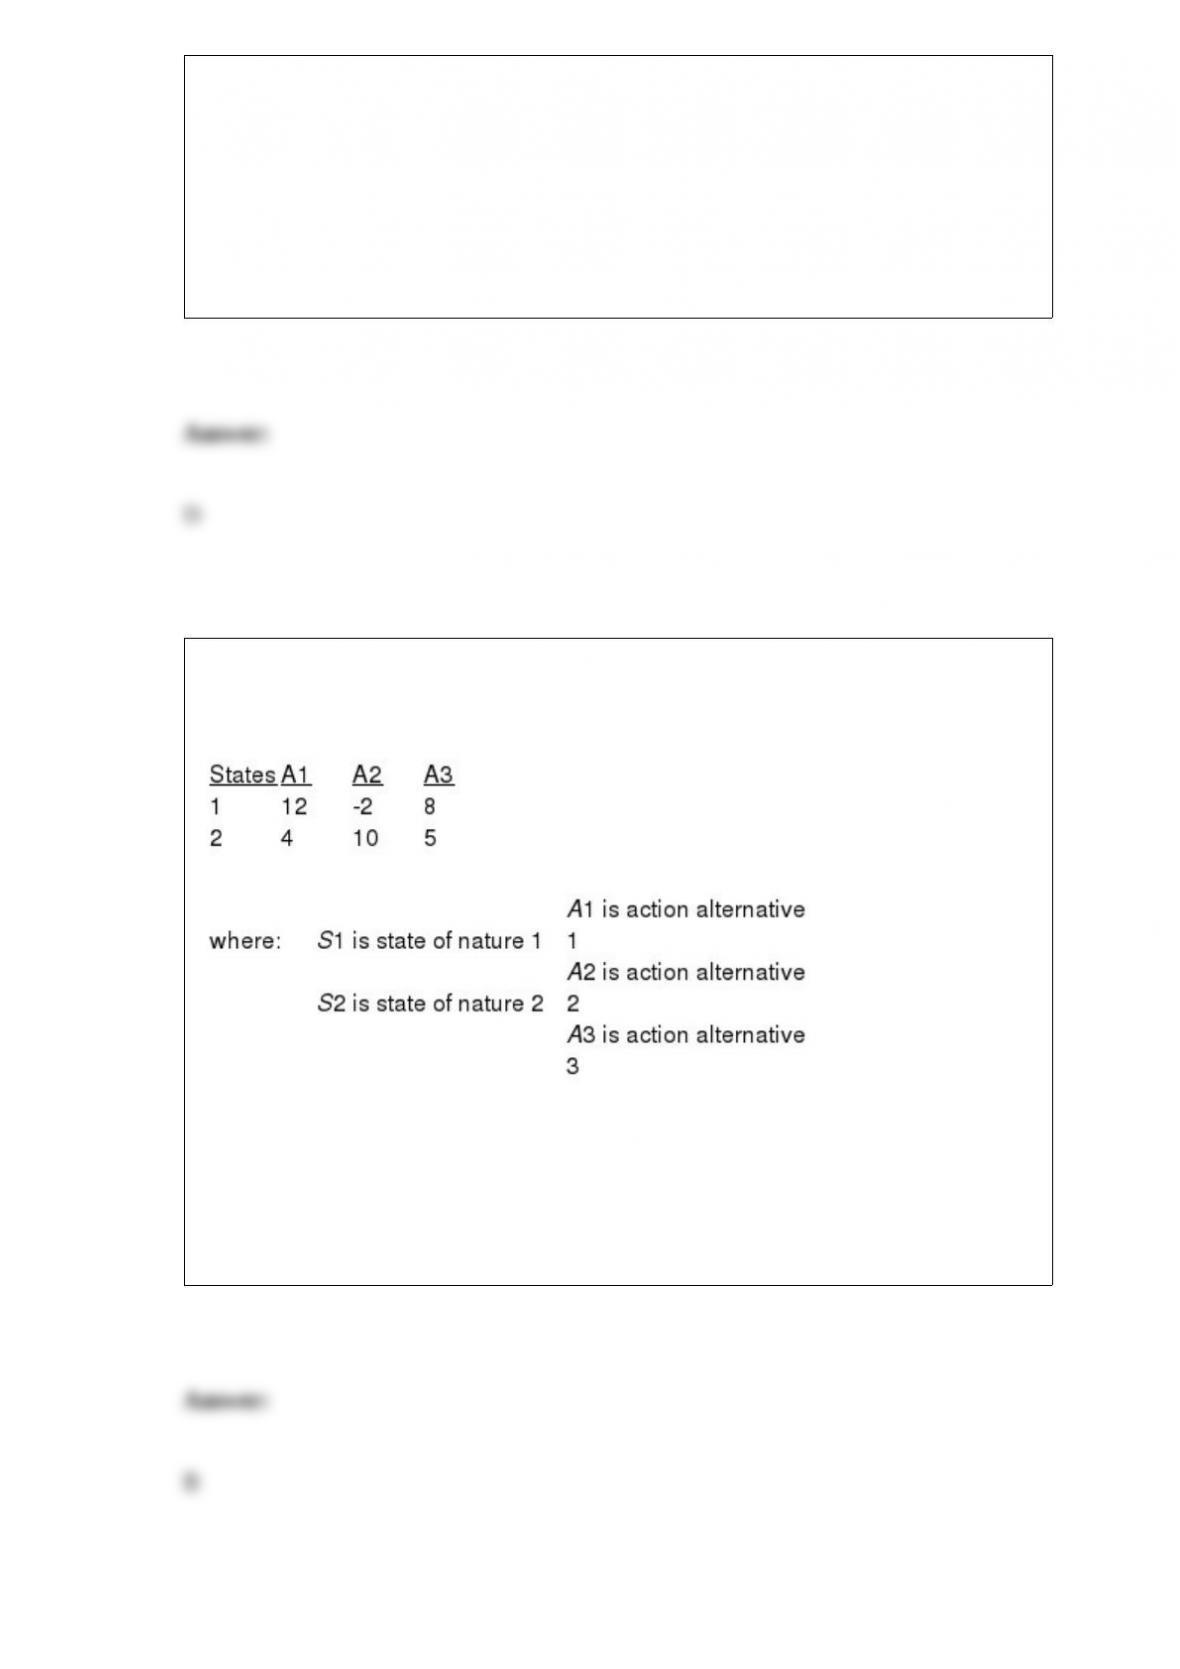
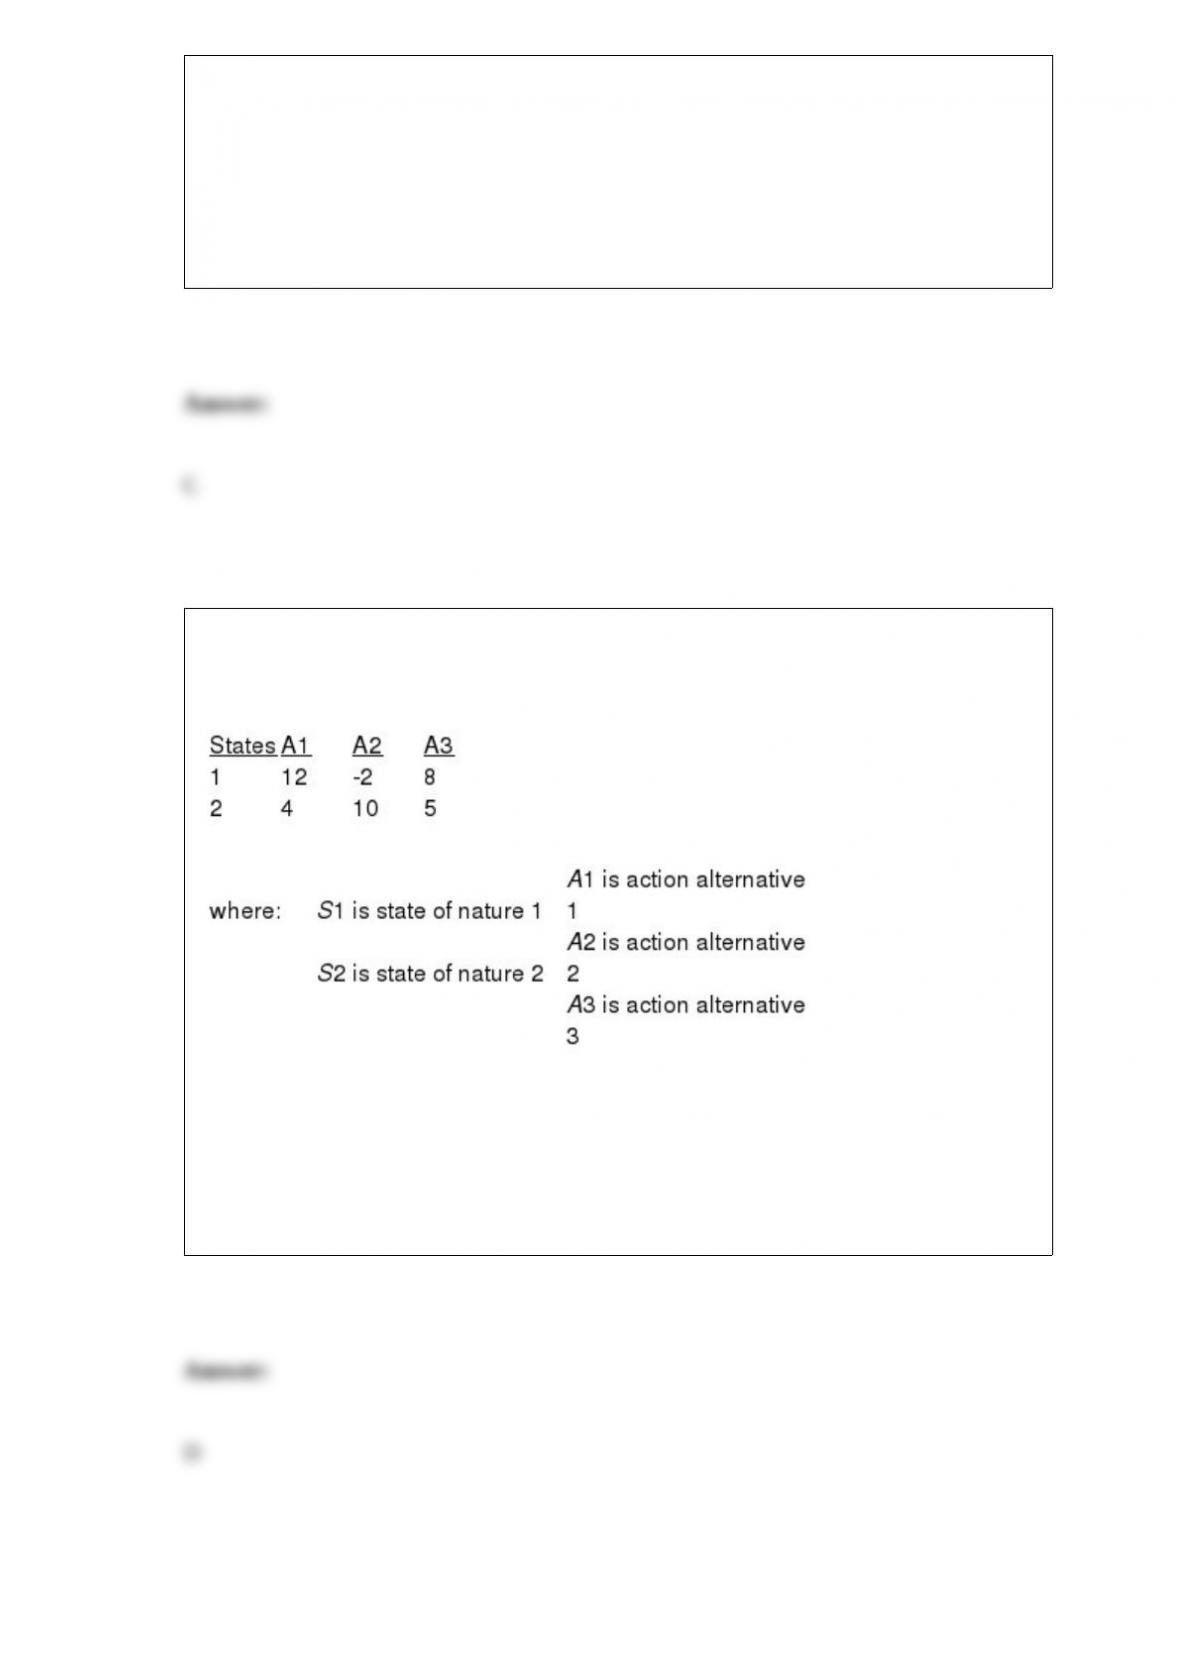
TABLE 19-1
The following payoff table shows profits associated with a set of 3 alternatives under 2
possible states of nature
Referring to Table 19-1, if the probability of S1 is 0.5, then the expected monetary value
(EMV) for A2 is
A) 3.
B) 4.
C) 6.5.
D) 8.
Data on the amount of money made in a year by 1,000 families in a small town were
collected. You want to know if the money made is normally distributed. Which of the
following would you use?
A) Bar chart
B) Scatter plot
C) Boxplot
D) Time-series plot
TABLE 19-1
The following payoff table shows profits associated with a set of 3 alternatives under 2
possible states of nature
Referring to Table 19-1, if the probability of S1 is 0.5, then the expected profit under
certainty (EPUC ) is
A) 3.
B) 5.
C) 8.
D) 11.
Which of the following is not an advantage of exponential smoothing?
A) It enables you to perform one-period ahead forecasting.
B) It enables you to perform more than one-period ahead forecasting.
C) It enables you to smooth out seasonal components.
D) It enables you to smooth out cyclical components.
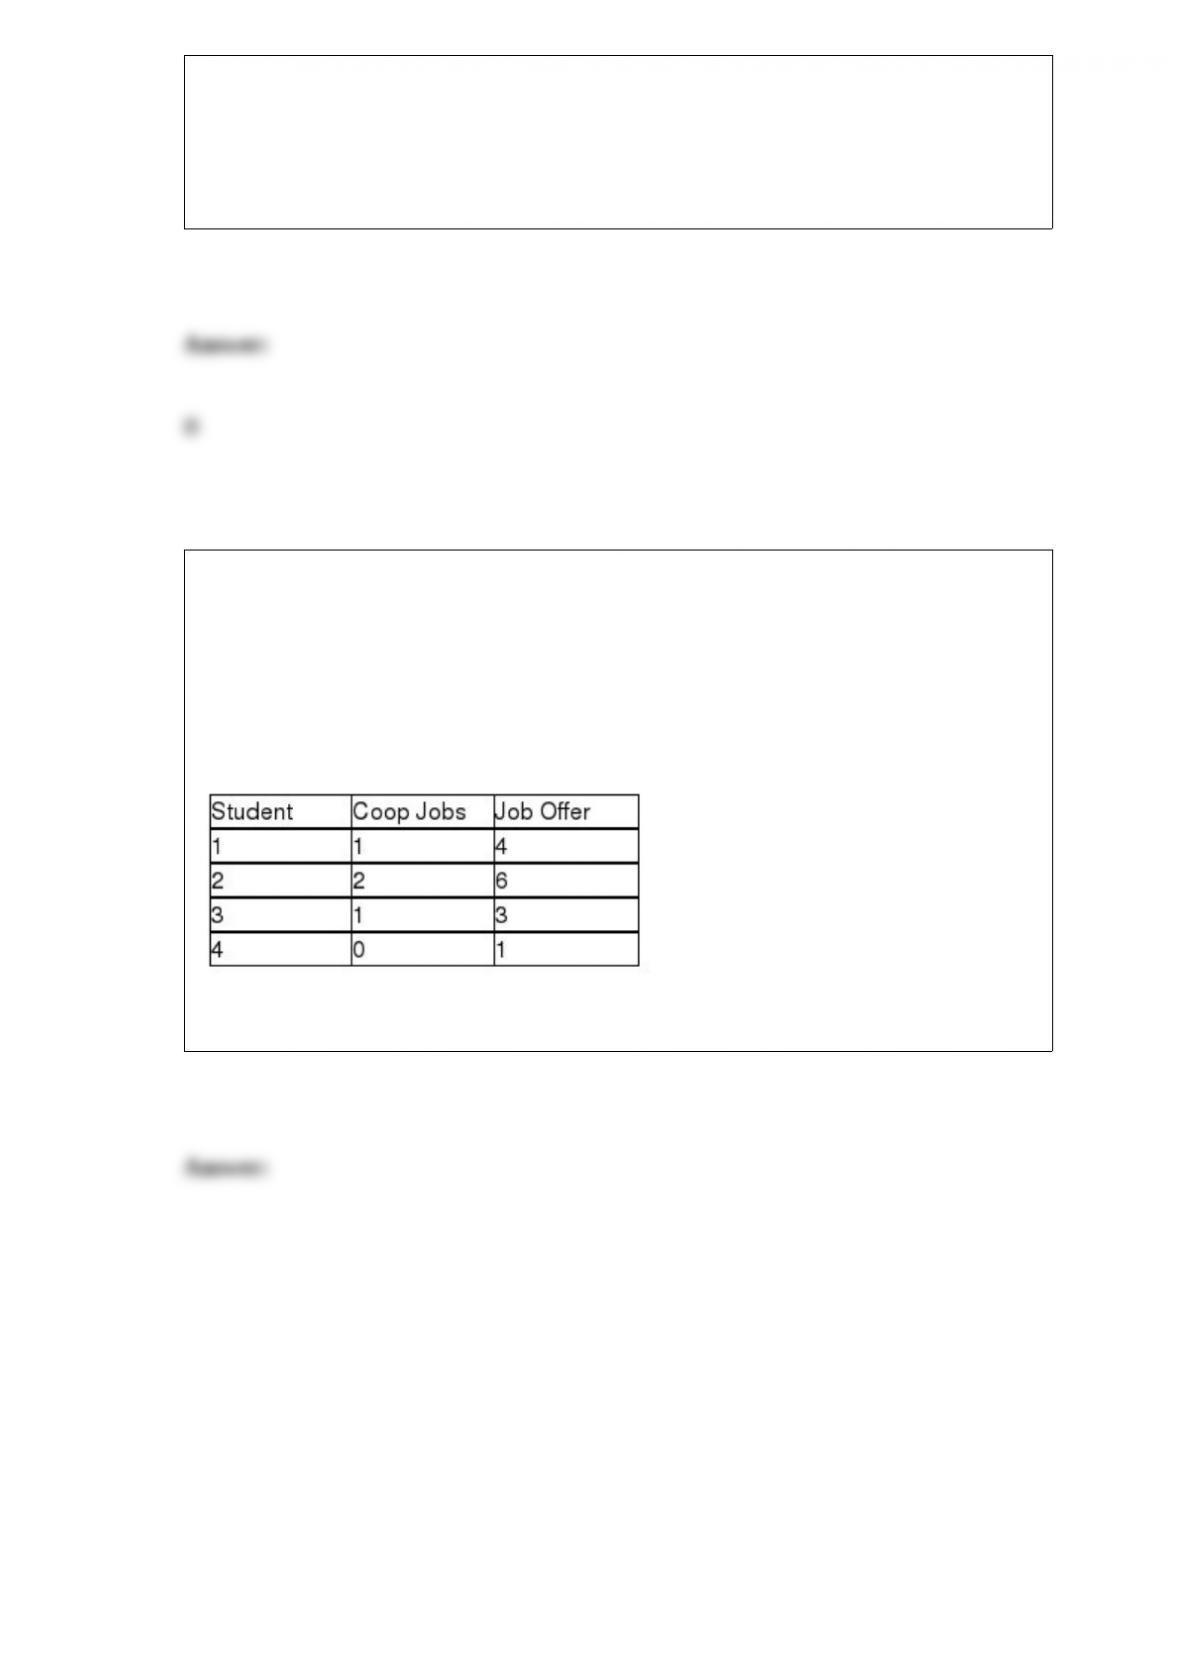
TABLE 13-3
The director of cooperative education at a state college wants to examine the effect of
cooperative education job experience on marketability in the work place. She takes a
random sample of 4 students. For these 4, she finds out how many times each had a
cooperative education job and how many job offers they received upon graduation.
These data are presented in the table below.
Referring to Table 13-3, set up a scatter plot.
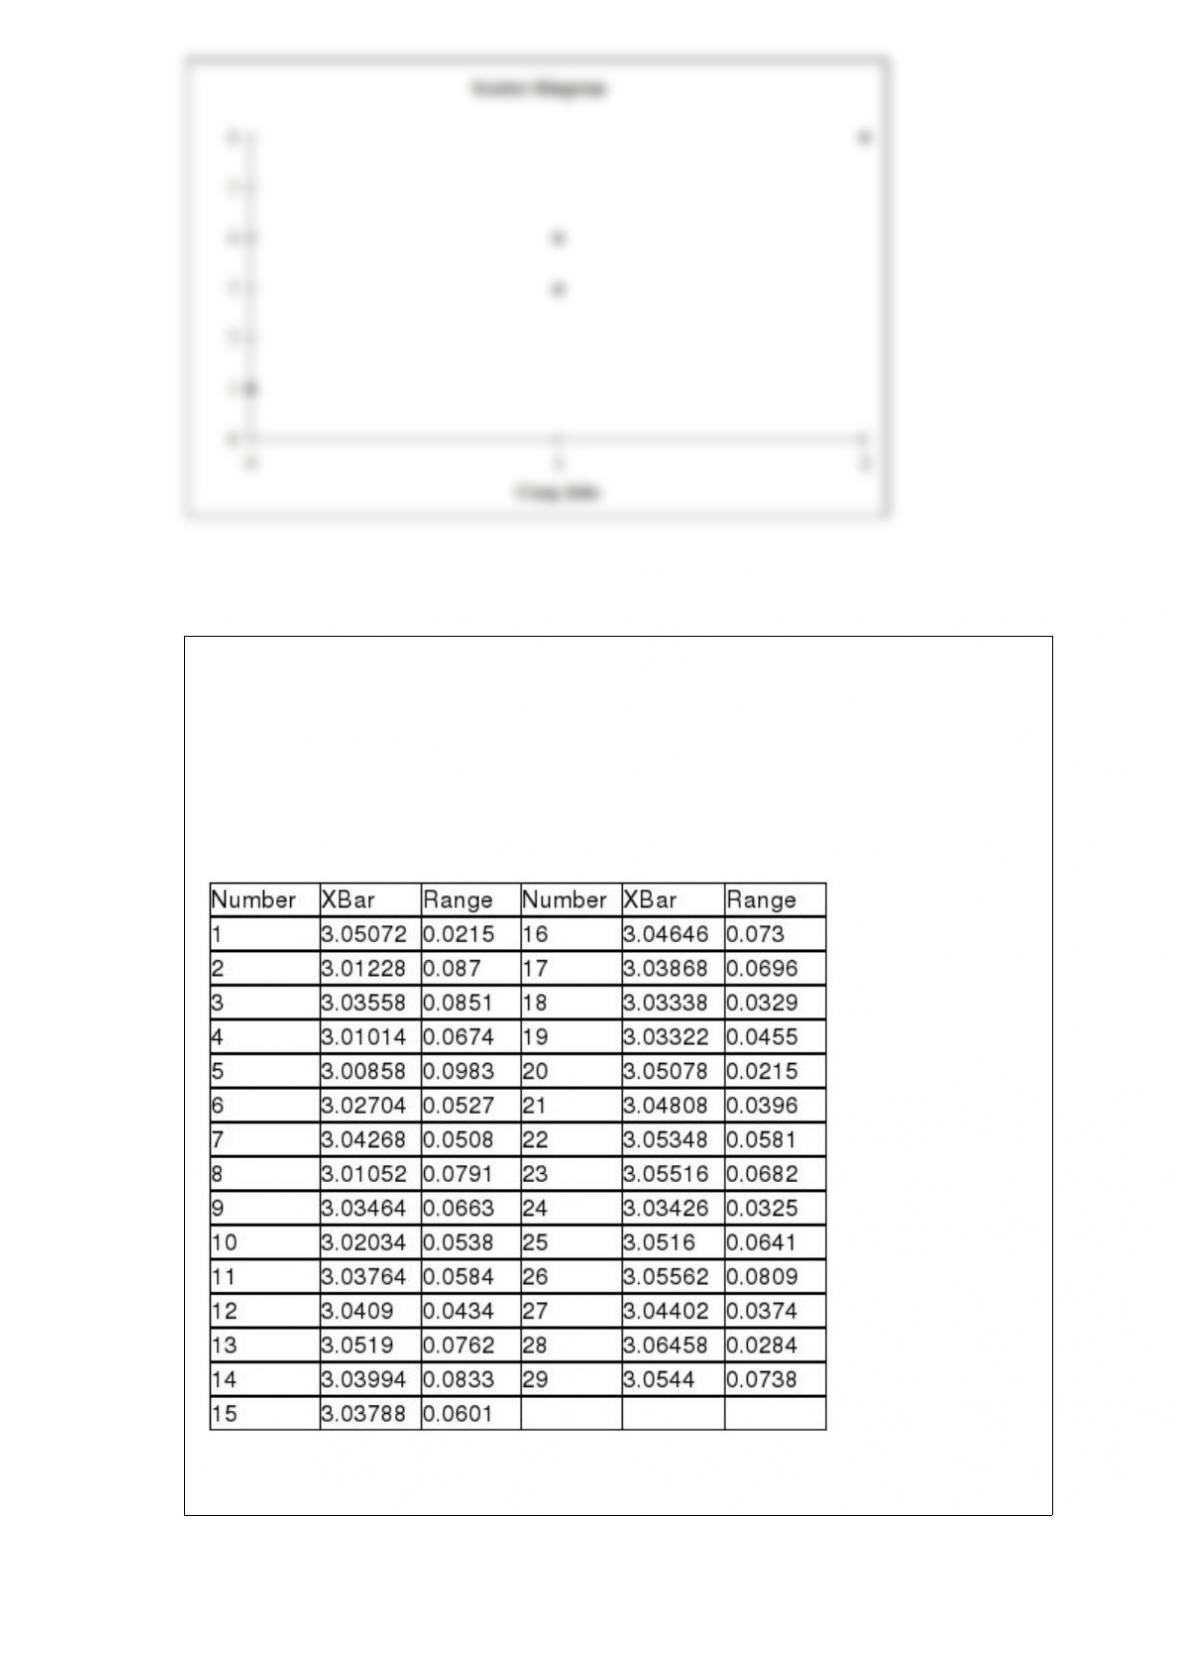
TABLE 18-9
The manufacturer of canned food constructed control charts and analyzed several
quality characteristics. One characteristic of interest is the weight of the filled cans. The
lower specification limit for weight is 2.95 pounds. The table below provides the range
and mean of the weights of five cans tested every fifteen minutes during a day’s
production.
Referring to Table 18-9, an R chart is to be constructed for the weight. The lower
control limit for this data set is ________.

TABLE 6-3
Suppose the time interval between two consecutive defective light bulbs from a
production line has a uniform distribution over an interval from 0 to 90 minutes.
Referring to Table 6-3, what is the probability that the time interval between two
consecutive defective light bulbs will be exactly 10 minutes?
It is essential that each class grouping or interval in a frequency distribution be
________ and ________.
TABLE 9-11
An appliance manufacturer claims to have developed a compact microwave oven that
consumes a population mean of no more than 250 W. From previous studies, it is
believed that power consumption for microwave ovens is normally distributed with a
population standard deviation of 15 W. If there is evidence that the population mean
consumption is greater than 250 W, the manufacturer will be unable to make the claim.
Referring to Table 9-11, if you select a sample of 20 compact microwave ovens and are
willing to have a level of significance of 0.10, the probability of making a Type II error
is ________ if the mean power consumption of all such microwave ovens is in fact
257.3 W.
TABLE 3-3
The ordered array below represents the number of vitamin supplements sold by a health
food store in a sample of 16 days.
19, 19, 20, 20, 22, 23, 25, 26, 27, 30, 33, 34, 35, 36, 38, 41
Note: For this sample, the sum of the values is 448, and the sum of the squared
differences between each value and the mean is 812.
Referring to Table 3-3, the standard deviation of the number of vitamin supplements
sold in this sample is ________.
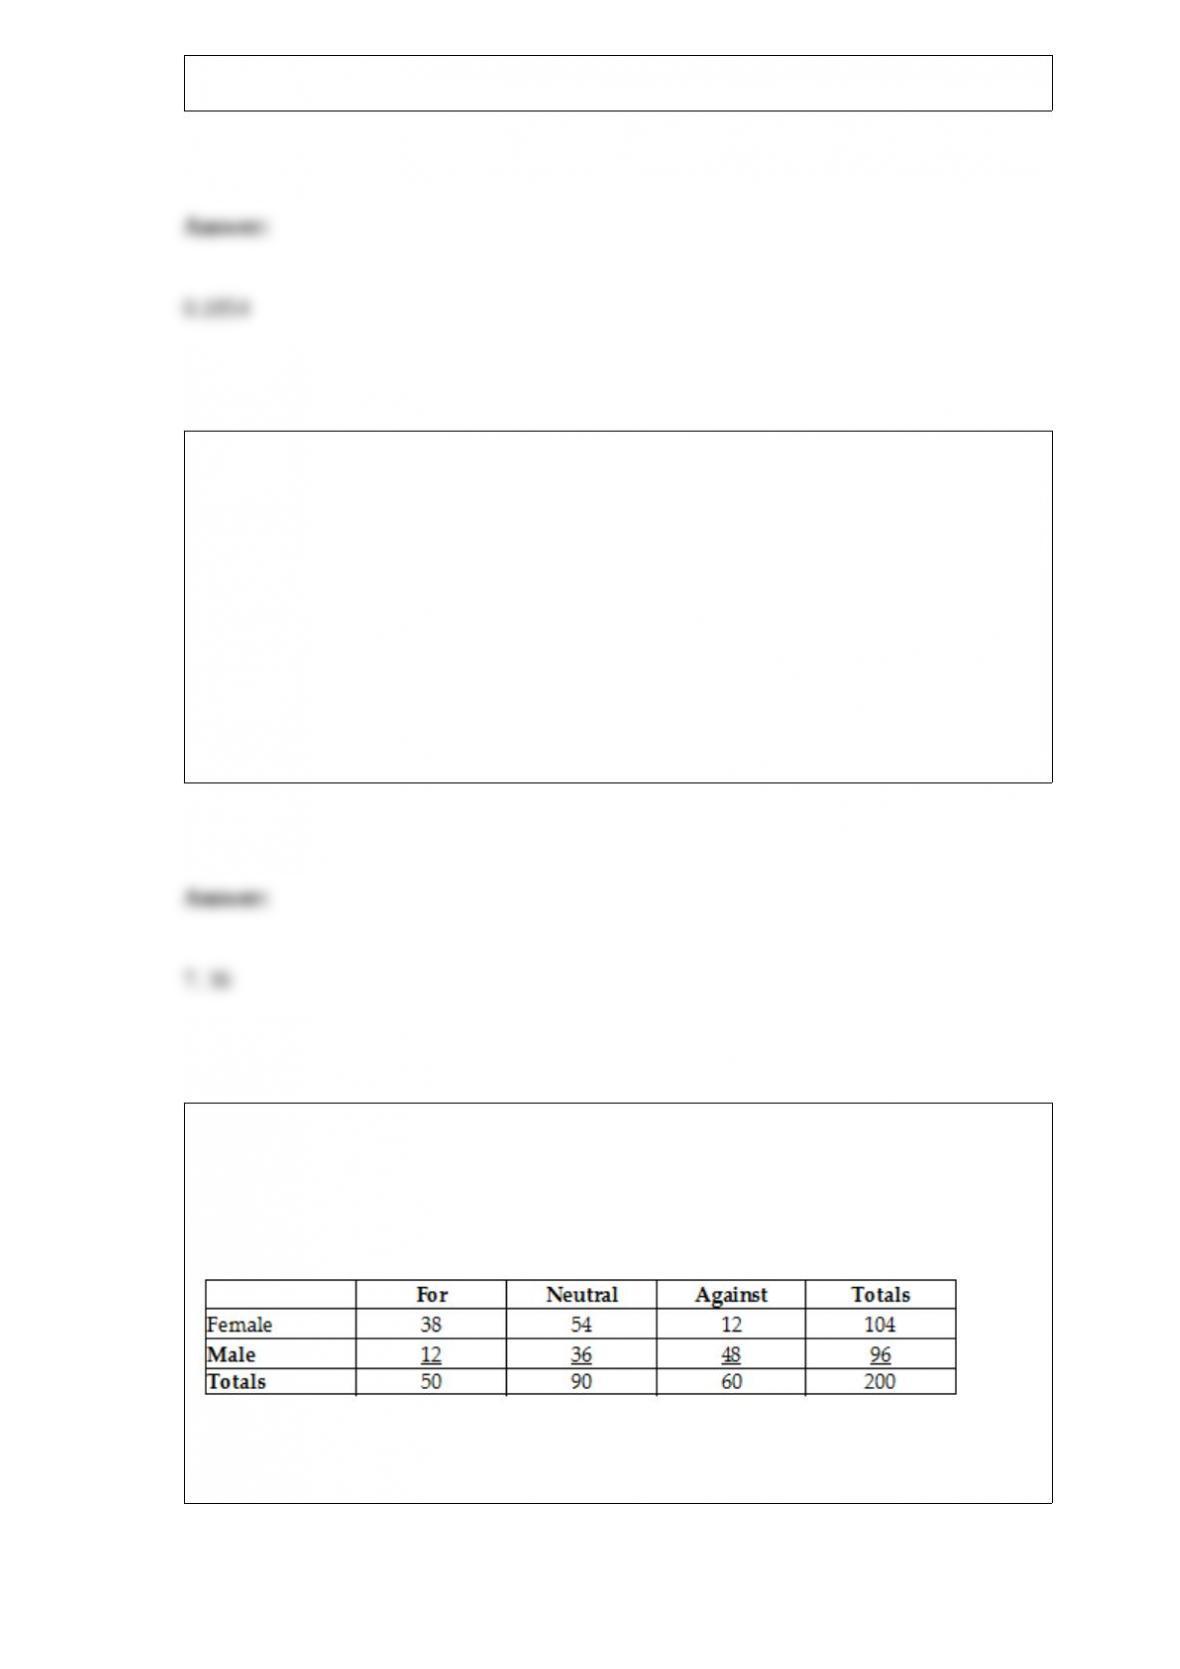
TABLE 2-12
The table below contains the opinions of a sample of 200 people broken down by
gender about the latest congressional plan to eliminate anti-trust exemptions for
professional baseball.
Referring to Table 2-12, of the females in the sample, ________ percent were either
neutral or against the plan.