True or False: The Laspeyres price index has the disadvantage that the consumption
pattern in the initial period might be quite different from that in the current period and,
hence, does not reflect accurately the current consumption cost.
True or False: TABLE 17-12
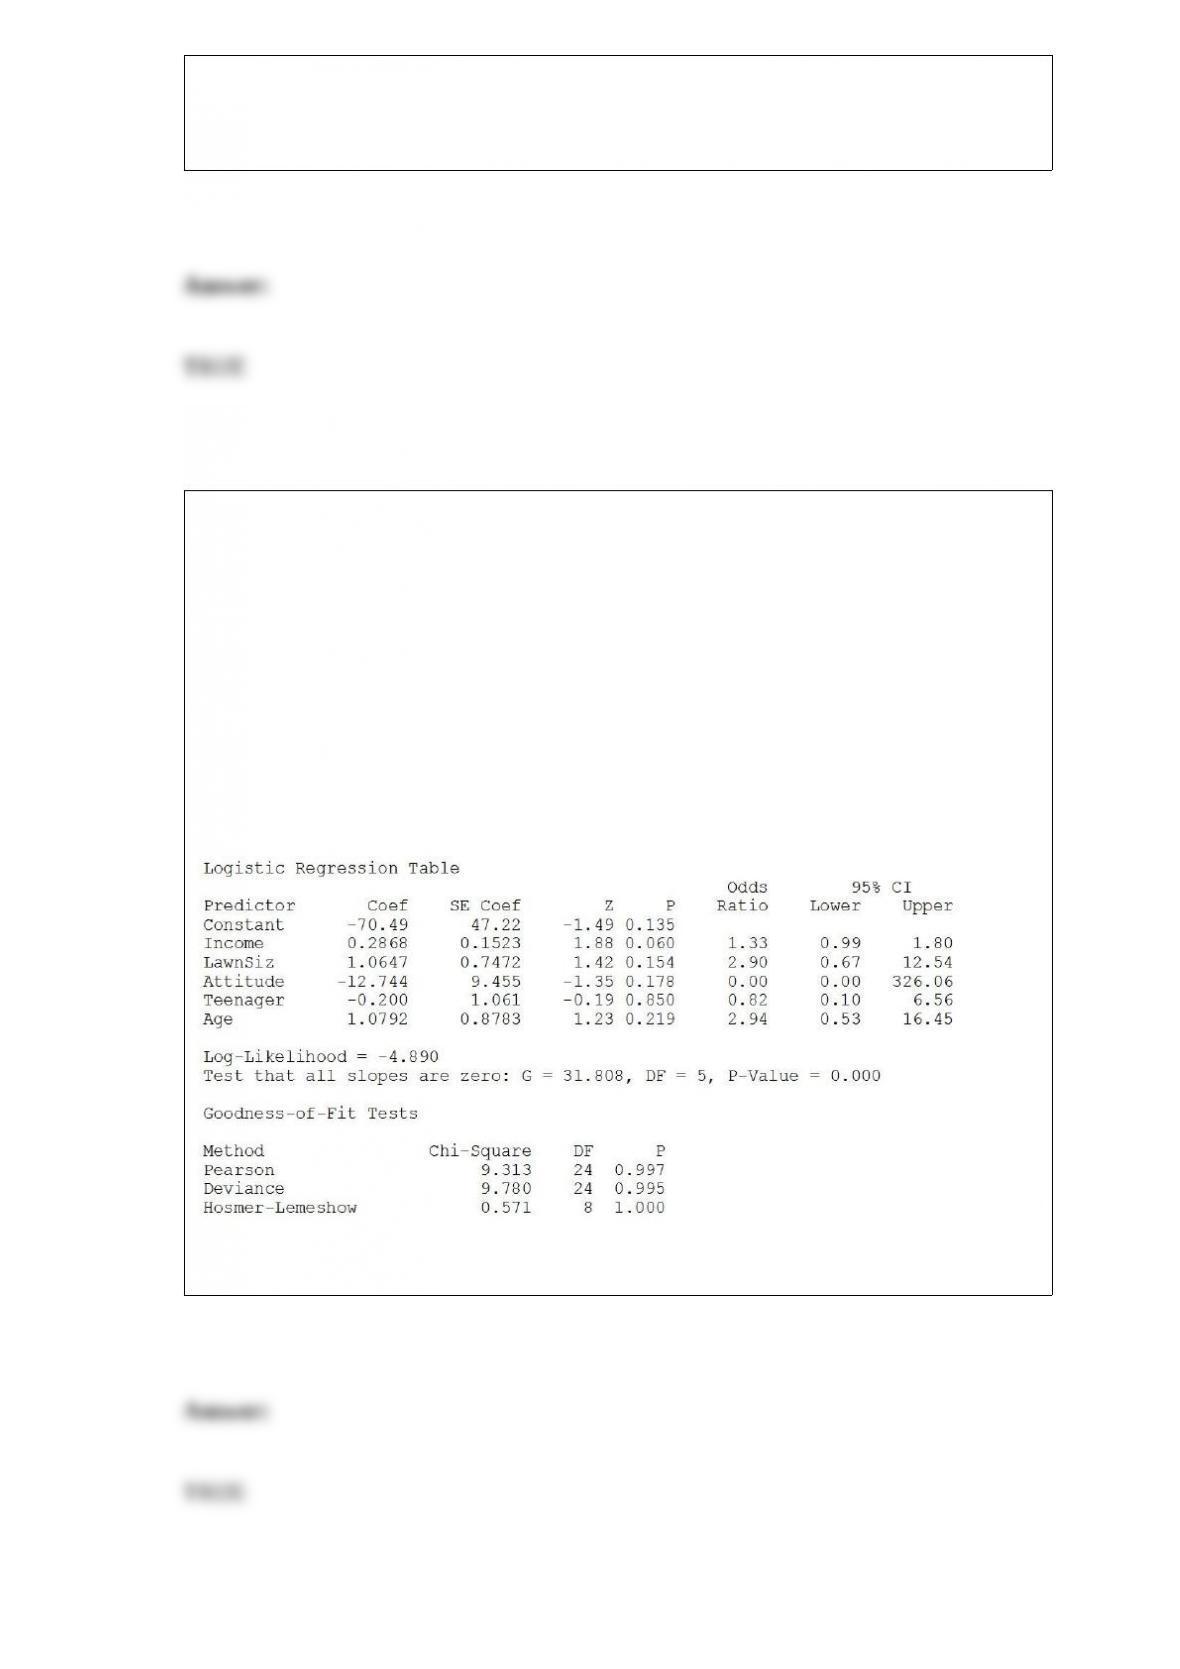
The marketing manager for a nationally franchised lawn service company would like to
study the characteristics that differentiate home owners who do and do not have a lawn
service. A random sample of 30 home owners located in a suburban area near a large
city was selected; 15 did not have a lawn service (code 0) and 15 had a lawn service
(code 1). Additional information available concerning these 30 home owners includes
family income (Income, in thousands of dollars), lawn size (Lawn Size, in thousands of
square feet), attitude toward outdoor recreational activities (Attitude 0 = unfavorable, 1
= favorable), number of teenagers in the household (Teenager), and age of the head of
the household (Age).
The Minitab output is given below:
Referring to Table 17-12, there is not enough evidence to conclude that the model is not
a good-fitting model at a 0.05 level of significance.
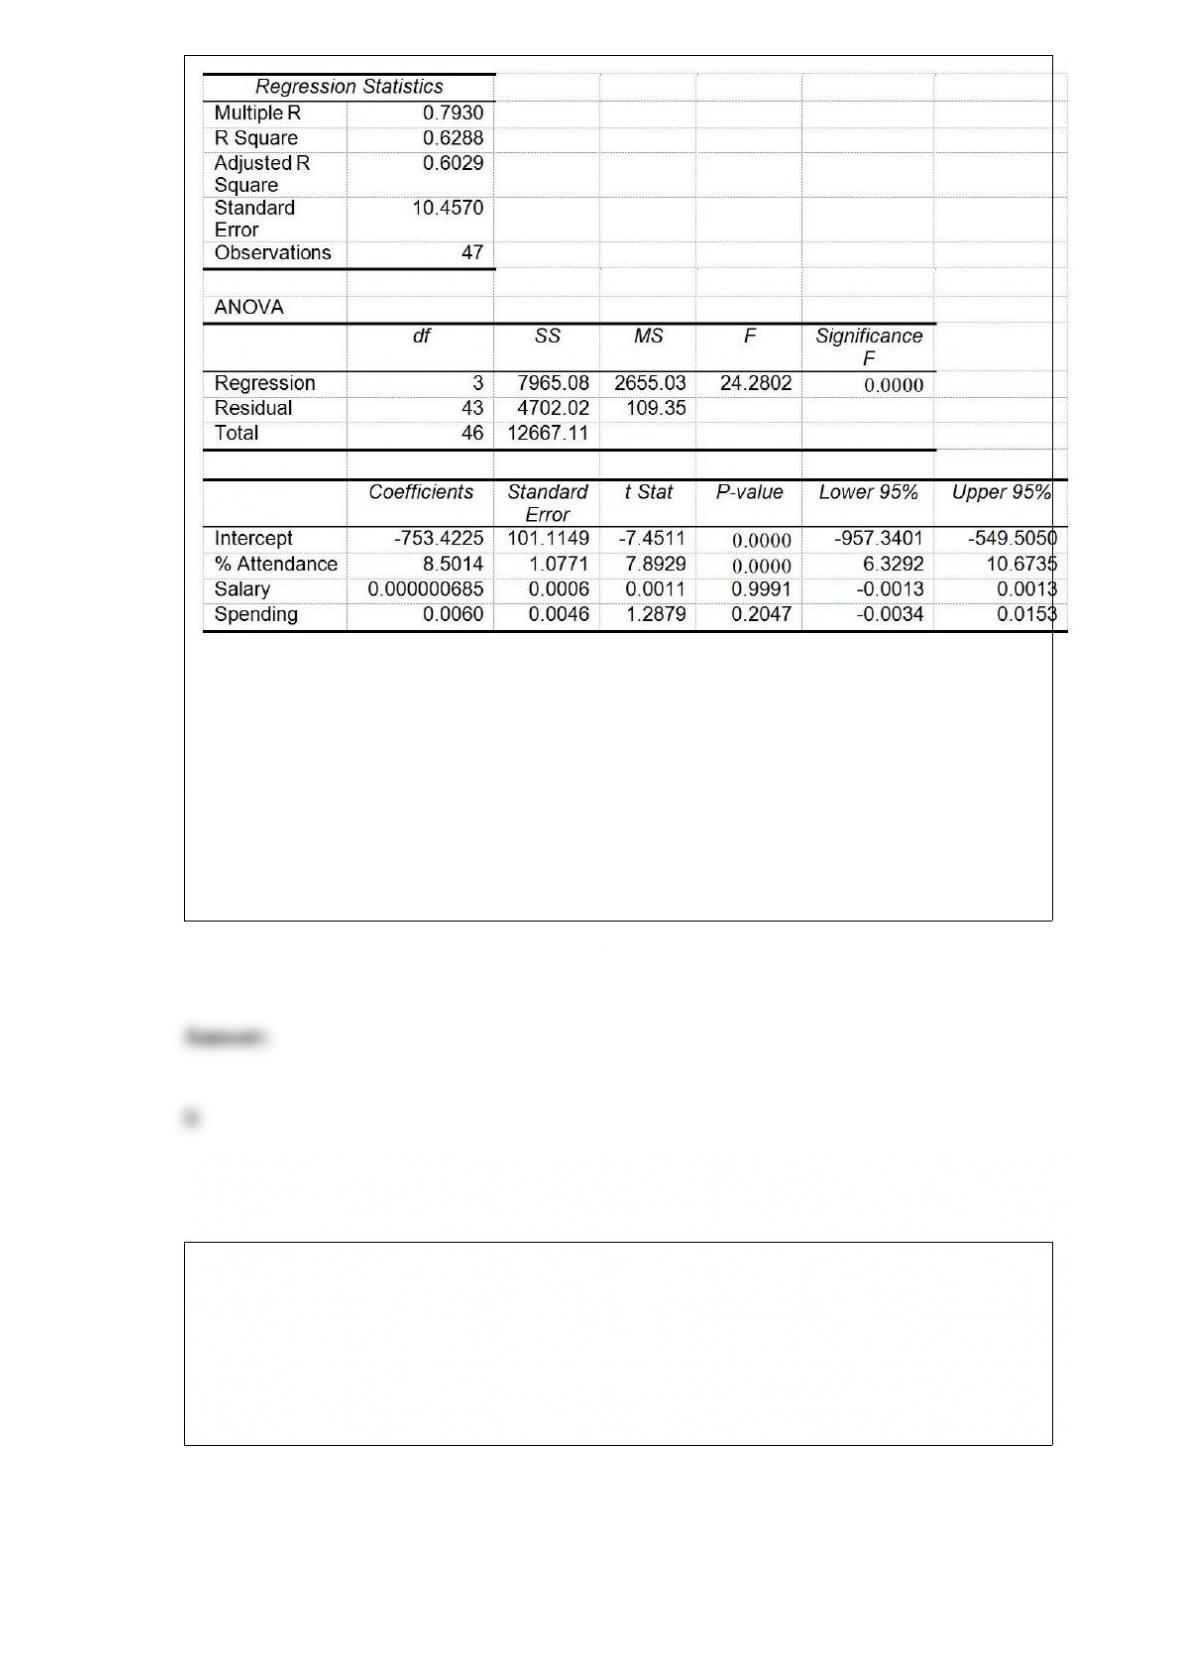
True or False: TABLE 17-8
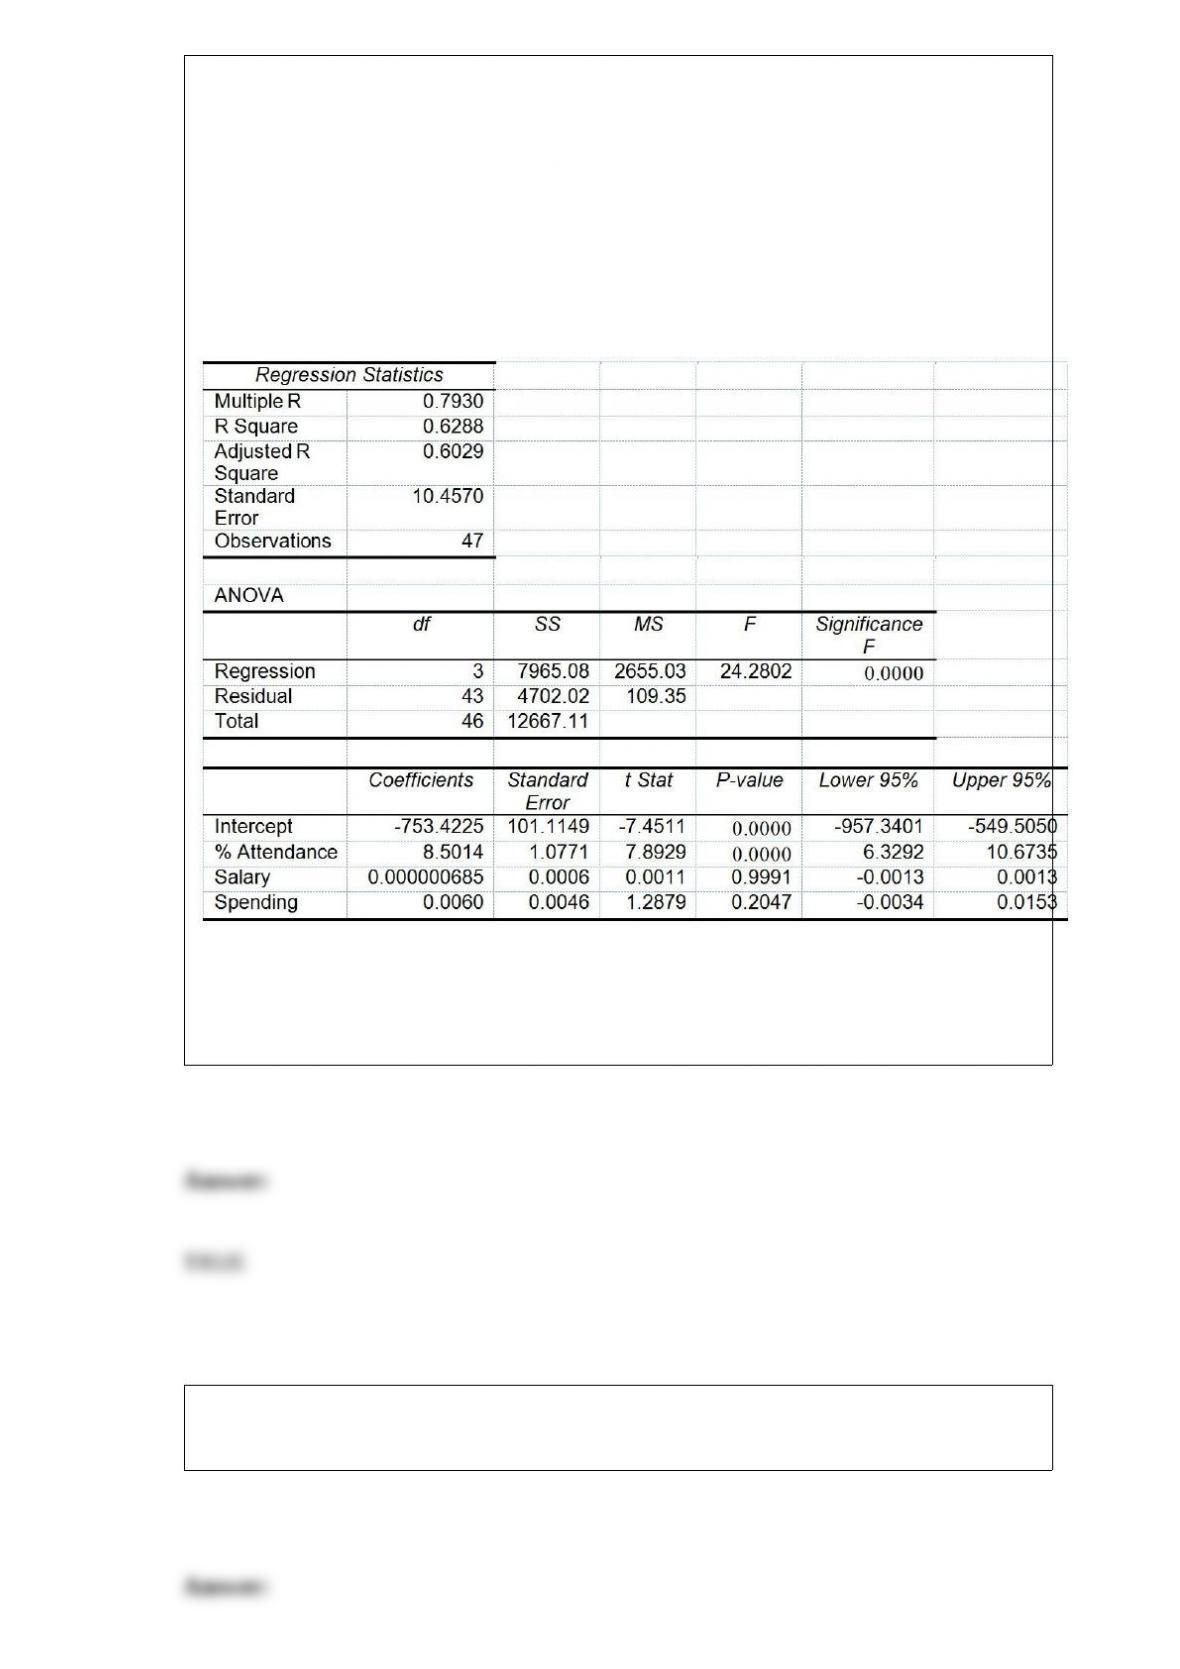
The superintendent of a school district wanted to predict the percentage of students
passing a sixth-grade proficiency test. She obtained the data on percentage of students
passing the proficiency test (% Passing), daily mean of the percentage of students
attending class (% Attendance), mean teacher salary in dollars (Salaries), and
instructional spending per pupil in dollars (Spending) of 47 schools in the state.
Following is the multiple regression output with Y = % Passing as the dependent
variable, X1 = % Attendance, X2 = Salaries and X3 = Spending:
Referring to Table 17-8, you can conclude that instructional spending per pupil has no
impact on the mean percentage of students passing the proficiency test, taking into
account the effect of all the other independent variables, at a 5% level of significance
using the 95% confidence interval estimate for β3.
True or False: A proper methodology in performing hypothesis tests is to ask whether a
random sample can be selected from the population of interest.
True or False: From the coefficient of multiple determination, you cannot detect the
strength of the relationship between Y and any individual independent variable.
TABLE 11-8
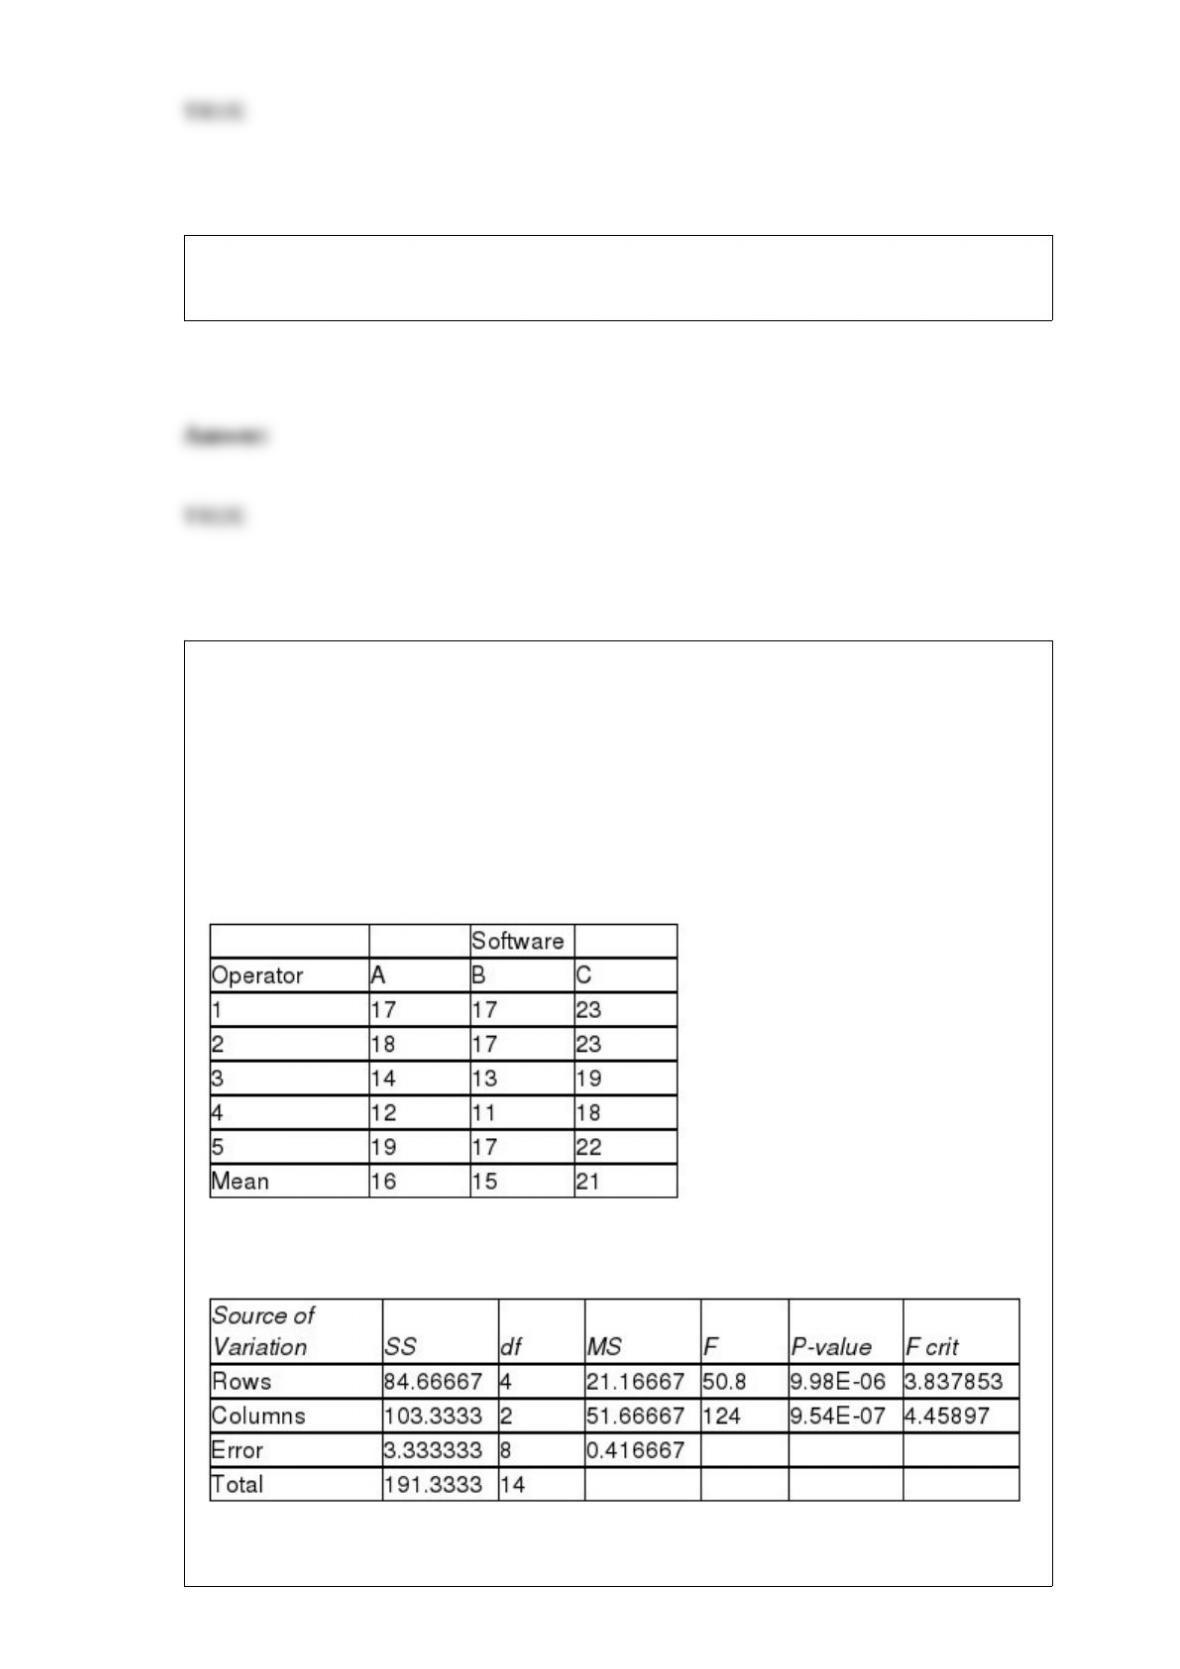
An important factor in selecting database software is the time required for a user to
learn how to use the system. To evaluate three potential brands (A, B and C) of database
software, a company designed a test involving five different employees. To reduce
variability due to differences among employees, each of the five employees is trained
on each of the three different brands. The amount of time (in hours) needed to learn
each of the three different brands is given below:
Below is the Excel output for the randomized block design:
True or False: Referring to Table 11-8, the randomized block F test is valid only if the
population of the amount of time needed is normally distributed for the 3 brands.
TABLE 16-13
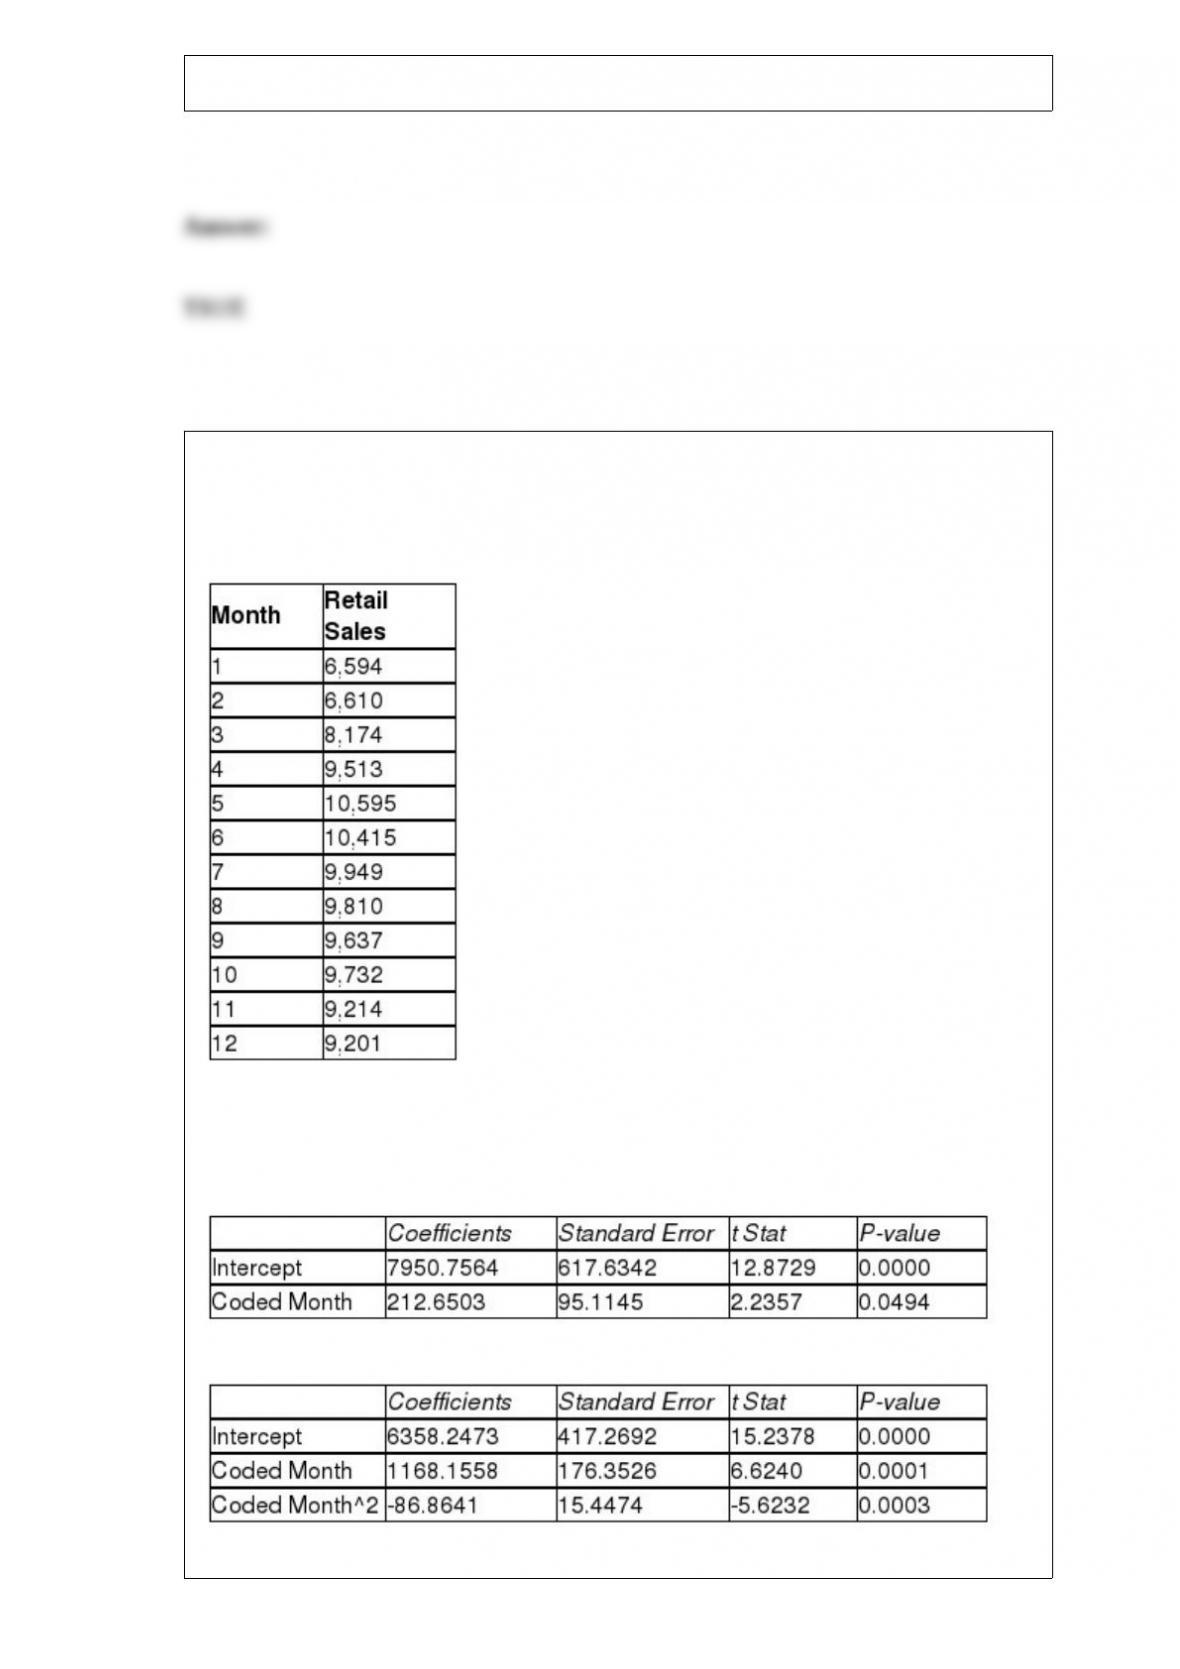
Given below is the monthly time-series data for U.S. retail sales of building materials
over a specific year.
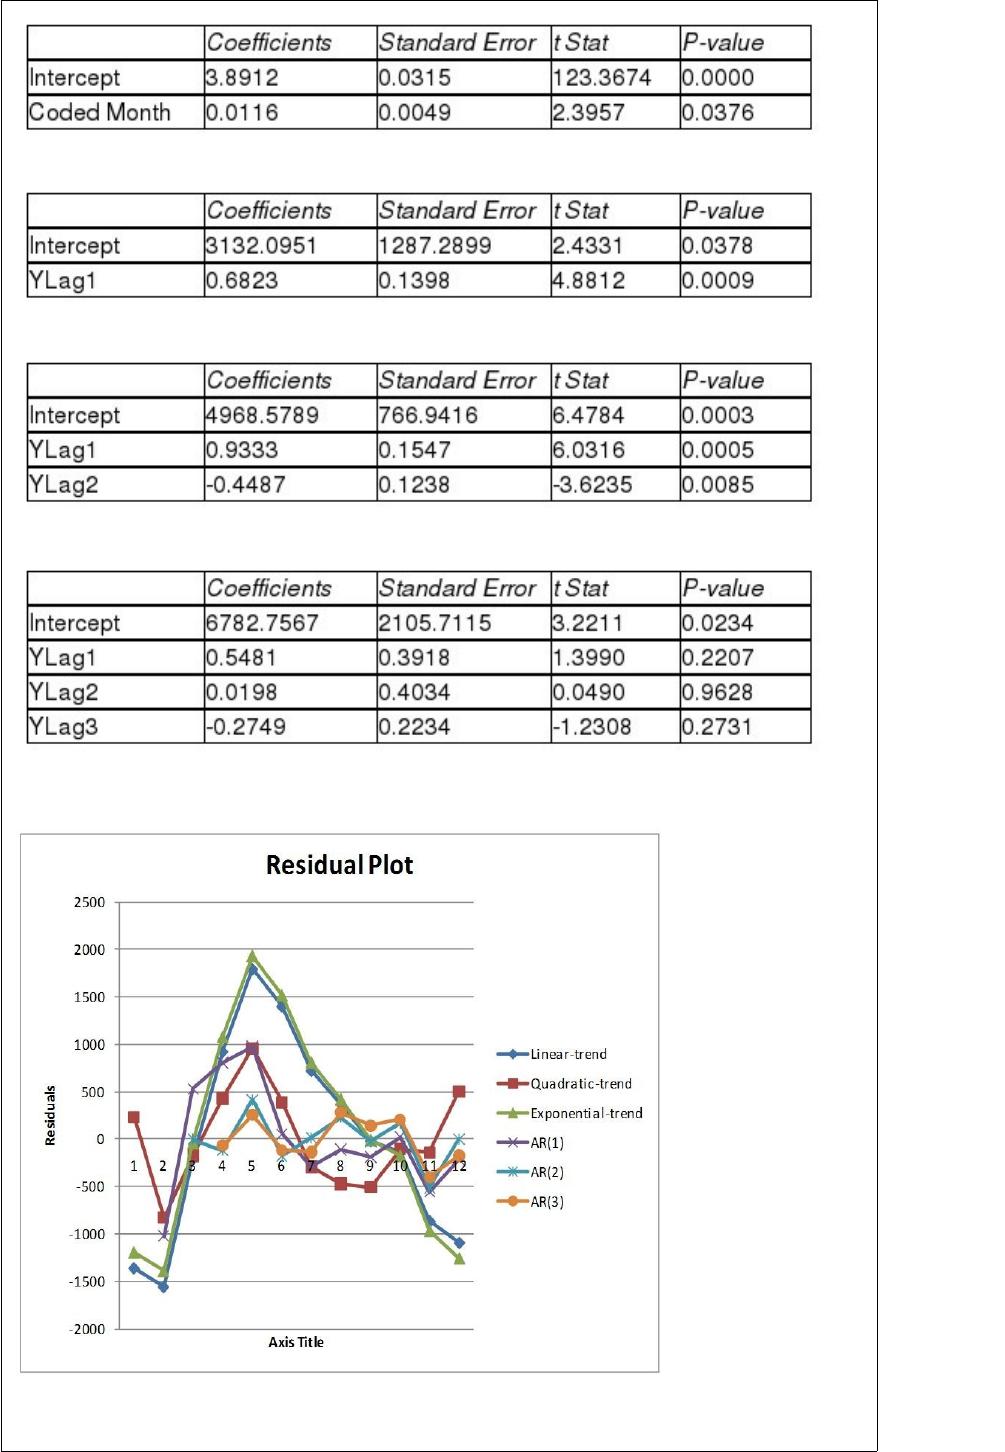
The results of the linear trend, quadratic trend, exponential trend, first-order
autoregressive, second-order autoregressive and third-order autoregressive model are
presented below in which the coded month for the 1st month is 0:
Linear trend model:
Quadratic trend model:
Exponential trend model:
First-order autoregressive:
Second-order autoregressive:
Third-order autoregressive:
Below is the residual plot of the various models:
True or False: Referring to Table 16-13, the best model based on the residual plots is the
linear-trend model.
True or False: The brand of TV one owns is an example of an ordinal scaled variable.
TABLE 12-6
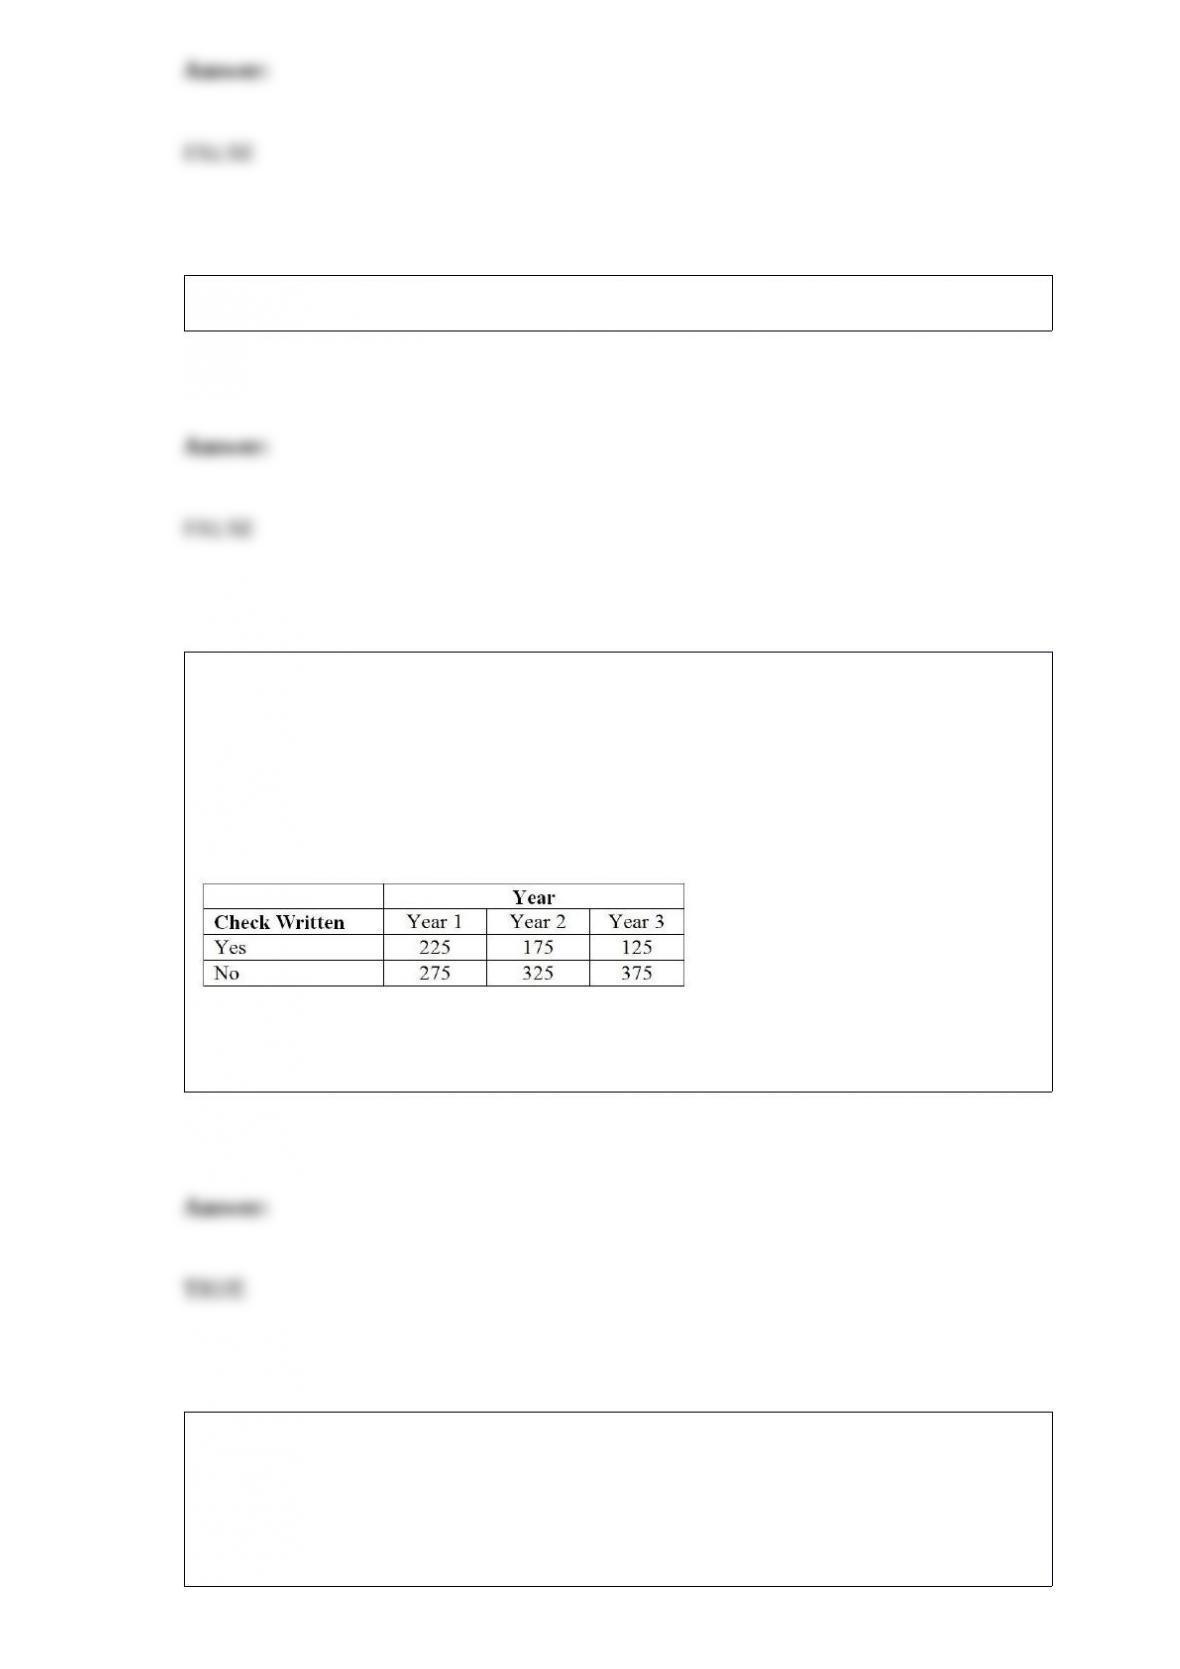
According to an article in Marketing News, fewer checks are being written at the
grocery store checkout than in the past. To determine whether there is a difference in
the proportion of shoppers who pay by check among three consecutive years at a 0.05
level of significance, the results of a survey of 500 shoppers in three consecutive years
are obtained and presented below.
True or False: Referring to Table 12-6, there is sufficient evidence to conclude that the
proportions between year 2 and year 3 are different at a 0.05 level of significance.
The weight of a randomly selected cookie from a production line can most likely be
modeled by which of the following distributions?
A) Uniform distribution
B) Poisson distribution
C) Normal distribution
D) Exponential distribution
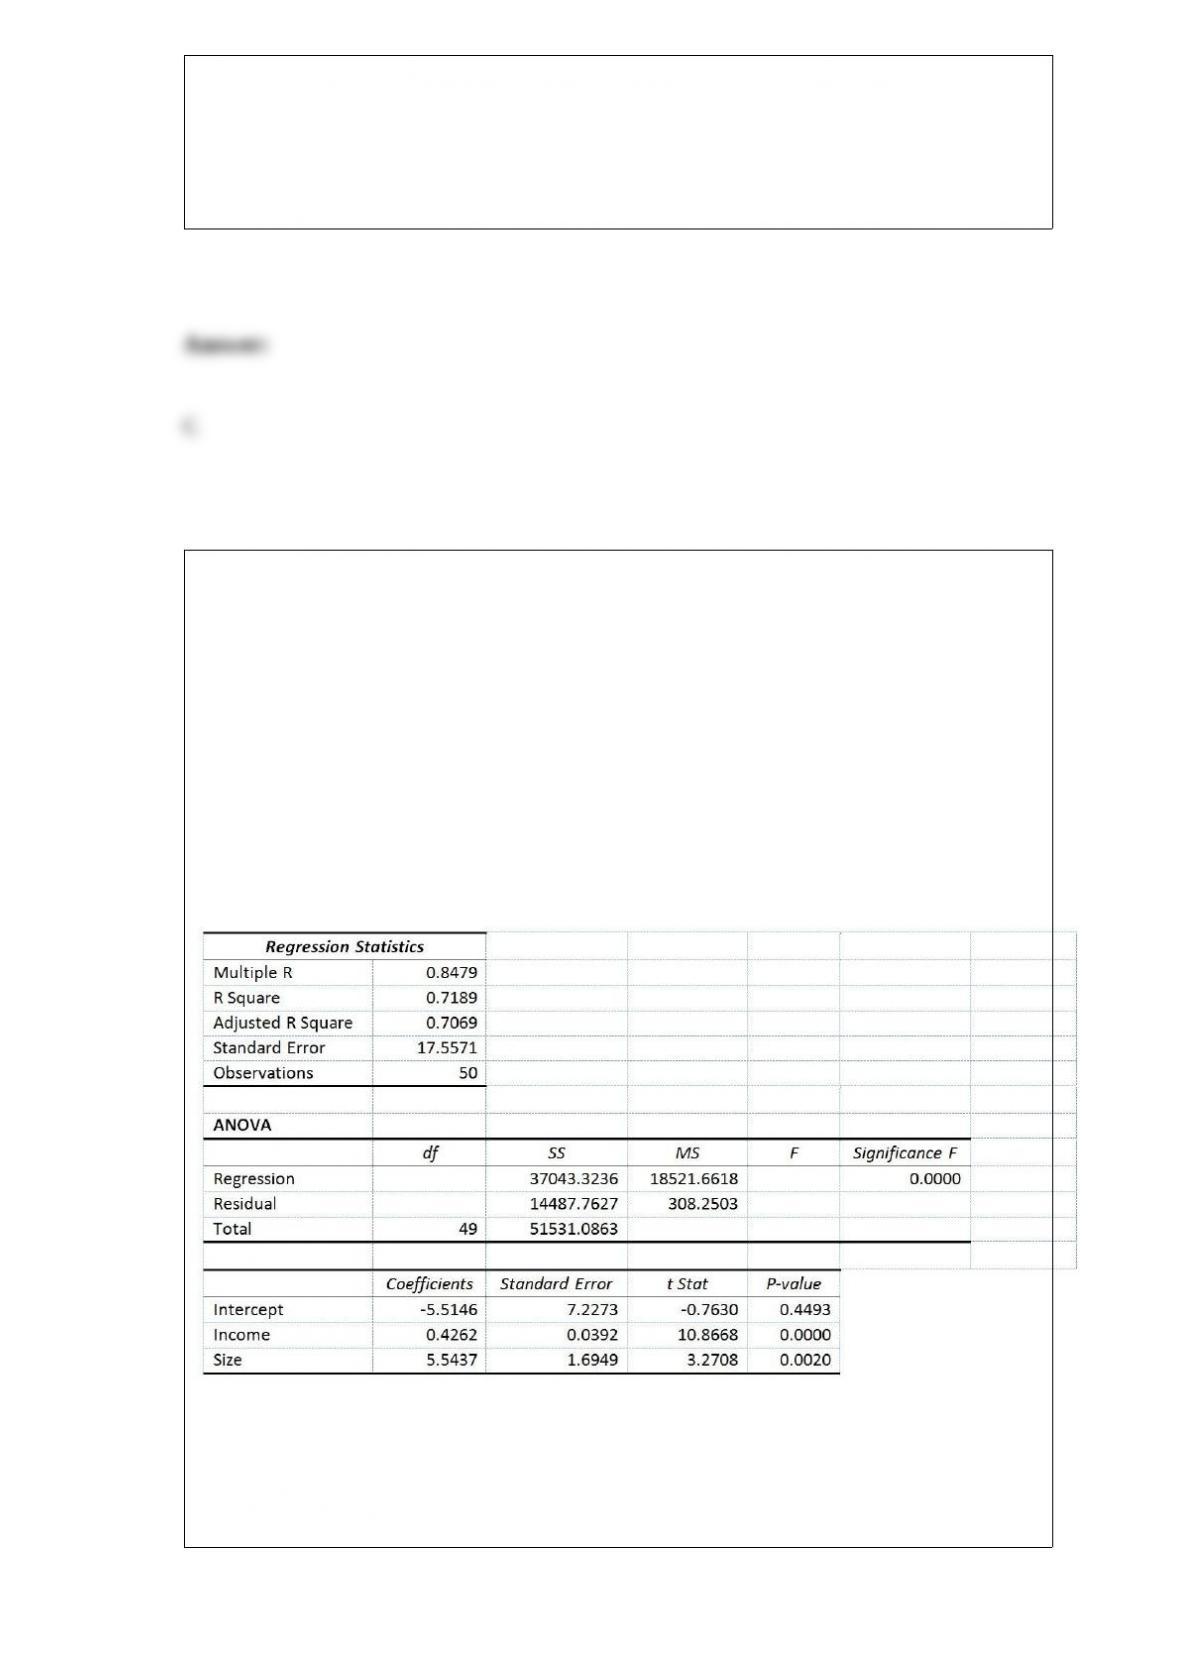
Referring to Table 14-4, when the builder used a simple linear regression model with
house size (House) as the dependent variable and family size (Size) as the independent
variable, he obtained an r2 value of 1.25%. What additional percentage of the total
variation in house size has been explained by including income in the multiple
regression?
TABLE 14-4
A real estate builder wishes to determine how house size (House) is influenced by
family income (Income) and family size (Size). House size is measured in hundreds of
square feet and income is measured in thousands of dollars. The builder randomly
selected 50 families and ran the multiple regression. Partial Microsoft Excel output is
provided below:
Also SSR (X1∣ X2) = 36400.6326 and SSR (X2∣ X1) = 3297.7917
A) 15.00%
B) 70.64%
C) 71.50%
D) 73.62%

Referring to Table 14-5, what is the p-value for Capital?
A) 0.01
B) 0.025
C) 0.05
D) None of the above.
A completely randomized design
A) has only one factor with several treatment groups.
B) can have more than one factor, each with several treatment groups.
C) has one factor and one block.
D) has one factor and one block and multiple values.
Which of the following is not one of Deming’s 14 points?
A) Belief in mass inspection.
B) Create constancy of purpose for improvement of product or service.
C) Adopt and institute leadership.
D) Drive out fear.
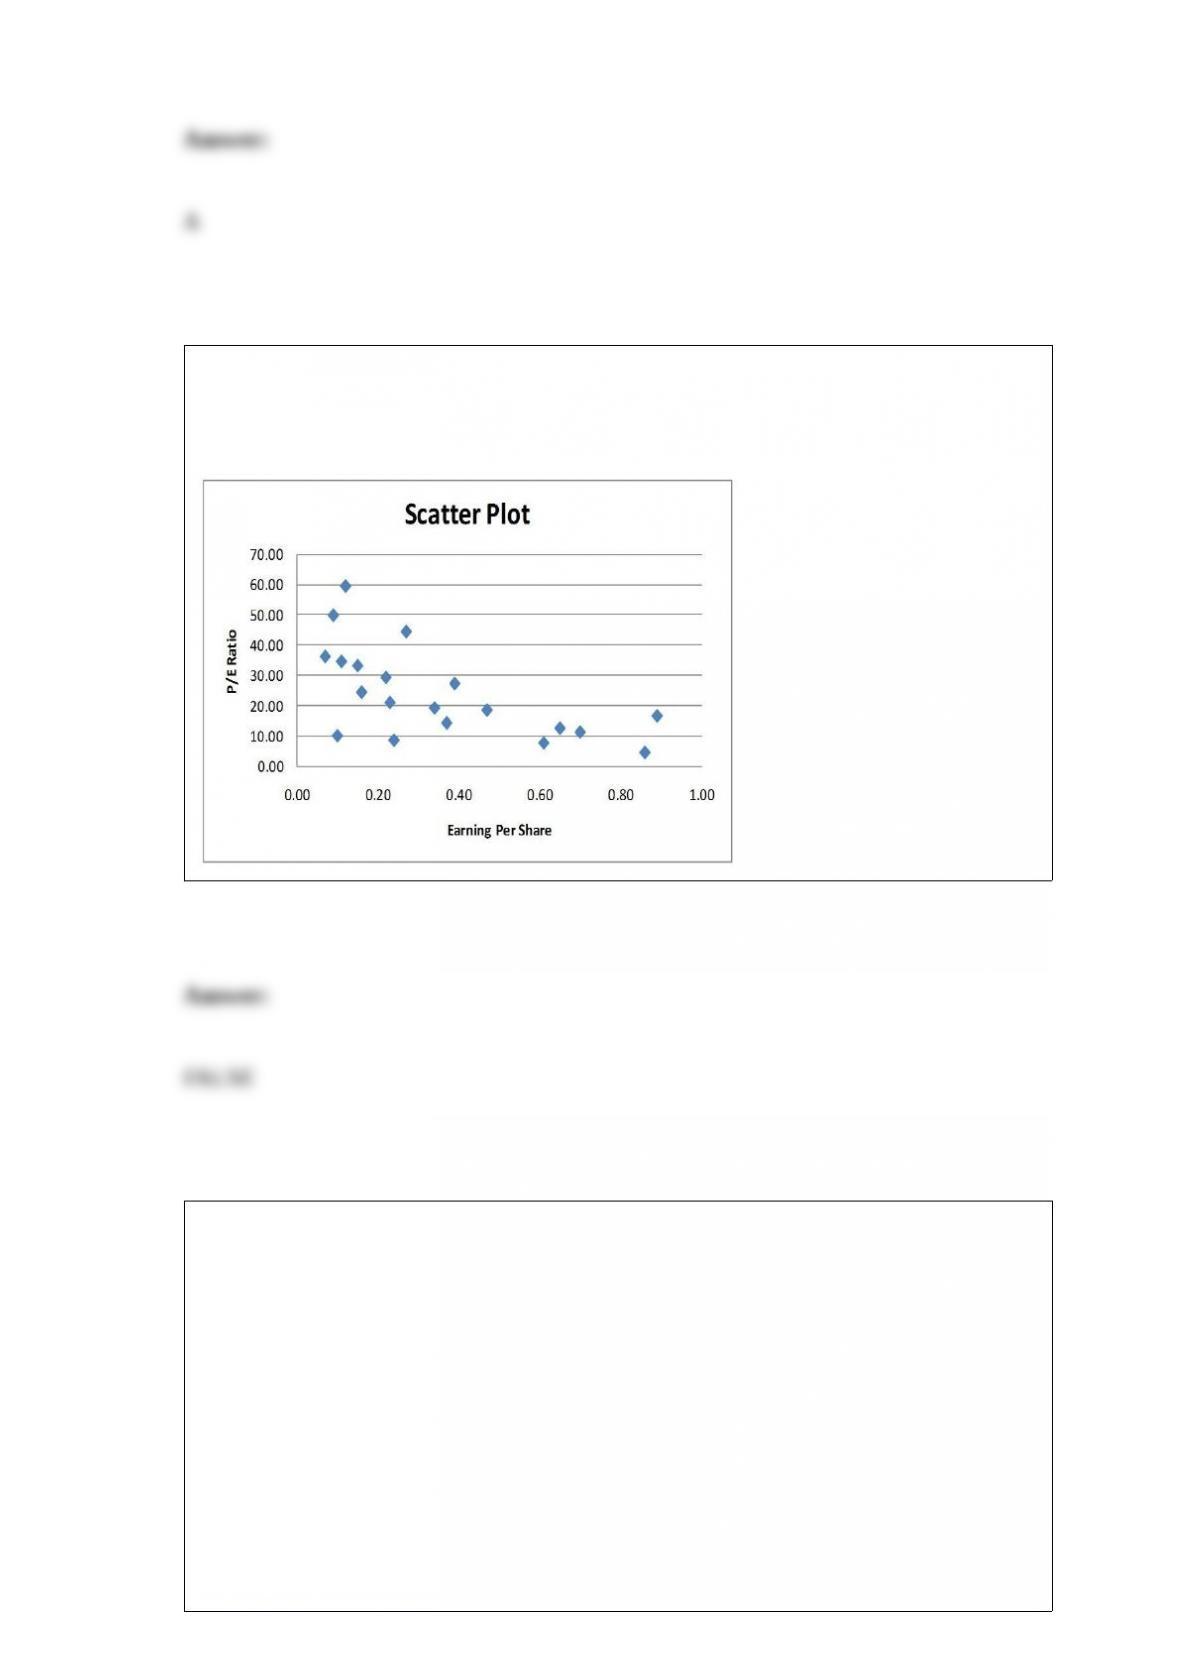
True or False: Given below is the scatter plot of the price/earnings ratio versus earnings
per share of 20 U.S. companies. There appears to be a positive relationship between
price/earnings ratio and earnings per share.
A major Blu-ray rental chain is considering opening a new store in an area that
currently does not have any such stores. The chain will open if there is evidence that
more than 5,000 of the 20,000 households in the area are equipped with Blu-ray
players. It conducts a telephone poll of 300 randomly selected households in the area
and finds that 96 have Blu-ray players. The p-value associated with the test statistic in
this problem is approximately equal to
A) 0.0100.
B) 0.0051.
C) 0.0026.

D) 0.0013.
TABLE 1-1
The manager of the customer service division of a major consumer electronics company
is interested in determining whether the customers who have purchased a Blu-ray
player made by the company over the past 12 months are satisfied with their products.
Referring to Table 1-1, the possible responses to the question “How would you rate the
quality of your purchase experience with 1 = excellent, 2 = good, 3 = decent, 4 = poor,
5 = terrible?” are values from a
A) discrete numerical variable.
B) continuous numerical variable.
C) categorical variable.
D) table of random numbers.
TABLE 17-8
The superintendent of a school district wanted to predict the percentage of students
passing a sixth-grade proficiency test. She obtained the data on percentage of students
passing the proficiency test (% Passing), daily mean of the percentage of students
attending class (% Attendance), mean teacher salary in dollars (Salaries), and
instructional spending per pupil in dollars (Spending) of 47 schools in the state.
Following is the multiple regression output with Y = % Passing as the dependent
variable, X1 = % Attendance, X2 = Salaries and X3 = Spending:
Referring to Table 17-8, which of the following is the correct alternative hypothesis to
test whether the daily mean of the percentage of students attending class has any effect
on the percentage of students passing the proficiency test, taking into account the effect
of all the other independent variables?
A) H1 : β0 ≠0
B) H1 : β1 ≠0
C) H1 : β2 ≠0
D) H1 : β3 ≠0
TABLE 15-3
A chemist employed by a pharmaceutical firm has developed a muscle relaxant. She
took a sample of 14 people suffering from extreme muscle constriction. She gave each a
vial containing a dose (X) of the drug and recorded the time to relief (Y) measured in
seconds for each. She fit a curvilinear model to this data. The results obtained by
Microsoft Excel follow
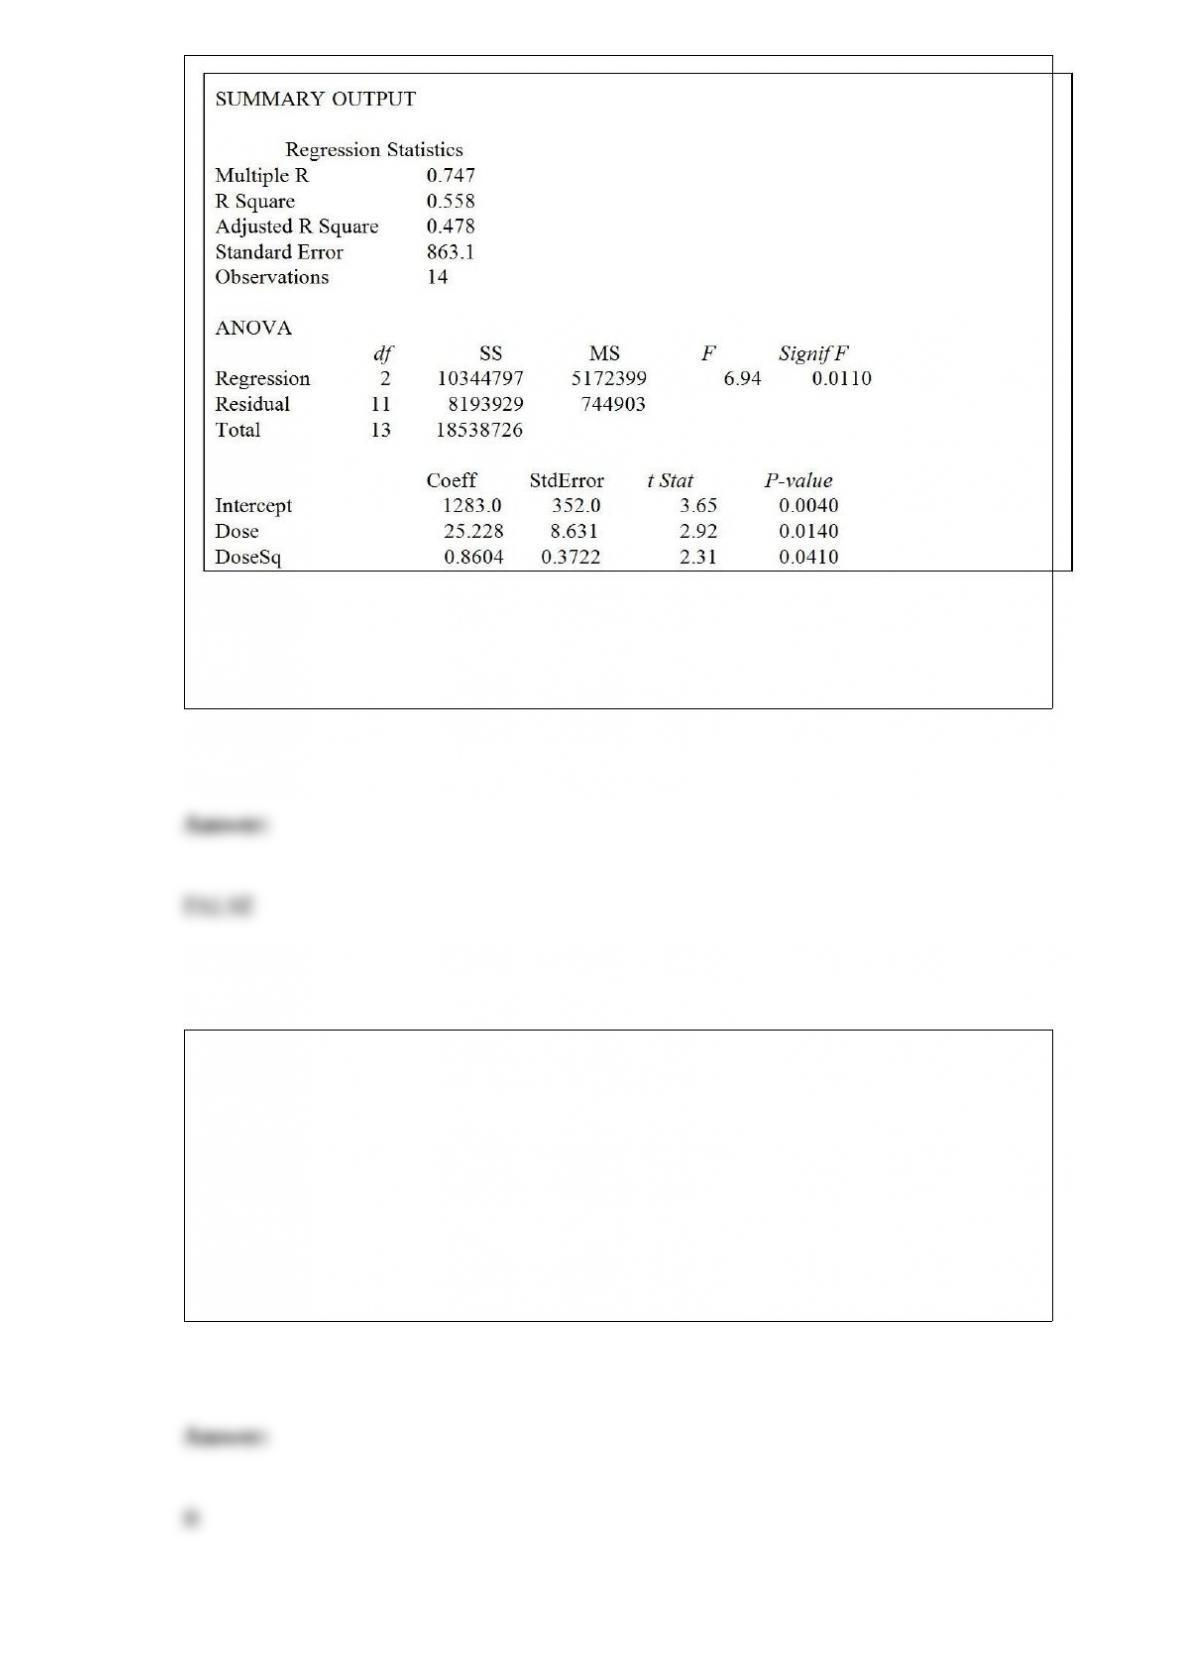
True or False: Referring to Table 15-3, suppose the chemist decides to use a t test to
determine if there is a significant difference between a linear model and a curvilinear
model that includes a linear term. If she used a level of significance of 0.05, she would
decide that the linear model is sufficient.
In a two-way ANOVA, the degrees of freedom for the “error” term is
A) (r – 1) (c – 1).
B) rc(n’ – 1).
C) (r – 1).
D) rcn’ + 1.

TABLE 19-1
The following payoff table shows profits associated with a set of 3 alternatives under 2
possible states of nature
Referring to Table 19-1, if the probability of S1 is 0.5, then the expected opportunity
loss (EOL) for A3 is
A) 3.
B) 4.5.
C) 7.
D) 8.
A population frame for a survey contains a listing of 72,345 names. Using a table of
random numbers, how many digits will the code numbers for each member of your
population contain?
A) 3
B) 4
C) 5
D) 6

Referring to Table 14-15, which of the following is the correct null
hypothesis to test whether mean teacher salary has any effect on
percentage of students passing the pro!ciency test, taking into
account the effect of instructional spending per pupil?
TABLE 14-15
The superintendent of a school district wanted to predict the
percentage of students passing a sixth-grade pro!ciency test. She
obtained the data on percentage of students passing the pro!ciency
test (% Passing), mean teacher salary in thousands of dollars
(Salaries), and instructional spending per pupil in thousands of dollars
(Spending) of 47 schools in the state.
Following is the multiple regression output with Y = % Passing as the
dependent variable, X1 = Salaries and X2 = Spending:
A) H0 : β0 = 0
B) H0 : β1 = 0
C) H0 : β2 = 0
D) H0 : β3 = 0

Suppose that past history shows that 60% of college students prefer Brand C cola. A
sample of 5 students is to be selected. The probability that exactly 3 prefer brand C is
________.
If the Durbin-Watson statistic has a value close to 0, which assumption is violated?
A) Normality of the errors
B) Independence of errors
C) Homoscedasticity
D) None of the above
The employees of a company were surveyed on questions regarding their educational
background (college degree or no college degree) and marital status (single or married).
Of the 600 employees, 400 had college degrees, 100 were single, and 60 were single
college graduates. The probability that an employee of the company does not have a
college degree is
A) 0.10.
B) 0.33.

C) 0.67.
D) 0.75.
An economist is interested in studying the incomes of consumers in a particular country.
The population standard deviation is known to be $1,000. A random sample of 50
individuals resulted in a mean income of $15,000. What total sample size would the
economist need to use for a 95% confidence interval if the width of the interval should
not be more than $100?
A) n = 1537
B) n = 385
C) n = 40
D) n = 20
A wheel spinning game is played with a special wheel with 24 equal segments that
determine the dollar values of a single spin. Which of the following distributions can
best be used to compute the probability of winning a specific dollar value in a single
spin?
A) Uniform distribution
B) Binomial distribution
C) Normal distribution
D) Exponential distribution
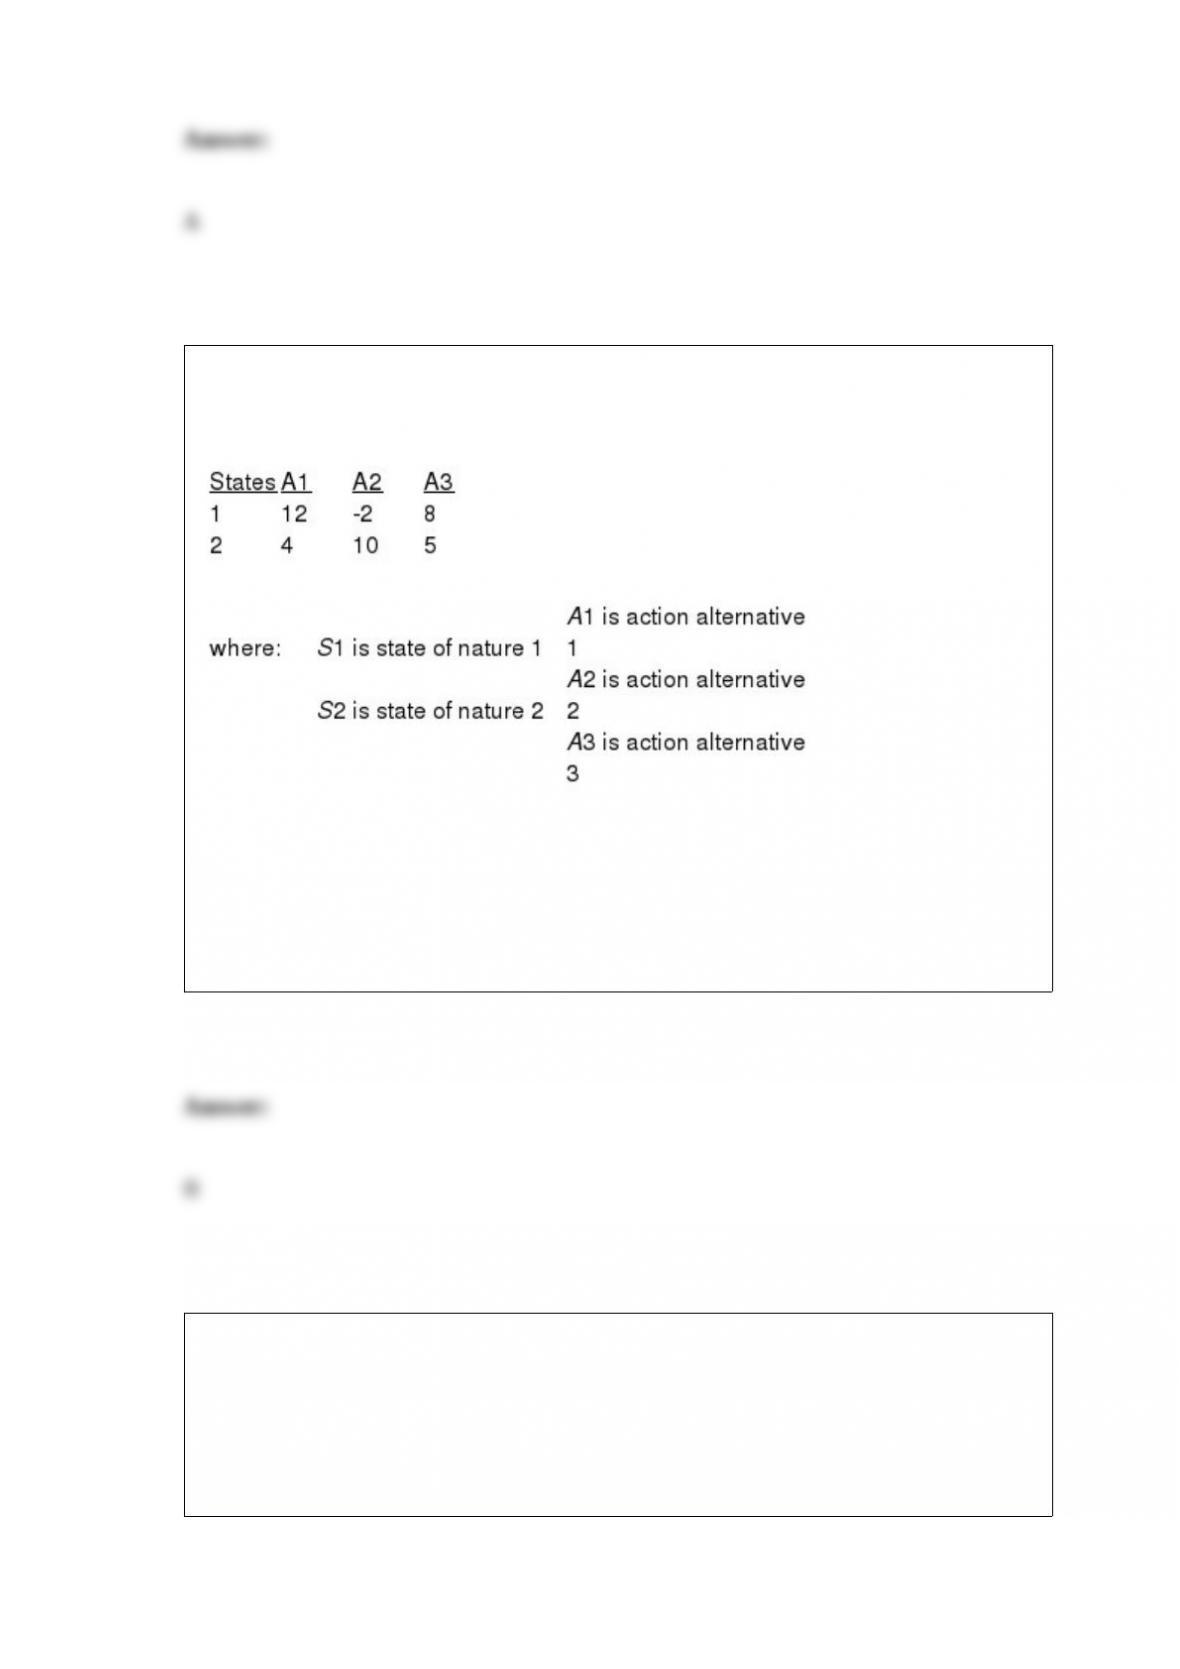
TABLE 19-1
The following payoff table shows profits associated with a set of 3 alternatives under 2
possible states of nature
Referring to Table 19-1, if the probability of S1 is 0.2, what is the optimal alternative
using EOL?
A) A1
B) A2
C) A3
D) It cannot be determined.
TABLE 12-15
Two new different models of compact SUVs have just arrived at the market. You are
interested in comparing the gas mileage performance of both models to see if they are
the same. A partial computer output for twelve compact SUVs of model 1 and thirteen
of model 2 is given below:
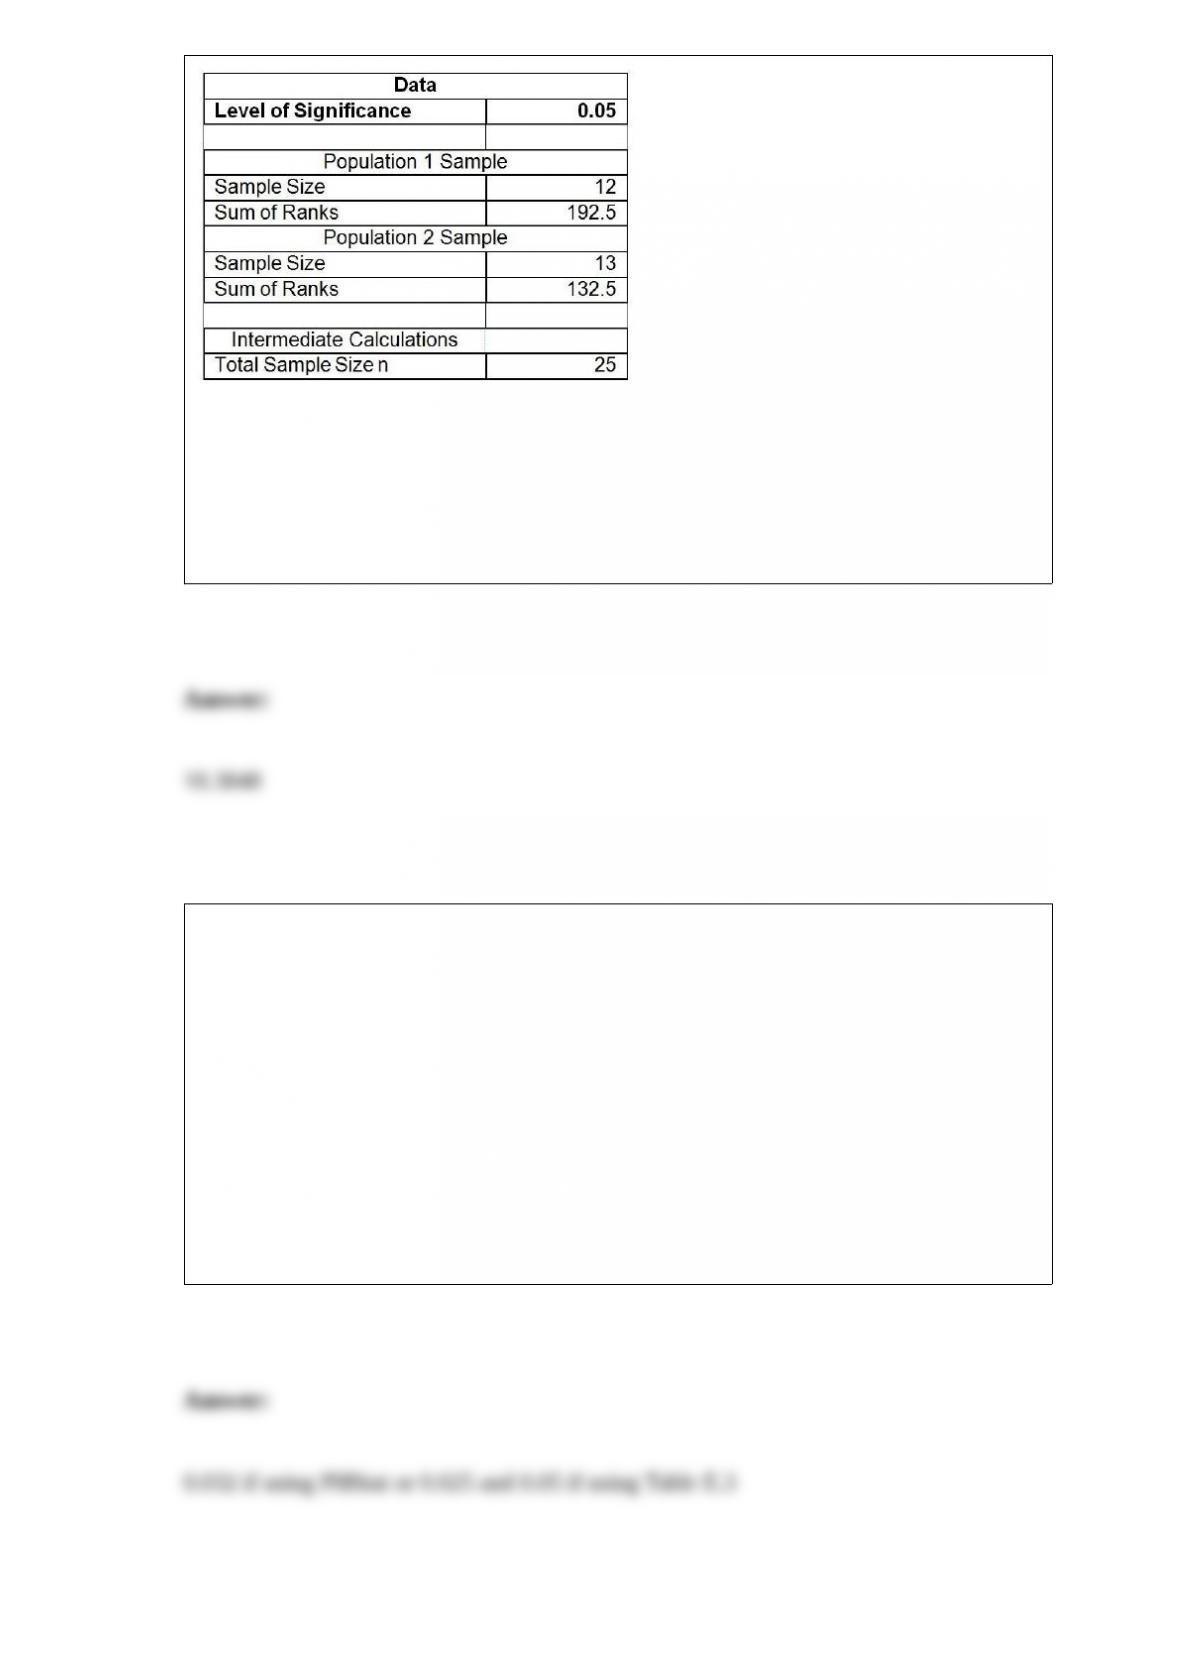
You are told that the gas mileage population distributions for both models are not
normally distributed.
Referring to Table 12-15, what is the standard deviation of the Wilcoxon rank sum test
statistic T1?
TABLE 10-6
To investigate the efficacy of a diet, a random sample of 16 male patients is selected
from a population of adult males using the diet. The weight of each individual in the
sample is taken at the start of the diet and at a medical follow-up 4 weeks later.
Assuming that the population of differences in weight before versus after the diet
follow a normal distribution, the t-test for related samples can be used to determine if
there was a significant decrease in the mean weight during this period. Suppose the
mean decrease in weights over all 16 subjects in the study is 3.0 pounds with the
standard deviation of differences computed as 6.0 pounds.
Referring to Table 10-6, the p-value for a one-tail test is ________.

You were told that the mean score on a statistics exam is 75 with the scores normally
distributed. In addition, you know the probability of a score between 55 and 60 is
4.41% and that the probability of a score greater than 90 is 6.68%. The middle 95.46%
of the students will score between which two scores?
TABLE 5-8
Two different designs on a new line of winter jackets for the coming winter are
available for your manufacturing plants. Your profit (in thousands of dollars) will
depend on the taste of the consumers when winter arrives. The probability of the three
possible different tastes of the consumers and the corresponding profits are presented in
the following table.
Referring to Table 5-8, what is your expected profit when Design A is chosen?
The rate of return for a stock over a three-year period is 0.527, 0.145, and 0.684. The
geometric mean rate of return is ________.
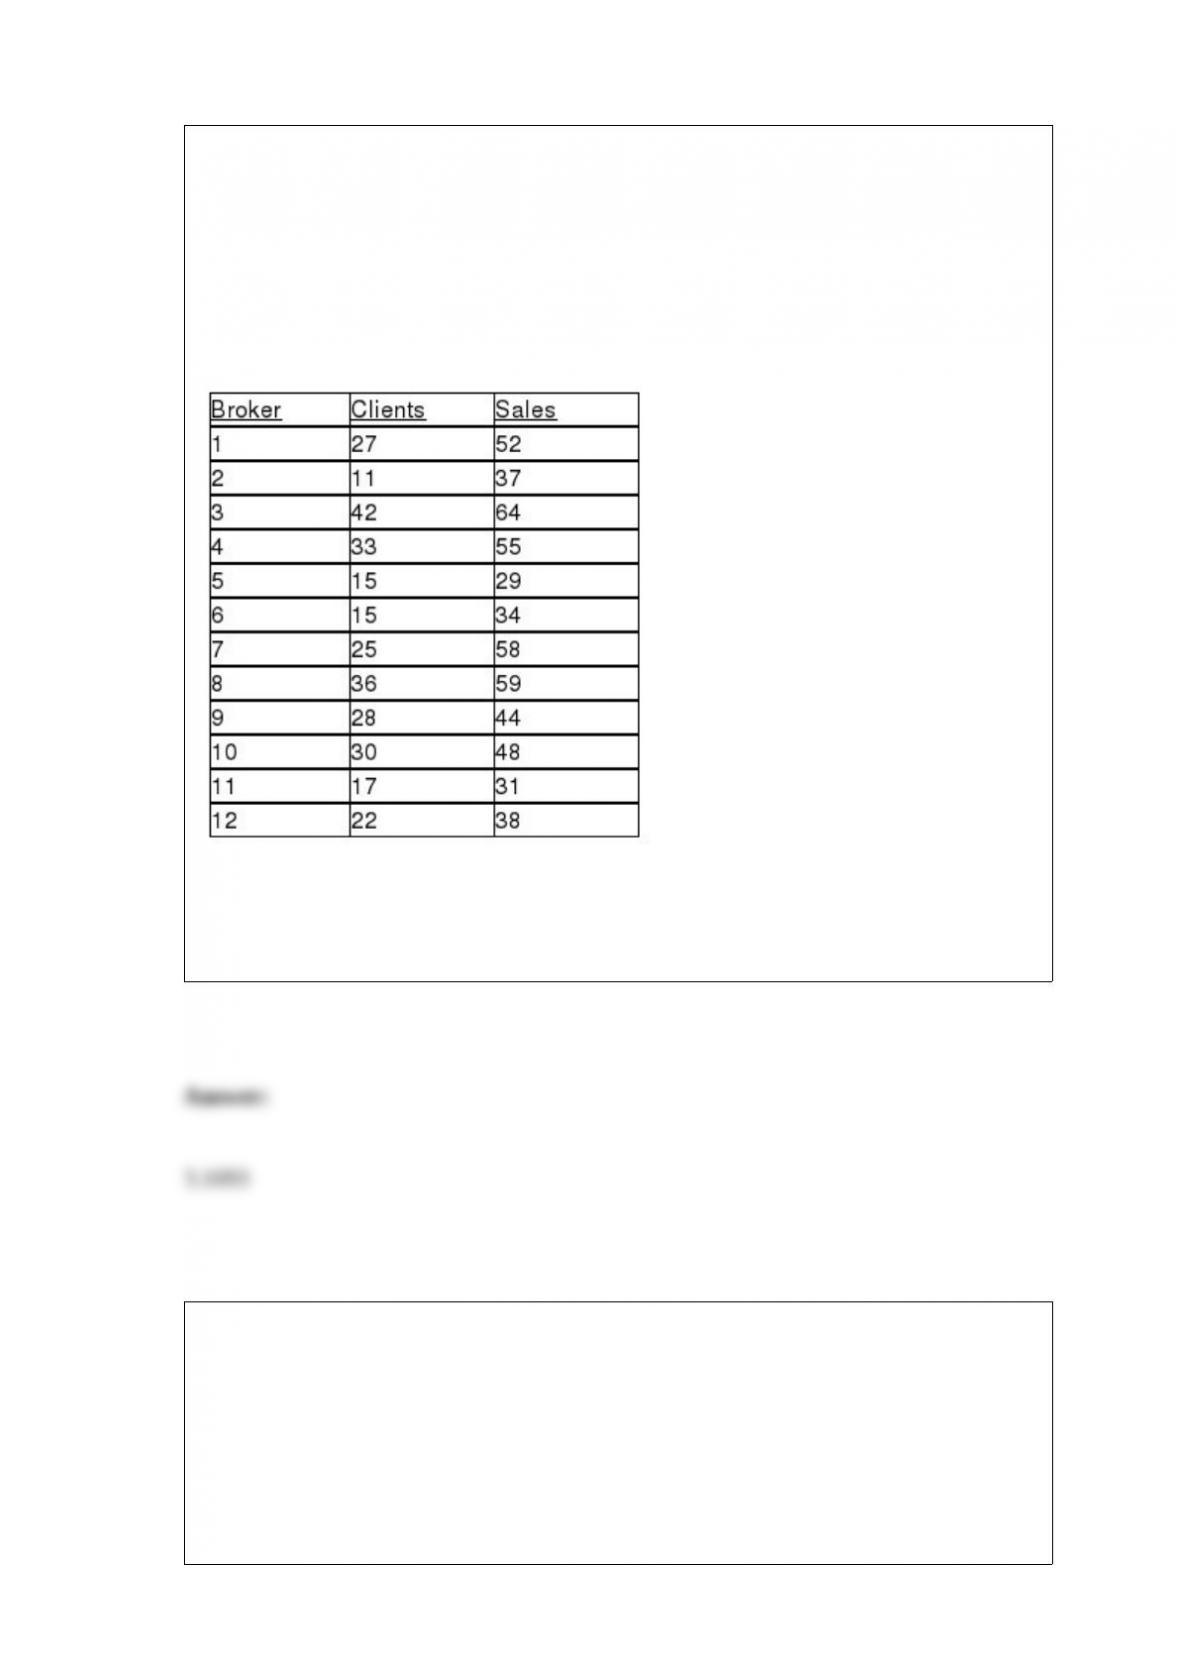
TABLE 13-4
The managers of a brokerage firm are interested in finding out if the number of new
clients a broker brings into the firm affects the sales generated by the broker. They
sample 12 brokers and determine the number of new clients they have enrolled in the
last year and their sales amounts in thousands of dollars. These data are presented in the
table that follows.
Referring to Table 13-4, suppose the managers of the brokerage firm want to construct a
99% confidence interval estimate for the mean sales made by brokers who have brought
into the firm 24 new clients. The t critical value they would use is ________.
TABLE 5-9
A major hotel chain keeps a record of the number of mishandled bags per 1,000
customers. In a recent year, the hotel chain had 4.06 mishandled bags per 1,000
customers. Assume that the number of mishandled bags has a Poisson distribution.
Referring to Table 5-9, what is the probability that in the next 1,000 customers, the
hotel chain will have less than two and more than eight mishandled bags?