Unlock document.
This document is partially blurred.
Unlock all pages and 1 million more documents.
Get Access

True or False: The Chancellor of a university has commissioned a team to collect data
on students' GPAs and the amount of time they spend bar hopping every week
(measured in minutes). He wants to know if imposing much tougher regulations on all
campus bars to make it more difficult for students to spend time in any campus bar will
have a significant impact on general students' GPAs. His team should use a t test on the
slope of the population regression.
True or False: The standard error of the sampling distribution of a sample proportion is
where p is the sample proportion.
True or False: Determining the class boundaries of a frequency distribution is highly
subjective.
TABLE 9-1
Microsoft Excel was used on a set of data involving the number of defective items
found in a random sample of 46 cases of light bulbs produced during a morning shift at
a plant. A manager wants to know if the mean number of defective bulbs per case is

greater than 20 during the morning shift. She will make her decision using a test with a
level of significance of 0.10. The following information was extracted from the
Microsoft Excel output for the sample of 46 cases:
True or False: Referring to Table 9-1, the null hypothesis would be rejected.
True or False: The quality ("terrible," "poor," "fair", "acceptable," "very good," and
"excellent") of a day care center is an example of a nominal scaled variable.
True or False: To calculate expected profit under certainty, you need to have perfect
information about which event will occur.
True or False: TABLE 18-10
Below is the number of defective items from a production line over twenty consecutive

morning shifts.
Referring to Table 18-10, the c chart suggests that the special cause of variation must be
incorporated into the process to become part of the permanent ongoing process.
True or False: TABLE 17-9
What are the factors that determine the acceleration time (in sec.) from 0 to 60 miles per
hour of a car? Data on the following variables for 171 different vehicle models were
collected:
Accel Time: Acceleration time in sec.
Cargo Vol: Cargo volume in cu. ft.
HP: Horsepower
MPG: Miles per gallon
SUV: 1 if the vehicle model is an SUV with Coupe as the base when SUV and Sedan
are both 0
Sedan: 1 if the vehicle model is a sedan with Coupe as the base when SUV and Sedan
are both 0
The regression results using acceleration time as the dependent variable and the
remaining variables as the independent variables are presented below.
The various residual plots are as shown below.
The coefficient of partial determination ( ) of each of the 5
predictors are, respectively, 0.0380, 0.4376, 0.0248, 0.0188, and 0.0312.
The coefficient of multiple determination for the regression model using each of the 5
variables Xj as the dependent variable and all other X variables as independent variables
( ) are, respectively, 0.7461, 0.5676, 0.6764, 0.8582, 0.6632.
Referring to Table 17-9, there is enough evidence to conclude that HP makes a
significant contribution to the regression model in the presence of the other independent
variables at a 5% level of significance.
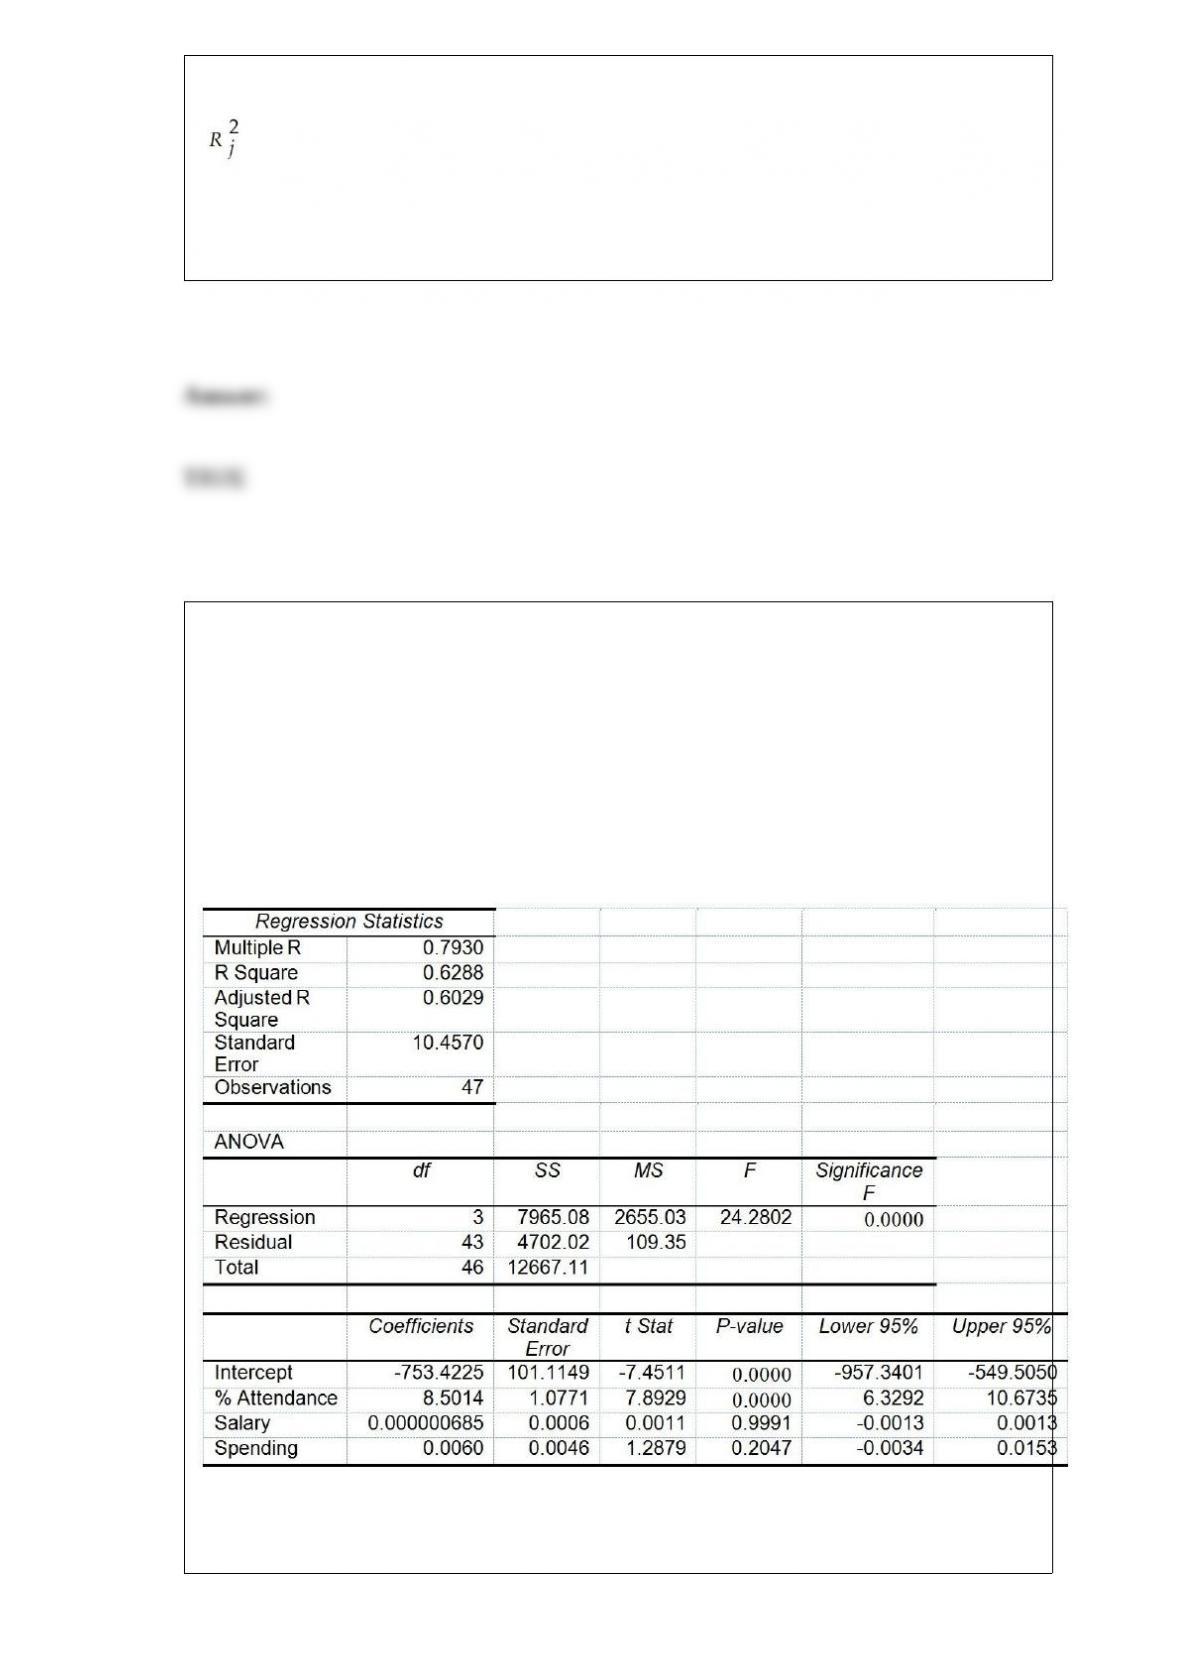
True or False: TABLE 17-8
The superintendent of a school district wanted to predict the percentage of students
passing a sixth-grade proficiency test. She obtained the data on percentage of students
passing the proficiency test (% Passing), daily mean of the percentage of students
attending class (% Attendance), mean teacher salary in dollars (Salaries), and
instructional spending per pupil in dollars (Spending) of 47 schools in the state.
Following is the multiple regression output with Y = % Passing as the dependent
variable, X1 = % Attendance, X2 = Salaries and X3 = Spending:
Referring to Table 17-8, there is sufficient evidence that instructional spending per pupil
has an effect on the percentage of students passing the proficiency test while holding
constant the effect of all the other independent variables at a 5% level of significance.

True or False: If P(A and B) = 0, then A and B must be mutually exclusive.
True or False: When an additional explanatory variable is introduced into a multiple
regression model, the coefficient of multiple determination will never decrease.
True or False: TABLE 17-9
What are the factors that determine the acceleration time (in sec.) from 0 to 60 miles per
hour of a car? Data on the following variables for 171 different vehicle models were
collected:
Accel Time: Acceleration time in sec.
Cargo Vol: Cargo volume in cu. ft.
HP: Horsepower
MPG: Miles per gallon
SUV: 1 if the vehicle model is an SUV with Coupe as the base when SUV and Sedan
are both 0
Sedan: 1 if the vehicle model is a sedan with Coupe as the base when SUV and Sedan
are both 0
The regression results using acceleration time as the dependent variable and the
remaining variables as the independent variables are presented below.
The various residual plots are as shown below.
The coefficient of partial determination ( ) of each of the 5
predictors are, respectively, 0.0380, 0.4376, 0.0248, 0.0188, and 0.0312.
The coefficient of multiple determination for the regression model using each of the 5

variables Xj as the dependent variable and all other X variables as independent variables
( ) are, respectively, 0.7461, 0.5676, 0.6764, 0.8582, 0.6632.
Referring to Table 17-9, the 0 to 60 miles per hour acceleration time of an SUV is
predicted to be 0.1252 seconds higher than that of a sedan.
TABLE 14-15
The superintendent of a school district wanted to predict the
percentage of students passing a sixth-grade proficiency test. She
obtained the data on percentage of students passing the proficiency
test (% Passing), mean teacher salary in thousands of dollars
(Salaries), and instructional spending per pupil in thousands of dollars
(Spending) of 47 schools in the state.
Following is the multiple regression output with Y = % Passing as the
dependent variable, X1 = Salaries and X2 = Spending:
True or False: Referring to Table 14-15, the null hypothesis H0 : β1 =
β2 = 0 implies that percentage of students passing the proficiency
test is not a.ected by one of the explanatory variables.

True or False: The largest value that a Poisson random variable X can have is n.
TABLE 14-17
Given below are results from the regression analysis where the
dependent variable is the number of weeks a worker is unemployed
due to a layo. (Unemploy) and the independent variables are the age
of the worker (Age) and a dummy variable for management position
(Manager: 1 = yes, 0 = no).
The results of the regression analysis are given below:

True or False: Referring to Table 14-17, you can conclude that, holding
constant the e.ect of the other independent variable, age has no
impact on the mean number of weeks a worker is unemployed due to
a layo. at a 5% level of significance if we use only the information of
the 95% confidence interval estimate for the e.ect of a one year
increase in age on the mean number of weeks a worker is
unemployed due to a layo..
The symbol for the level of significance of a statistical test is
A) .
B) 1 - .
C) .

D) 1 - .
If we use the X2 method of analysis to test for the differences among 4 proportions, the
degrees of freedom are equal to
A) 3.
B) 4.
C) 5.
D) 1.
The coefficient of determination (r2) tells you
A) that the coefficient of correlation (r) is larger than 1.
B) whether r has any significance.
C) that you should not partition the total variation.
D) the proportion of total variation that is explained.

The chancellor of a major university was concerned about alcohol abuse on her campus
and wanted to find out the proportion of students at her university who visited campus
bars on the weekend before the final exam week. Her assistant took a random sample of
250 students. The answer on "whether you visited campus bars on the weekend before
the final exam week" from students in the sample is an example of
A) a categorical variable.
B) a discrete variable.
C) a continuous variable.
D) a table of random numbers.
TABLE 1-1
The manager of the customer service division of a major consumer electronics company
is interested in determining whether the customers who have purchased a Blu-ray
player made by the company over the past 12 months are satisfied with their products.
Referring to Table 1-1, the possible responses to the question "How many people are
there in your household?" result in
A) a nominal scale variable.
B) an ordinal scale variable.
C) an interval scale variable.
D) a ratio scale variable.
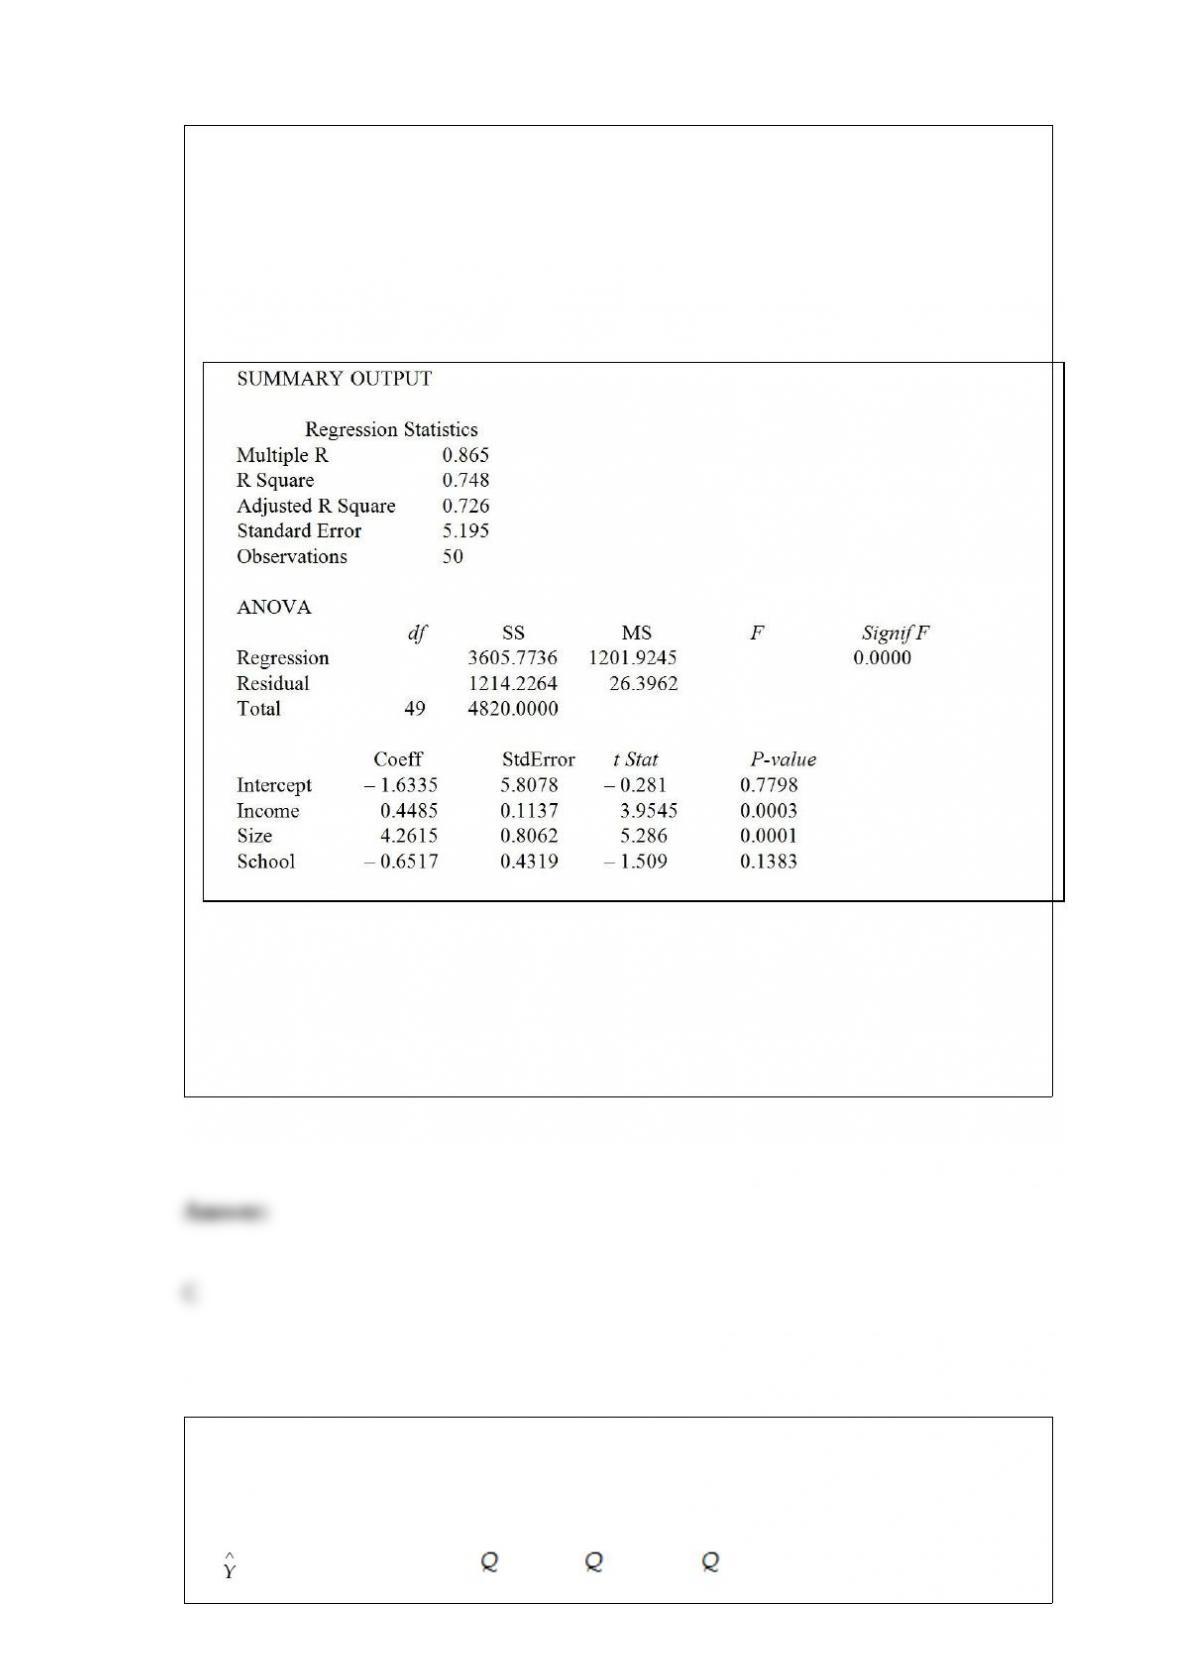
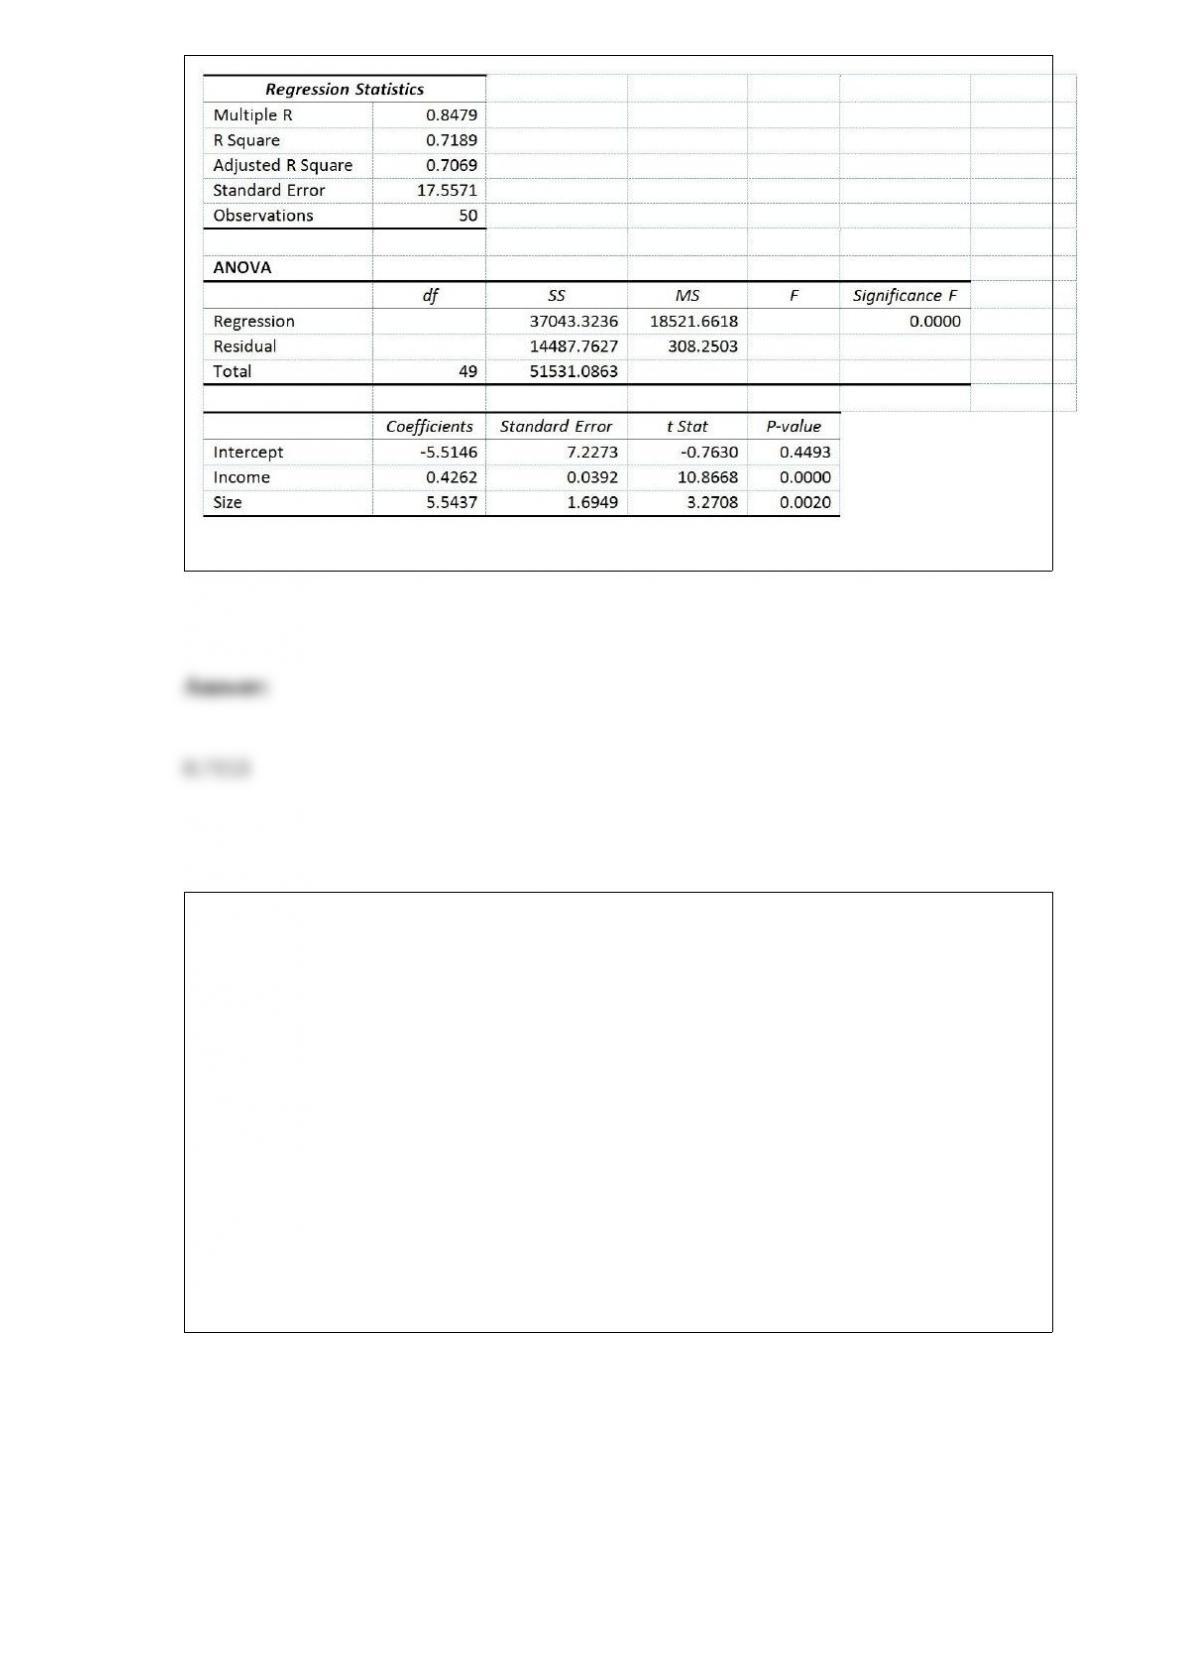
TABLE 17-1
A real estate builder wishes to determine how house size (House) is influenced by
family income (Income), family size (Size), and education of the head of household
(School). House size is measured in hundreds of square feet, income is measured in
thousands of dollars, and education is in years. The builder randomly selected 50
families and ran the multiple regression. Microsoft Excel output is provided below:
Referring to Table 17-1, what fraction of the variability in house size is explained by
income, size of family, and education?
A) 27.0%
B) 33.4%
C) 74.8%
D) 86.5%
TABLE 16-14
A contractor developed a multiplicative time-series model to forecast the number of
contracts in future quarters, using quarterly data on number of contracts during the
3-year period from 2010 to 2012. The following is the resulting regression equation:
ln = 3.37 + 0.117 X - 0.083 1 + 1.28 2 + 0.617 3

where is the estimated number of contracts in a quarter
X is the coded quarterly value with X = 0 in the first quarter of 2010
1 is a dummy variable equal to 1 in the first quarter of a year and 0 otherwise
2 is a dummy variable equal to 1 in the second quarter of a year and 0 otherwise
3 is a dummy variable equal to 1 in the third quarter of a year and 0 otherwise
Referring to Table 16-14, the best interpretation of the coefficient of X (0.117) in the
regression equation is
A) the quarterly compound growth rate in contracts is around 30.92%.
B) the annually compound growth rate in contracts is around 30.92%.
C) the quarterly compound growth rate in contracts is around 11.7%.
D) the annually compound growth rate in contracts is around 11.7%.
To assess the adequacy of a forecasting model, one measure that is often used is
A) quadratic trend analysis.
B) the MAD.
C) exponential smoothing.
D) moving averages.
The owner of a local nightclub has recently surveyed a random sample of n = 250
customers of the club. She would now like to determine whether or not the mean age of
her customers is more than 30. If so, she plans to alter the entertainment to appeal to an
older crowd. If not, no entertainment changes will be made. Which of the following
tests will you perform to help her make a decision?
A) t test for the mean
B) Z test for the proportion
C) Pooled-variance t test
D) Separate-variance t test
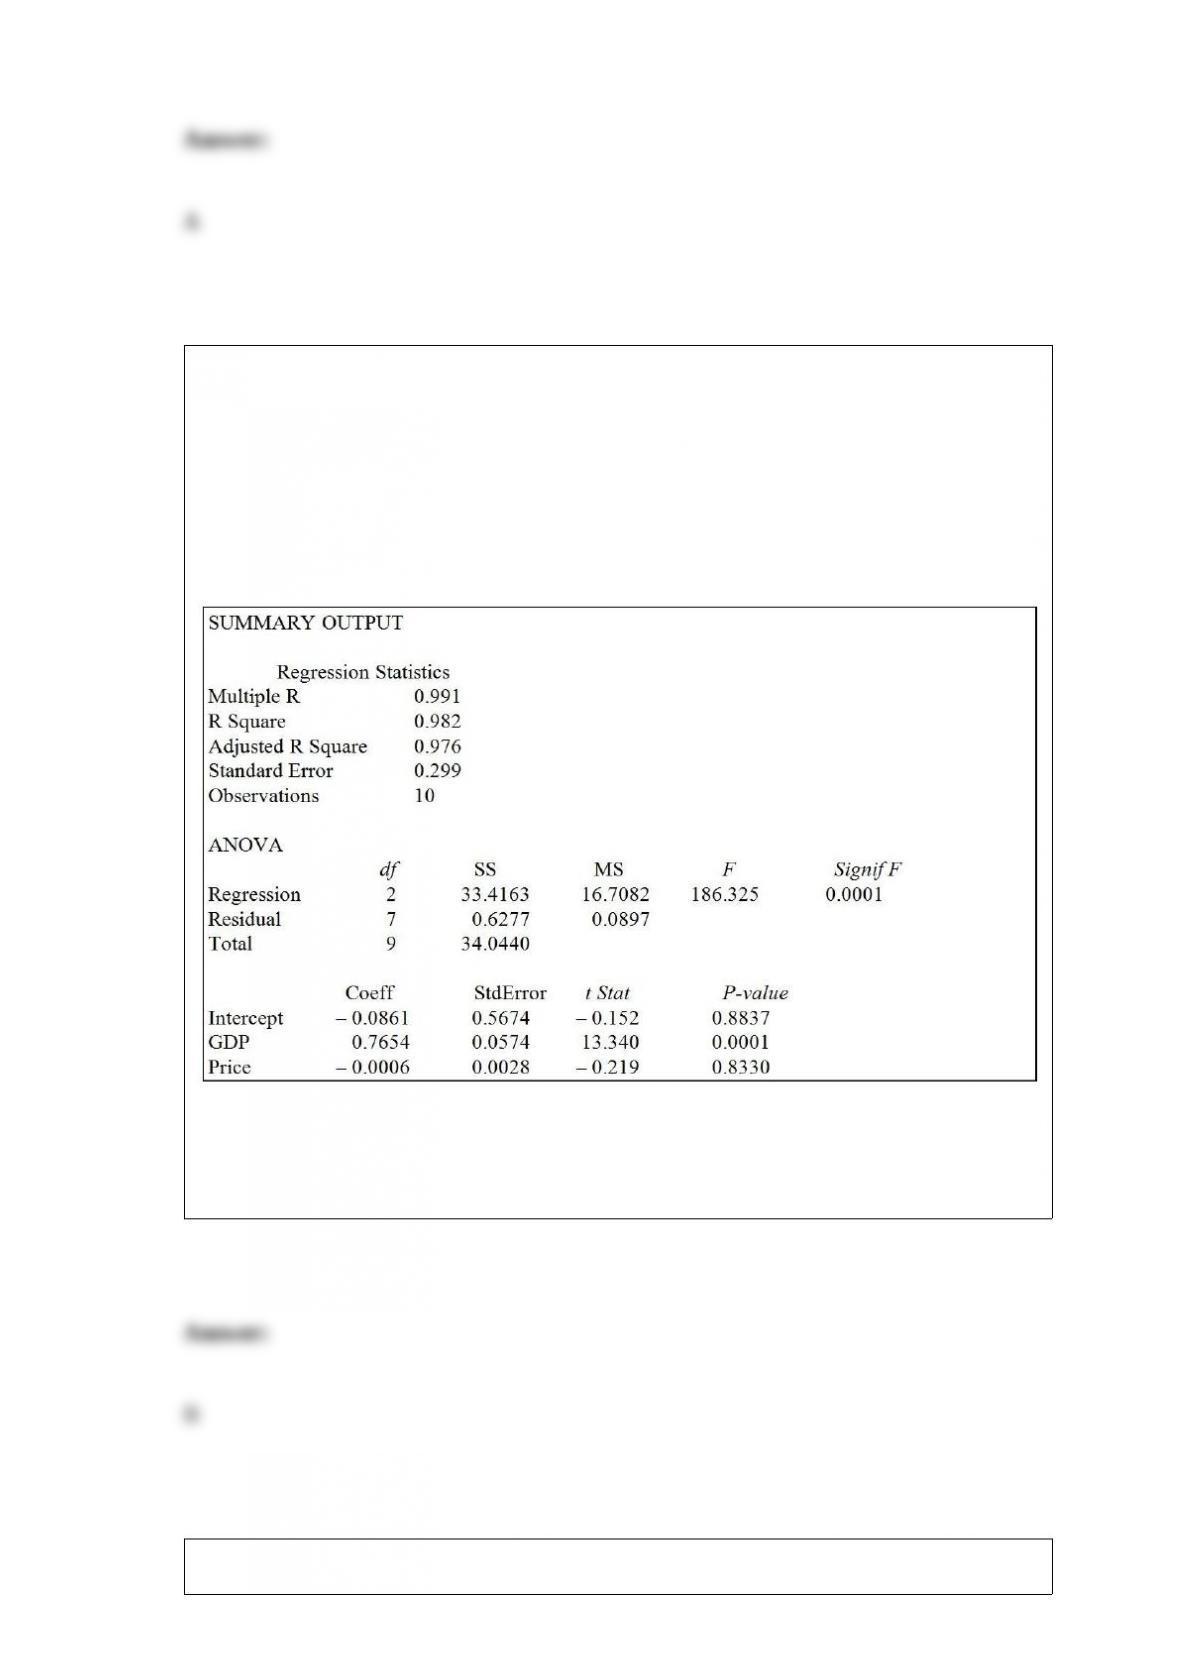
Referring to Table 14-3, one economy in the sample had an aggregate consumption
level of $3 billion, a GDP of $3.5 billion, and an aggregate price level of 125. What is
the residual for this data point?
TABLE 14-3
An economist is interested to see how consumption for an economy (in $ billions) is
influenced by gross domestic product ($ billions) and aggregate price (consumer price
index). The Microsoft Excel output of this regression is partially reproduced below.
A) $2.52 billion
B) $0.48 billion
C) -$1.33 billion
D) -$2.52 billion
TABLE 11-2
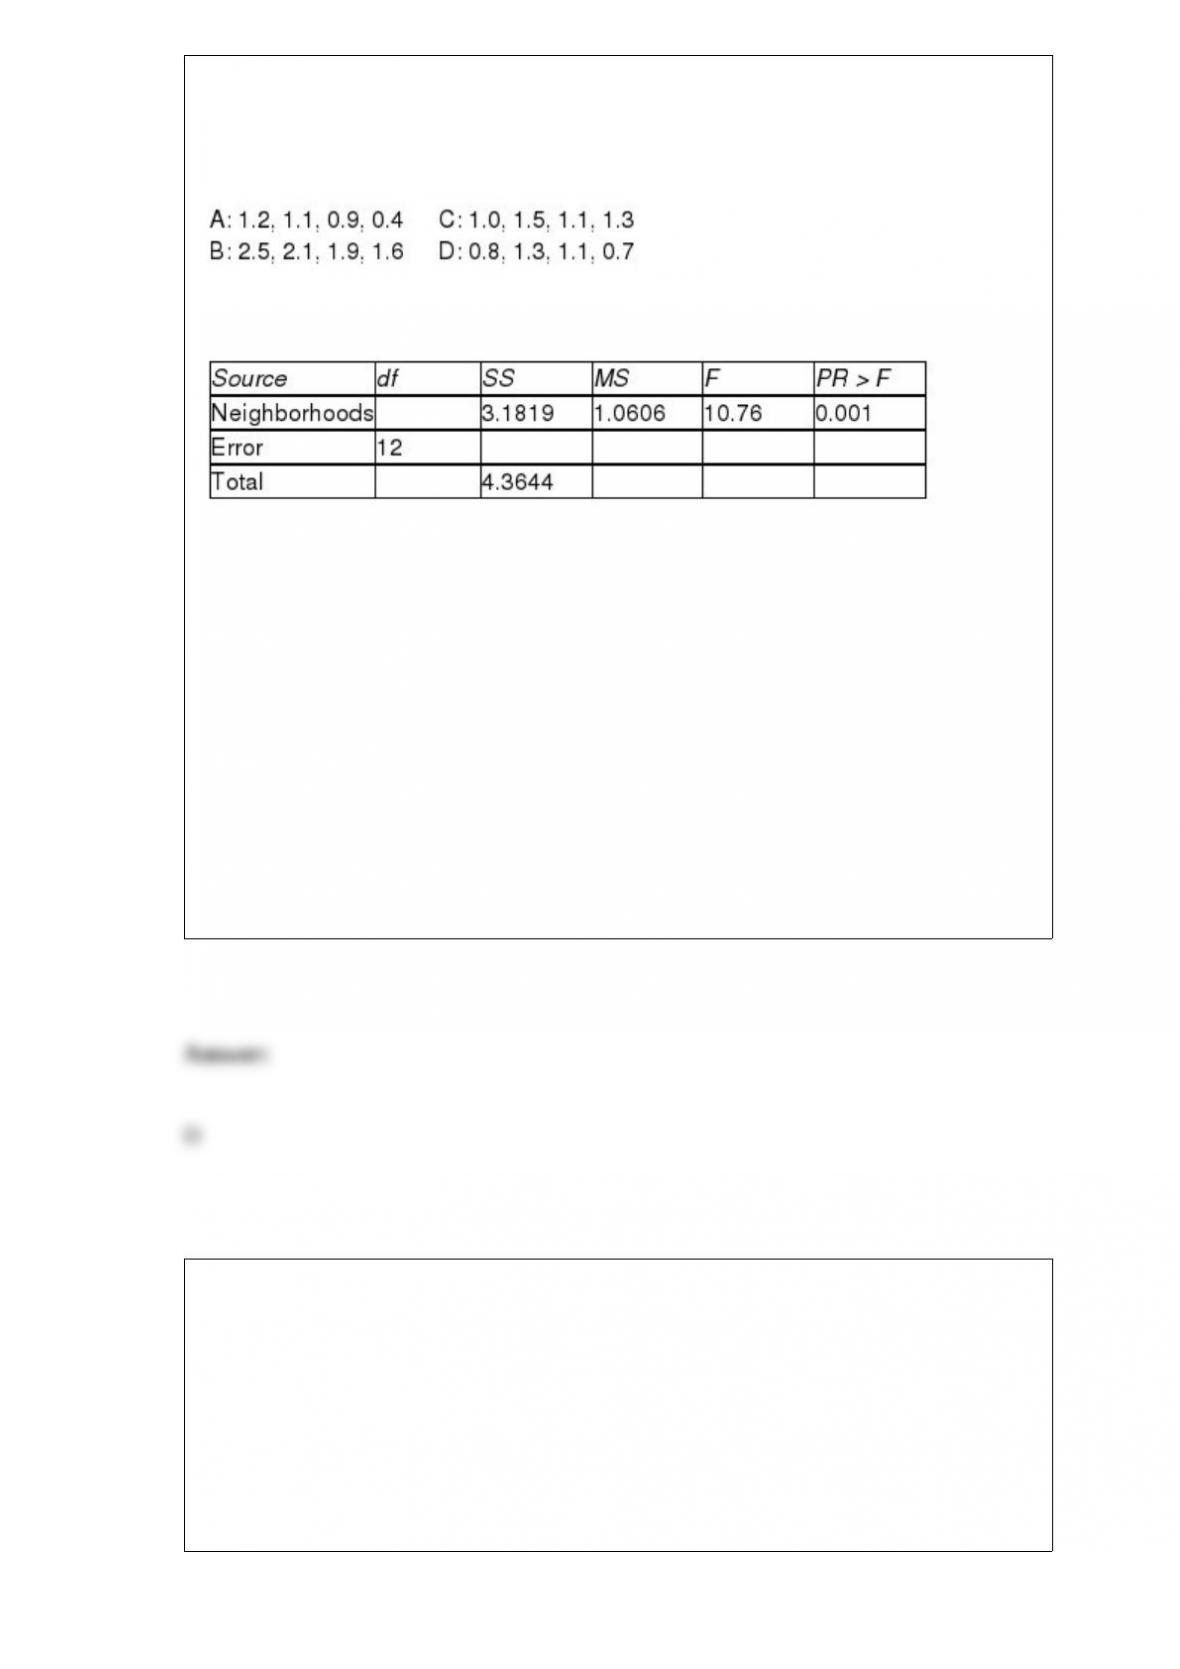
A realtor wants to compare the mean sales-to-appraisal ratios of residential properties
sold in four neighborhoods (A, B, C, and D). Four properties are randomly selected
from each neighborhood and the ratios recorded for each, as shown below.
Interpret the results of the analysis summarized in the following table:
Referring to Table 11-2, what should be the decision for the Levene's test for
homogeneity of variances at a 5% level of significance?
A) Reject the null hypothesis because the p-value is smaller than the level of
significance.
B) Reject the null hypothesis because the p-value is larger than the level of significance.
C) Do not reject the null hypothesis because the p-value is smaller than the level of
significance.
D) Do not reject the null hypothesis because the p-value is larger than the level of
significance.
TABLE 17-10
Given below are results from the regression analysis where the dependent variable is
the number of weeks a worker is unemployed due to a layoff (Unemploy) and the
independent variables are the age of the worker (Age), the number of years of education
received (Edu), the number of years at the previous job (Job Yr), a dummy variable for
marital status (Married: 1 = married, 0 = otherwise), a dummy variable for head of
household (Head: 1 = yes, 0 = no) and a dummy variable for management position
(Manager: 1 = yes, 0 = no). We shall call this Model 1. The coefficient of partial
determination ( ) of each of the 6 predictors are, respectively,
0.2807, 0.0386, 0.0317, 0.0141, 0.0958, and 0.1201.
Model 2 is the regression analysis where the dependent variable is Unemploy and the
independent variables are Age and Manager. The results of the regression analysis are
given below:
Referring to Table 17-10, Model 1, which of the following is the correct null hypothesis
to test whether age has any effect on the number of weeks a worker is unemployed due
to a layoff while holding constant the effect of all the other independent variables?
A) H0 : β0 = 0

B) H0 : β1 = 0
C) H0 : β2 = 0
D) H0 : β3 = 0
Which descriptive summary measures are considered to be resistant statistics?
A) the arithmetic mean and standard deviation
B) the interquartile range and range
C) the mode and variance
D) the median and interquartile range
The collection and summarization of the socioeconomic and physical characteristics of
the employees of a particular firm is an example of
A) inferential statistics.
B) descriptive statistics.
C) operational definition.
D) DCOVA framework.
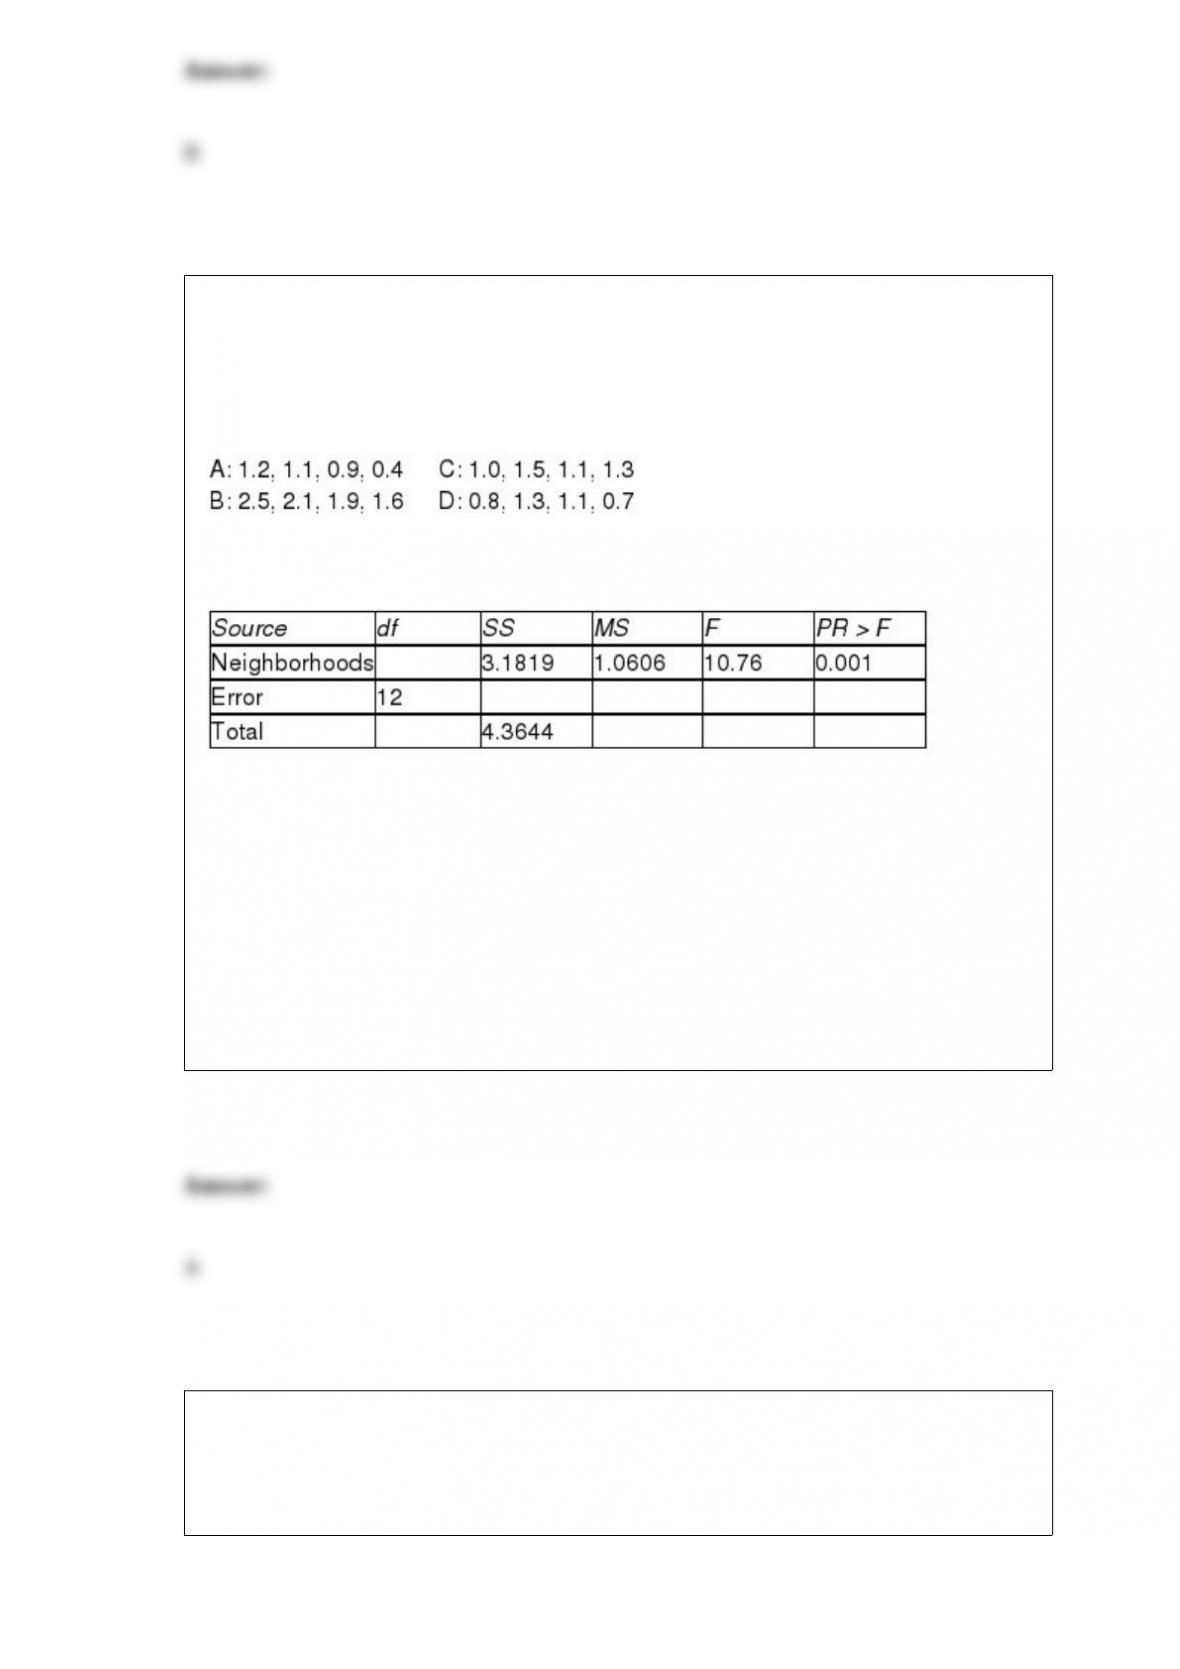
TABLE 11-2
A realtor wants to compare the mean sales-to-appraisal ratios of residential properties
sold in four neighborhoods (A, B, C, and D). Four properties are randomly selected
from each neighborhood and the ratios recorded for each, as shown below.
Interpret the results of the analysis summarized in the following table:
Referring to Table 11-2, the within group mean squares is
A) 0.0985.
B) 0.2910.
C) 1.0606.
D) 1.1825.
TABLE 2-5
The following are the duration in minutes of a sample of long-distance phone calls
made within the continental United States reported by one long-distance carrier.

Referring to Table 2-5, if 100 calls were randomly sampled, ________ of them would
have lasted at least 15 minutes but less than 20 minutes
A) 6
B) 8
C) 10
D) 16
TABLE 17-1
A real estate builder wishes to determine how house size (House) is influenced by
family income (Income), family size (Size), and education of the head of household
(School). House size is measured in hundreds of square feet, income is measured in
thousands of dollars, and education is in years. The builder randomly selected 50
families and ran the multiple regression. Microsoft Excel output is provided below:
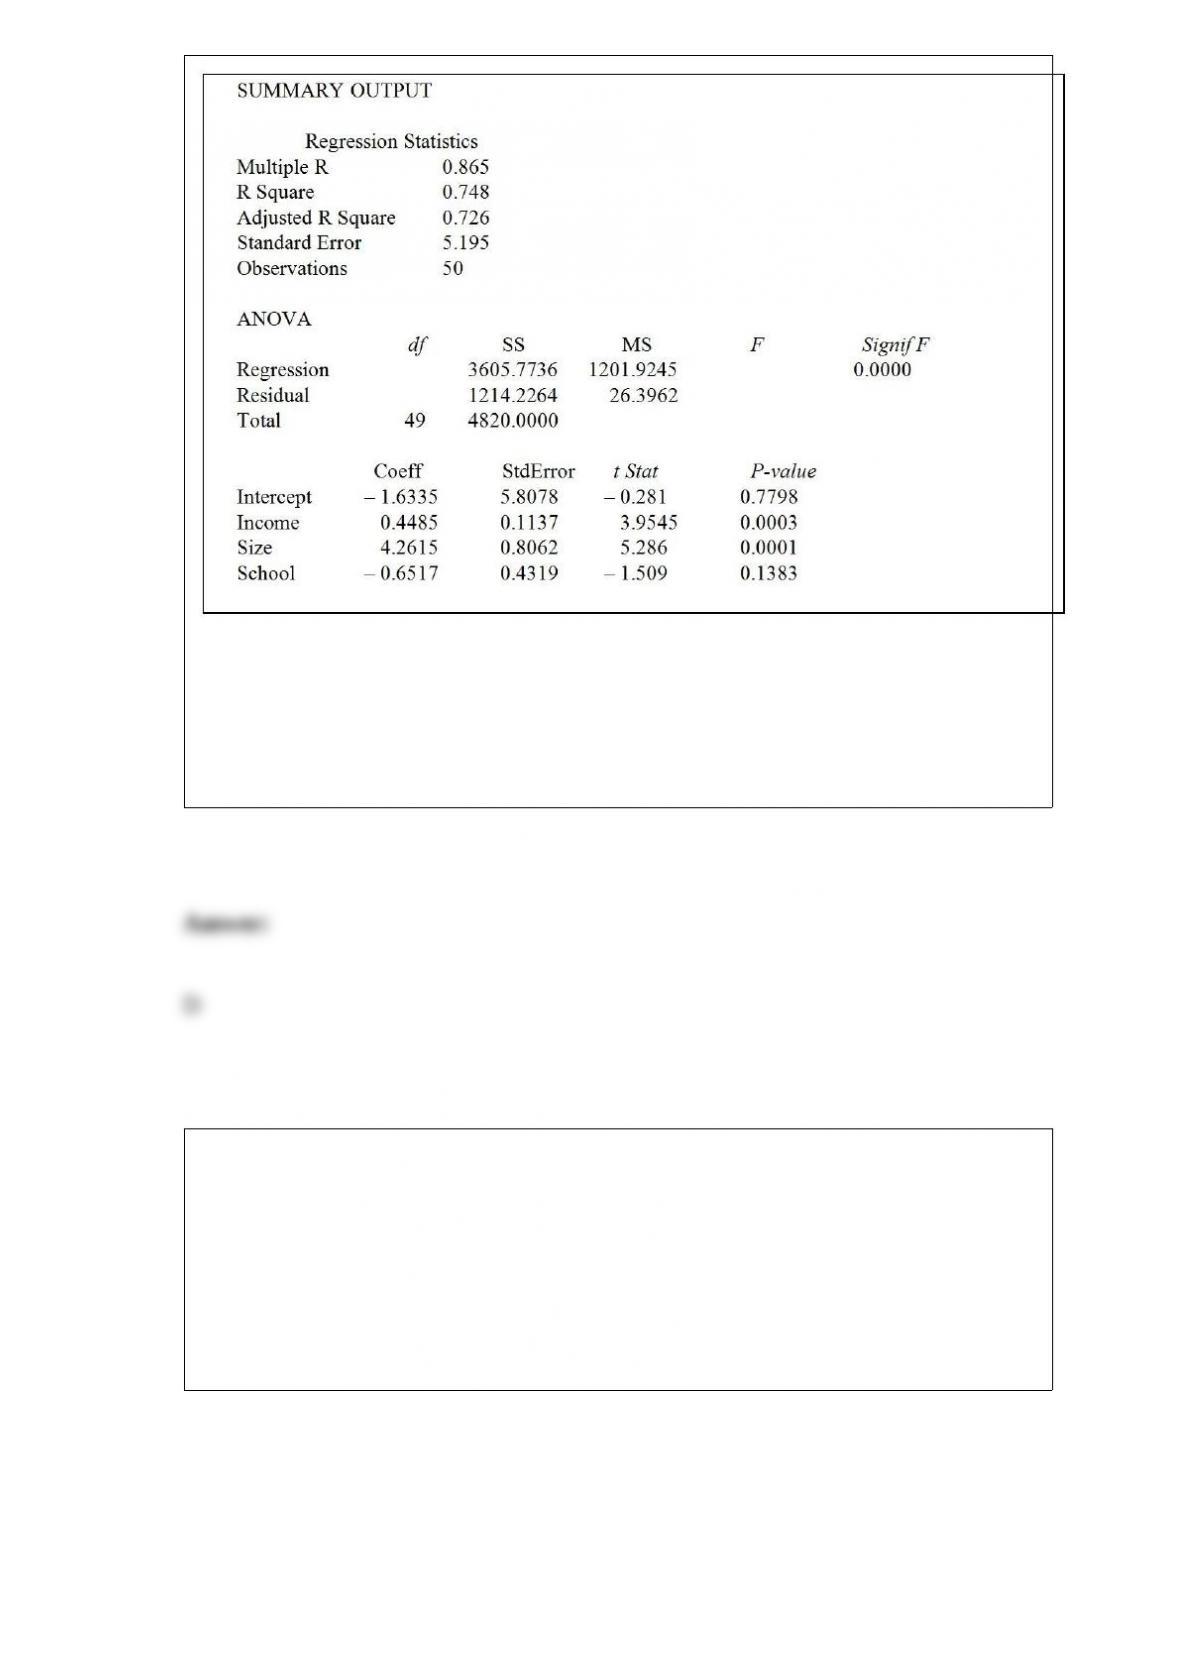
Referring to Table 17-1, what is the value of the calculated F test statistic that is
missing from the output for testing whether the whole regression model is significant?
A) 0.0001
B) 0.0299
C) 0.726
D) 45.5340
TABLE 13-9
It is believed that, the average numbers of hours spent studying per day (HOURS)
during undergraduate education should have a positive linear relationship with the
starting salary (SALARY, measured in thousands of dollars per month) after graduation.
Given below is the Excel output for predicting starting salary (Y) using number of hours
spent studying per day (X) for a sample of 51 students. NOTE: Only partial output is
shown.
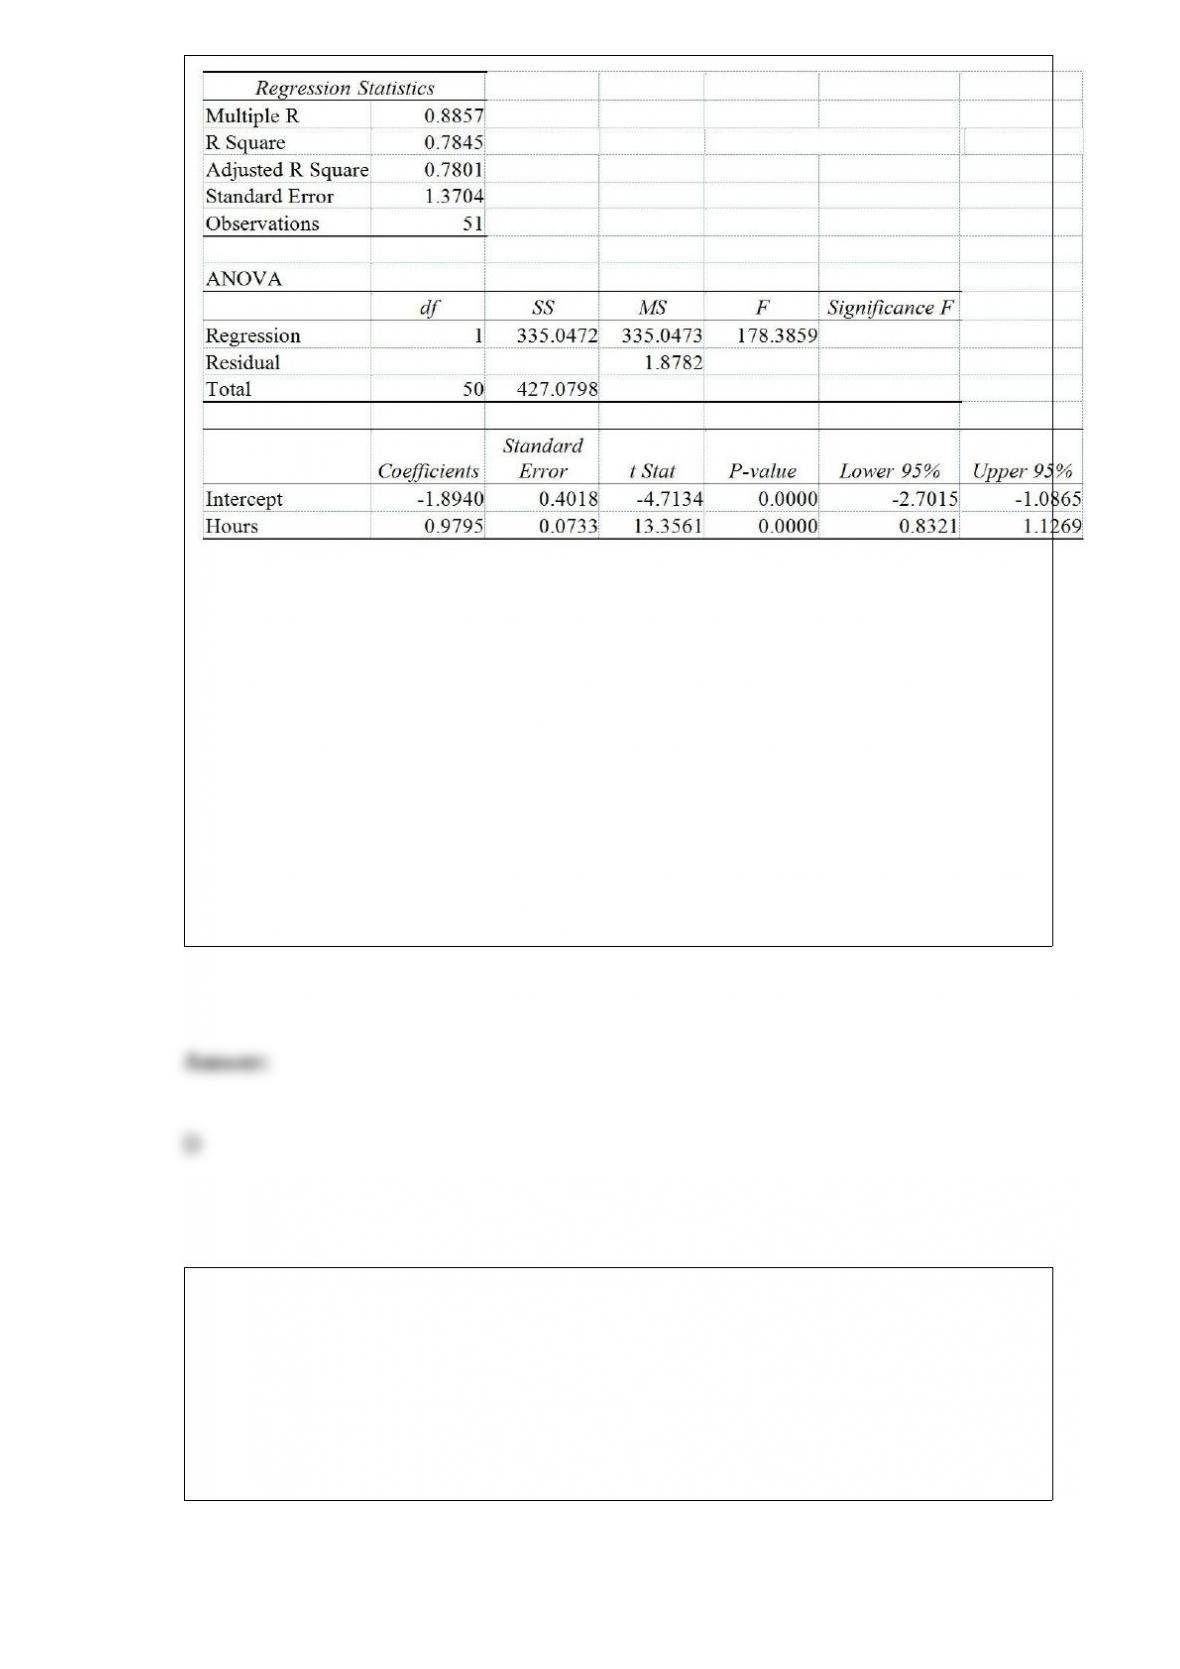
Note: 2.051E - 05 = 2.051 ∗ 10-05 and 5.944E - 18 = 5.944 ∗ 10-18.
Referring to Table 13-9, the value of the measured t test statistic to test whether mean
SALARY depends linearly on HOURS is
A) -4.7134.
B) -1.8940.
C) 0.9795.
D) 13.3561.
TABLE 13-4
The managers of a brokerage firm are interested in finding out if the number of new
clients a broker brings into the firm affects the sales generated by the broker. They
sample 12 brokers and determine the number of new clients they have enrolled in the
last year and their sales amounts in thousands of dollars. These data are presented in the
table that follows.
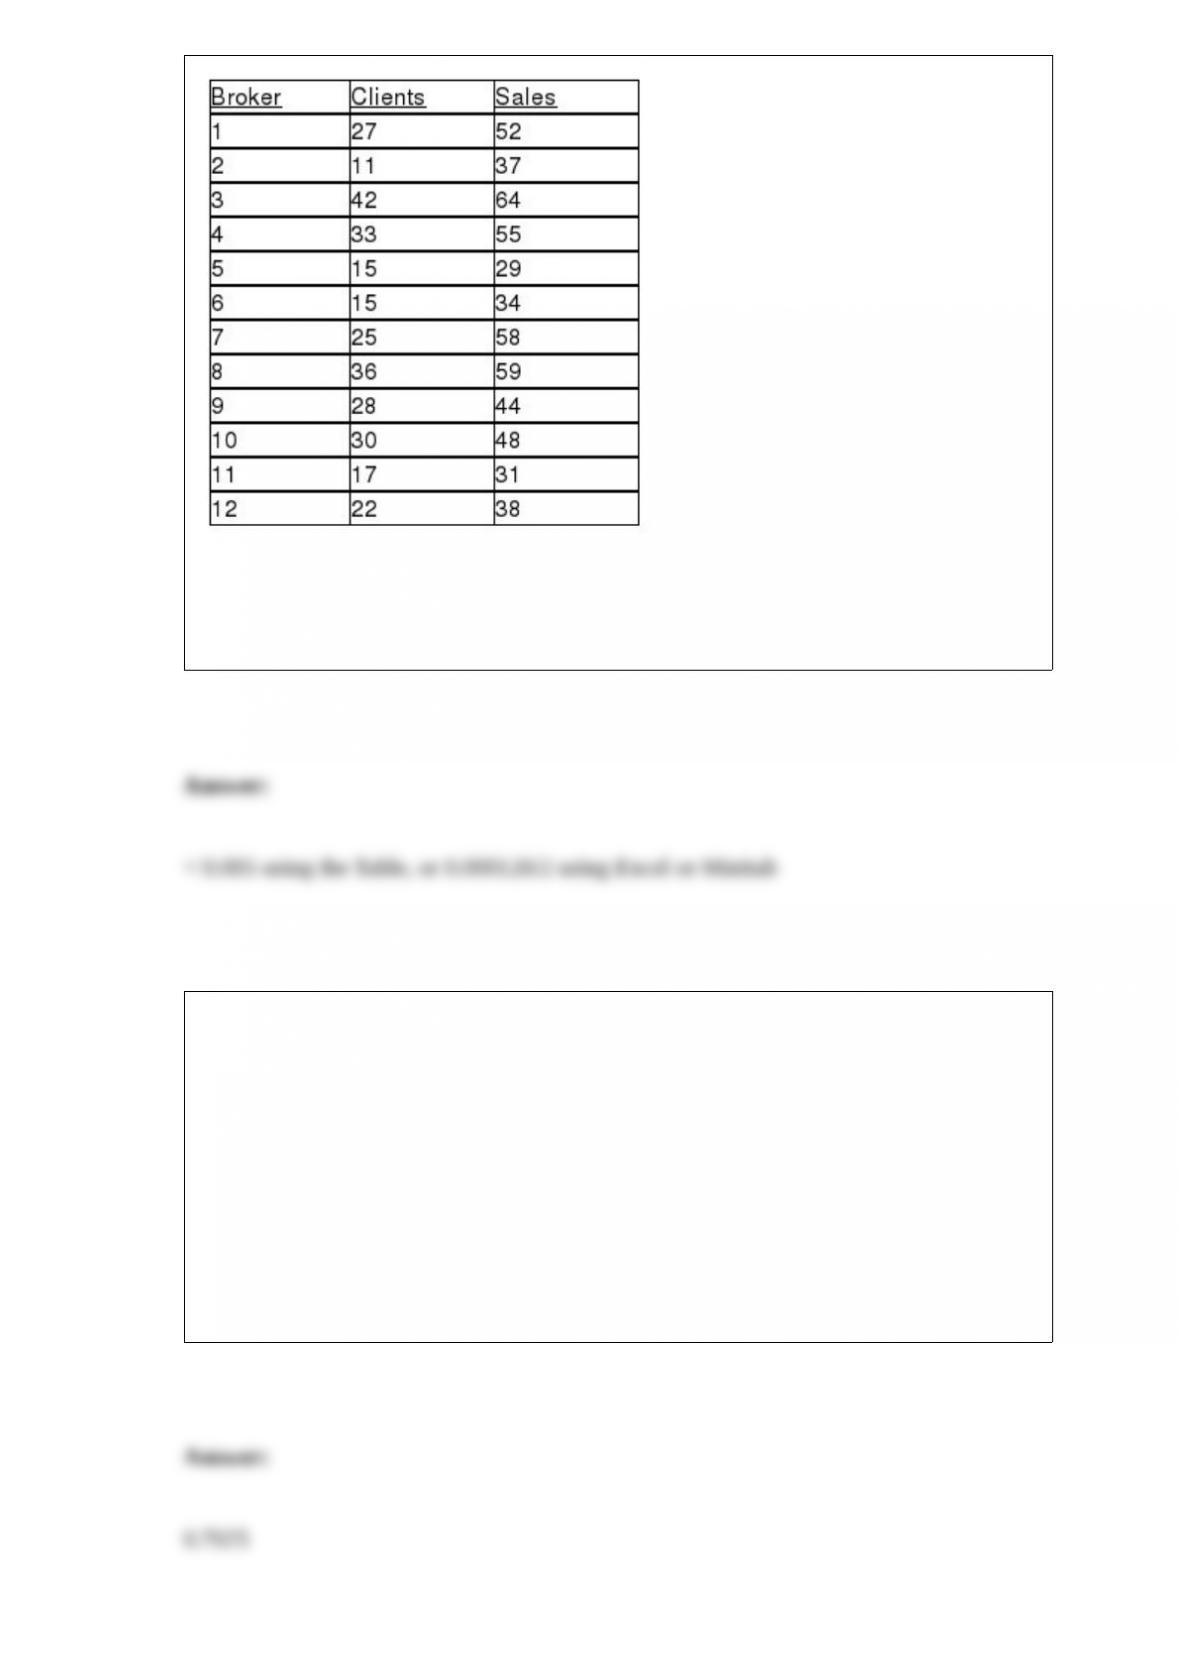
Referring to Table 13-4, the managers of the brokerage firm wanted to test the
hypothesis that the number of new clients brought in had a positive impact on the
amount of sales generated. The p-value of the test is ________.
TABLE 9-11
An appliance manufacturer claims to have developed a compact microwave oven that
consumes a population mean of no more than 250 W. From previous studies, it is
believed that power consumption for microwave ovens is normally distributed with a
population standard deviation of 15 W. If there is evidence that the population mean
consumption is greater than 250 W, the manufacturer will be unable to make the claim.
Referring to Table 9-11, if you select a sample of 20 compact microwave ovens and are
willing to have a level of significance of 0.05, the power of the test is ________ if the
mean power consumption of all such microwave ovens is in fact 257.3 W.
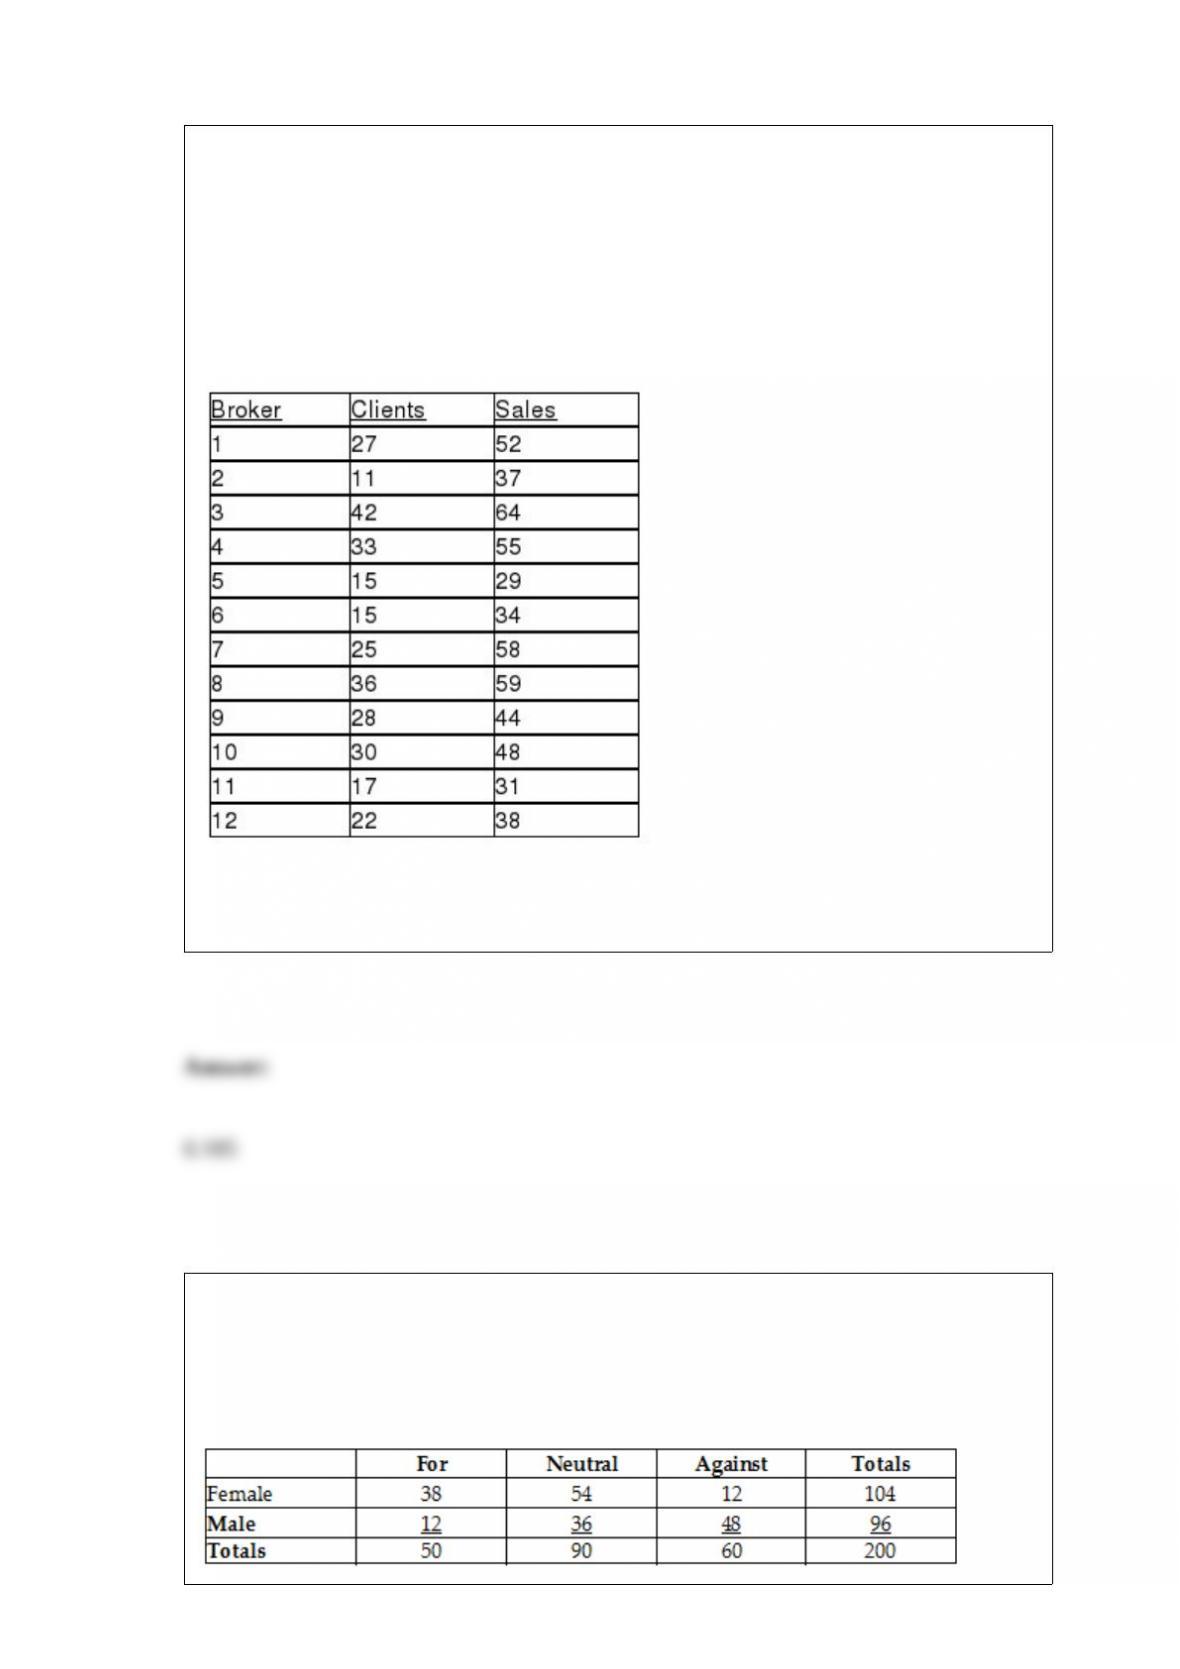
TABLE 13-4
The managers of a brokerage firm are interested in finding out if the number of new
clients a broker brings into the firm affects the sales generated by the broker. They
sample 12 brokers and determine the number of new clients they have enrolled in the
last year and their sales amounts in thousands of dollars. These data are presented in the
table that follows.
Referring to Table 13-4, the standard error of the estimated slope coefficient is
________.
TABLE 2-12
The table below contains the opinions of a sample of 200 people broken down by
gender about the latest congressional plan to eliminate anti-trust exemptions for
professional baseball.

Referring to Table 2-12, if the sample is a good representation of the population, we can
expect ________ percent of the males in the population will be against the plan.
TABLE 9-10
A manufacturer produces light bulbs that have a mean life of at least 500 hours when
the production process is working properly. Based on past experience, the population
standard deviation is 50 hours and the light bulb life is normally distributed. The
operations manager stops the production process if there is evidence that the population
mean light bulb life is below 500 hours.
Referring to Table 9-10, if you select a sample of 100 light bulbs and are willing to have
a level of significance of 0.05, the probability of the operations manager stopping the
process when the process is not working properly is ________ if the population mean
bulb life is 490 hours.
Referring to Table 14-4, the coefficient of partial determination is ________.
TABLE 14-4
A real estate builder wishes to determine how house size (House) is influenced by
family income (Income) and family size (Size). House size is measured in hundreds of
square feet and income is measured in thousands of dollars. The builder randomly
selected 50 families and ran the multiple regression. Partial Microsoft Excel output is
provided below:
Also SSR (X1∣ X2) = 36400.6326 and SSR (X2∣ X1) = 3297.7917
TABLE 17-9
What are the factors that determine the acceleration time (in sec.) from 0 to 60 miles per
hour of a car? Data on the following variables for 171 different vehicle models were
collected:
Accel Time: Acceleration time in sec.
Cargo Vol: Cargo volume in cu. ft.
HP: Horsepower
MPG: Miles per gallon
SUV: 1 if the vehicle model is an SUV with Coupe as the base when SUV and Sedan
are both 0
Sedan: 1 if the vehicle model is a sedan with Coupe as the base when SUV and Sedan
are both 0
The regression results using acceleration time as the dependent variable and the
remaining variables as the independent variables are presented below.
The various residual plots are as shown below.
The coefficient of partial determination ( ) of each of the 5
predictors are, respectively, 0.0380, 0.4376, 0.0248, 0.0188, and 0.0312.
The coefficient of multiple determination for the regression model using each of the 5
variables Xj as the dependent variable and all other X variables as independent variables
( ) are, respectively, 0.7461, 0.5676, 0.6764, 0.8582, 0.6632.
Referring to Table 17-9, ________ of the variation in Accel Time can be explained by
HP while controlling for the other independent variables.
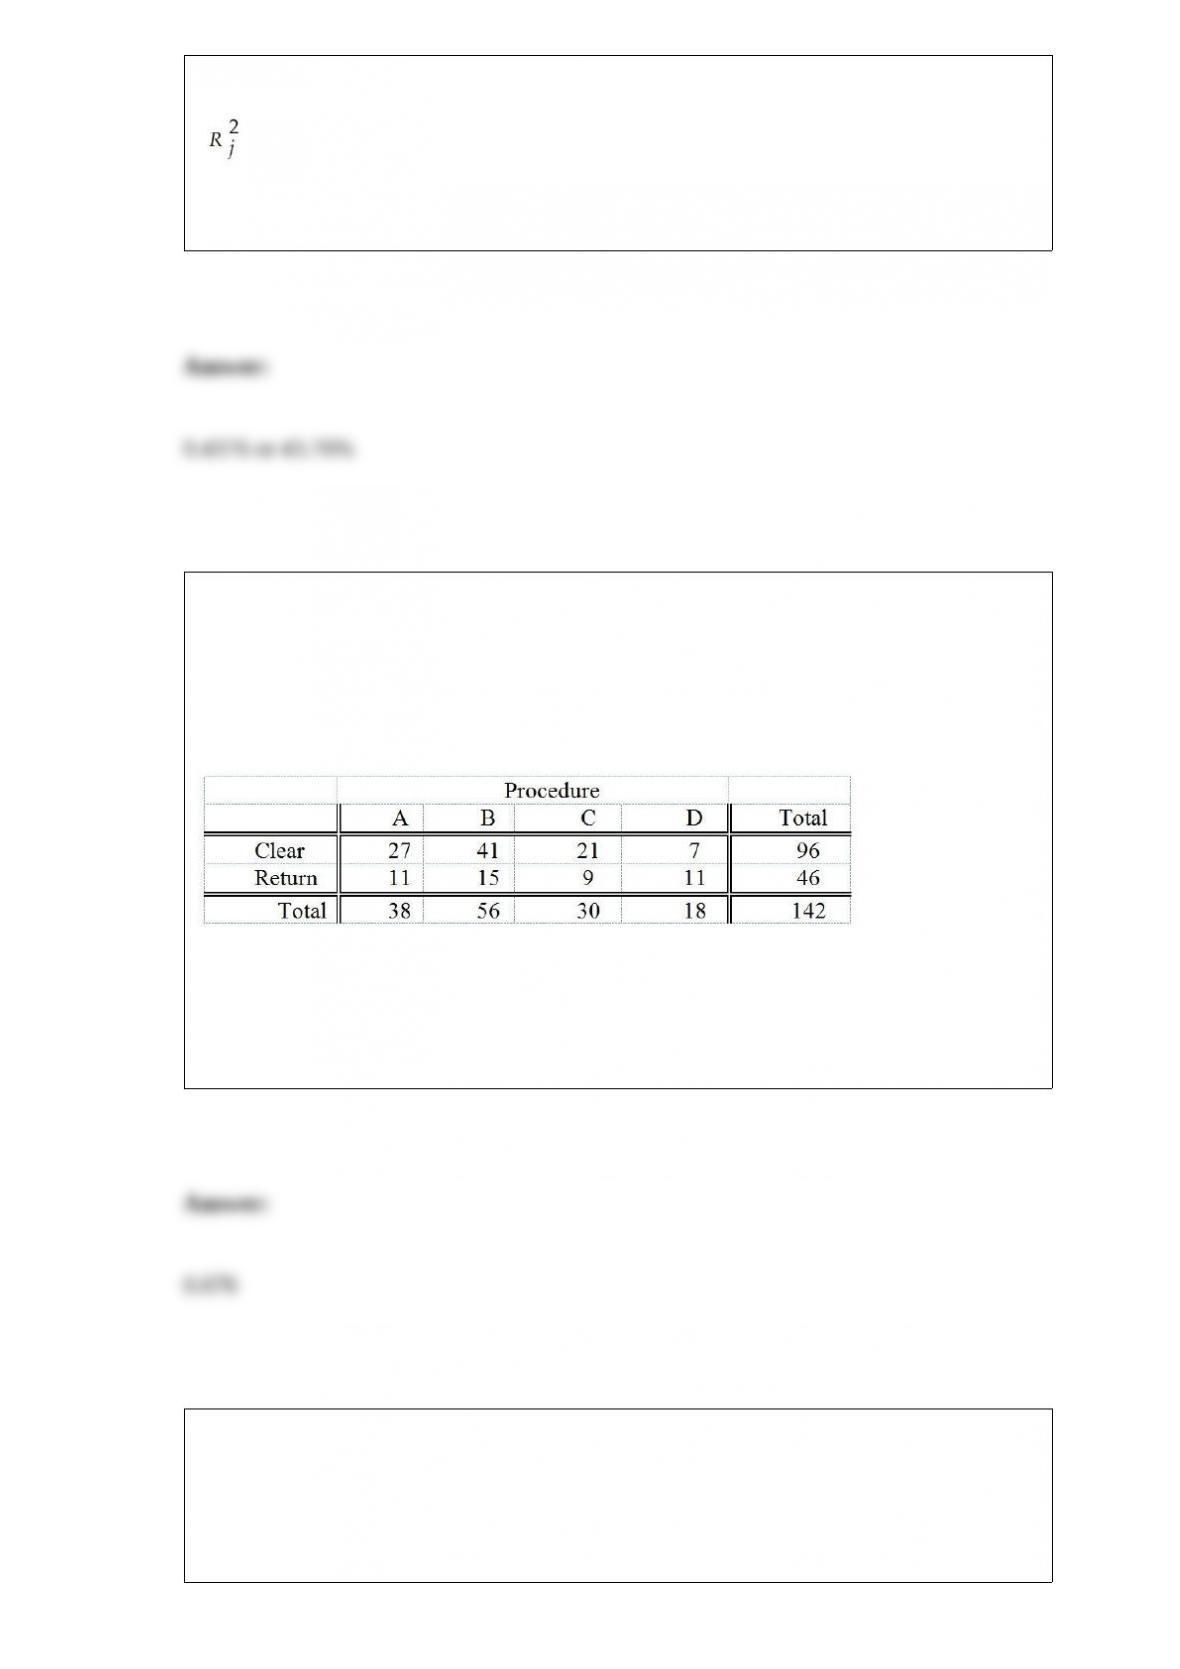
TABLE 12-5
Four surgical procedures currently are used to install pacemakers. If the patient does not
need to return for follow-up surgery, the operation is called a "clear" operation. A heart
center wants to compare the proportion of clear operations for the 4 procedures, and
collects the following numbers of patients from their own records:
They will use this information to test for a difference among the proportion of clear
operations using a chi-square test with a level of significance of 0.05.
Referring to Table 12-5, the overall or mean proportion of clear operations is ________.
TABLE 5-8
Two different designs on a new line of winter jackets for the coming winter are
available for your manufacturing plants. Your profit (in thousands of dollars) will
depend on the taste of the consumers when winter arrives. The probability of the three
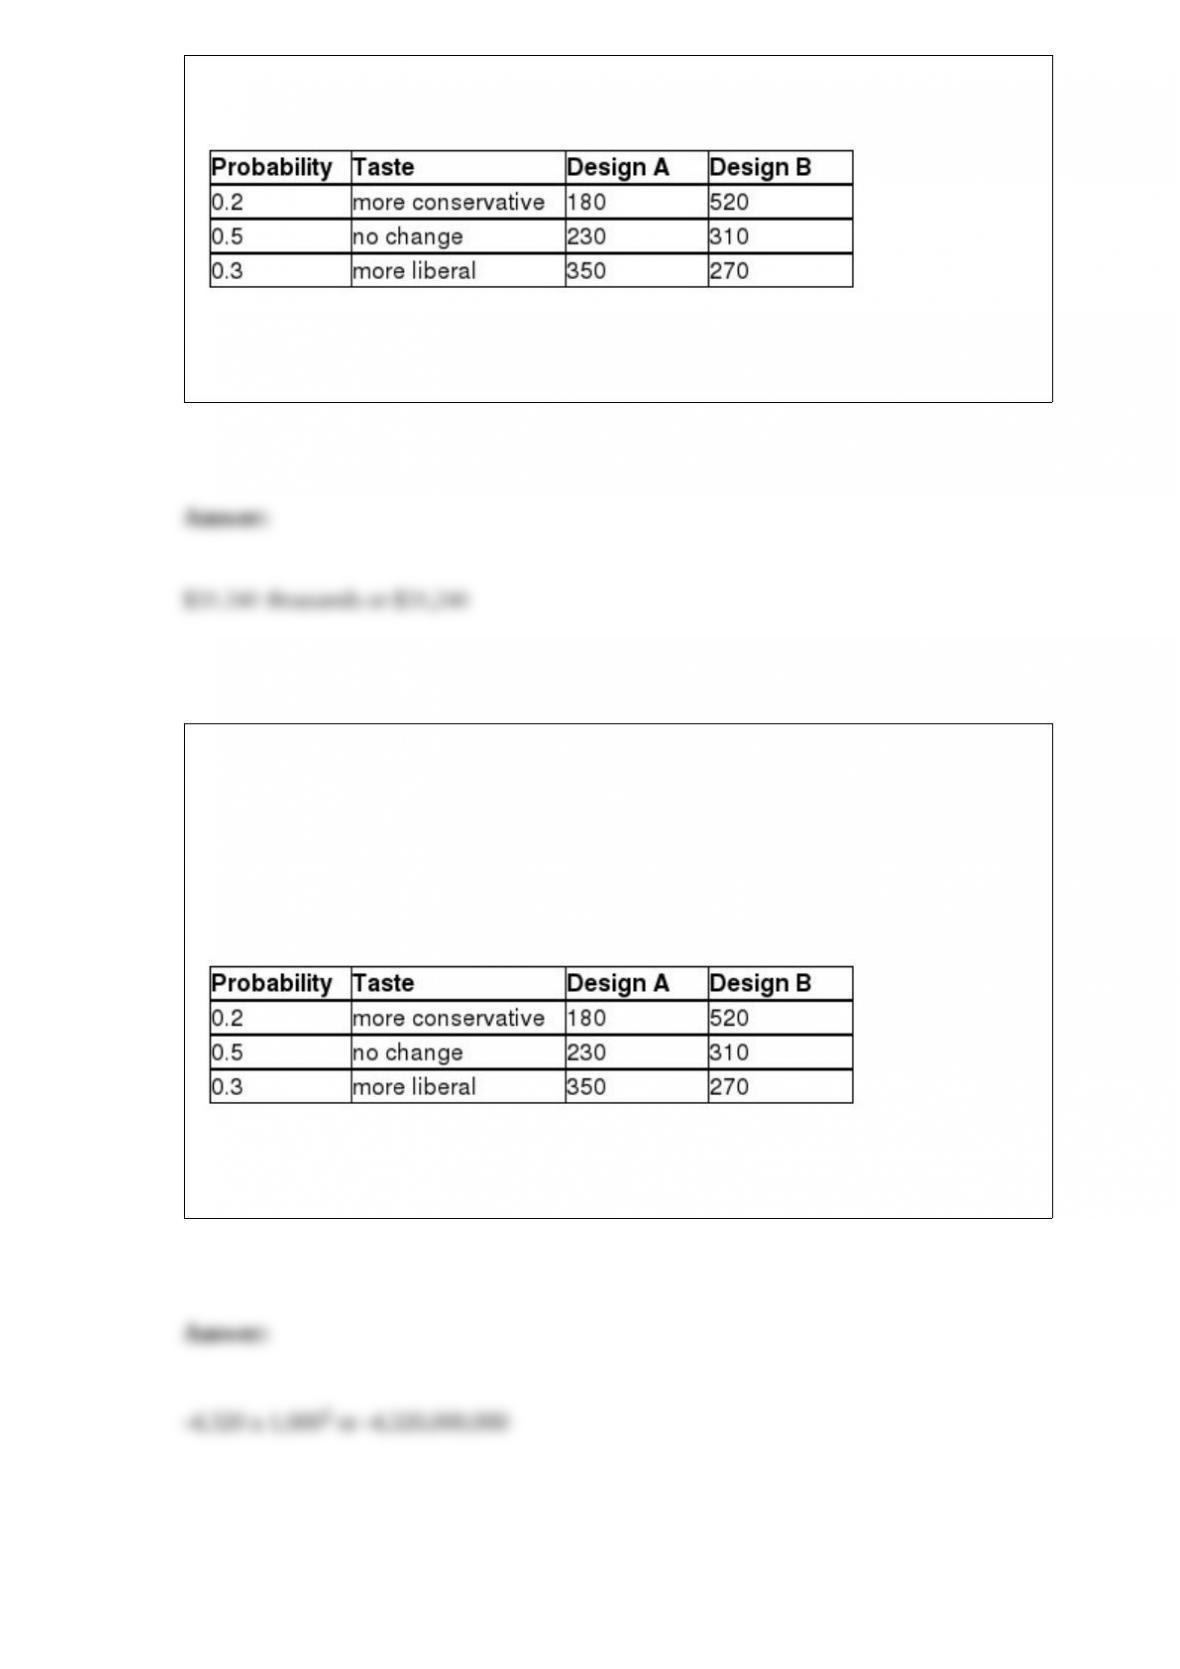
possible different tastes of the consumers and the corresponding profits are presented in
the following table.
Referring to Table 5-8, if you decide to choose Design A for half of the production lines
and Design B for the other half, what is the risk of your investment?
TABLE 5-8
Two different designs on a new line of winter jackets for the coming winter are
available for your manufacturing plants. Your profit (in thousands of dollars) will
depend on the taste of the consumers when winter arrives. The probability of the three
possible different tastes of the consumers and the corresponding profits are presented in
the following table.
Referring to Table 5-8, what is the covariance of the profits from the two different
designs?


