
TABLE 8-7
A hotel chain wants to estimate the mean number of rooms rented daily in a given
month. The population of rooms rented daily is assumed to be normally distributed for
each month with a standard deviation of 240 rooms. During February, a sample of 25
days has a sample mean of 370 rooms.
True or False: Referring to Table 8-7, we are 99% confident that the average number of
rooms rented daily in a given month is somewhere between 246.36 and 493.64.
True or False: For a given level of significance, if the sample size is increased but the
summary statistics remain the same, the probability of committing a Type I error will
increase.
True or False: TABLE 17-9
What are the factors that determine the acceleration time (in sec.) from 0 to 60 miles per
hour of a car? Data on the following variables for 171 different vehicle models were
collected:
Accel Time: Acceleration time in sec.
Cargo Vol: Cargo volume in cu. ft.
HP: Horsepower
MPG: Miles per gallon
SUV: 1 if the vehicle model is an SUV with Coupe as the base when SUV and Sedan
are both 0
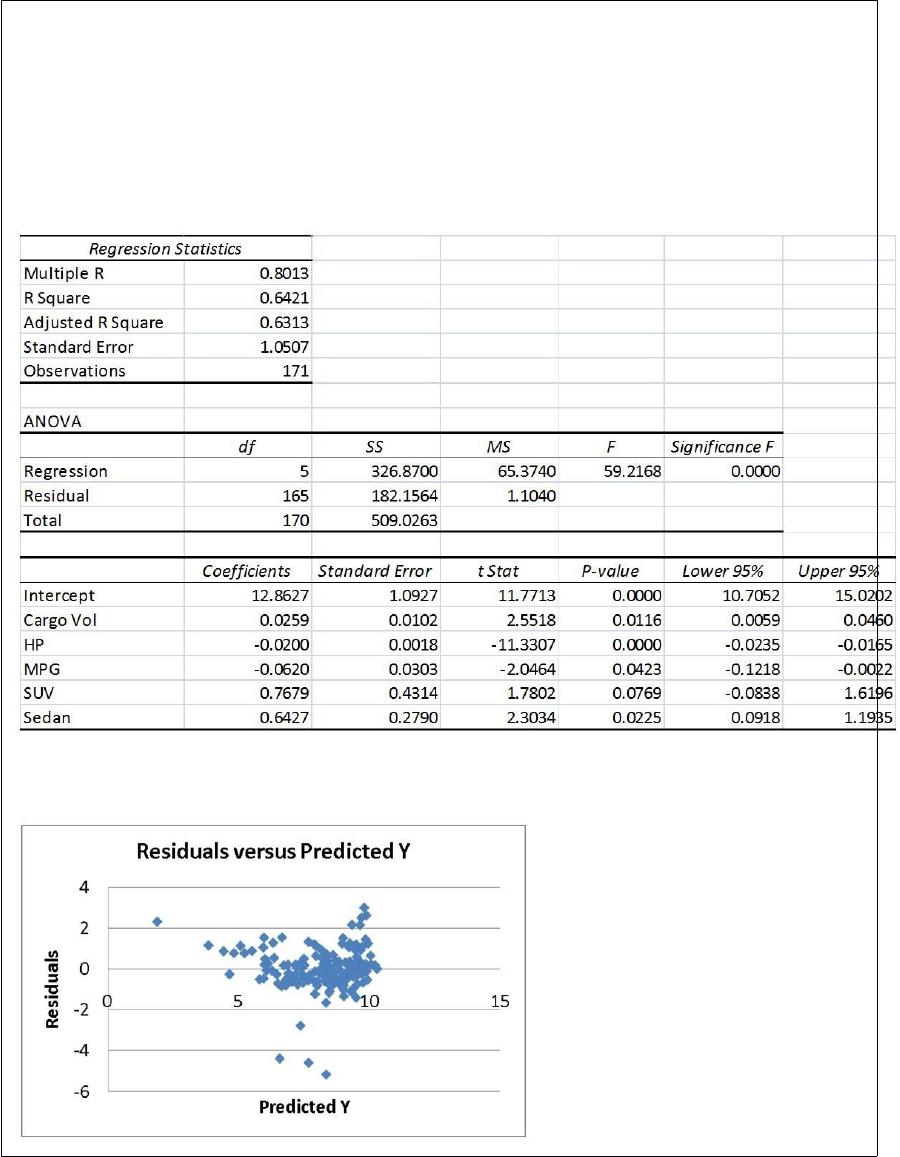
Sedan: 1 if the vehicle model is a sedan with Coupe as the base when SUV and Sedan
are both 0
The regression results using acceleration time as the dependent variable and the
remaining variables as the independent variables are presented below.
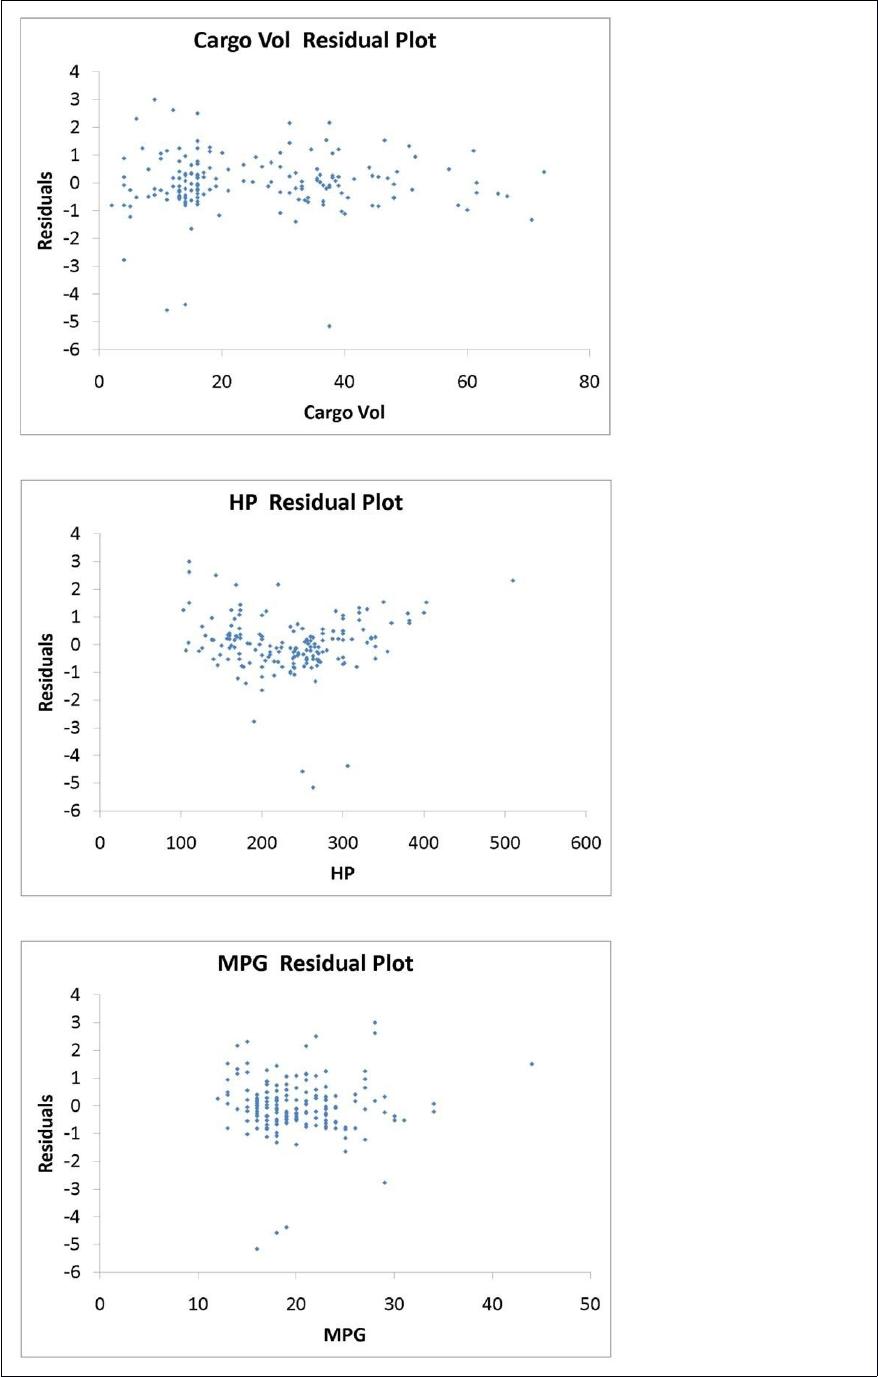
The various residual plots are as shown below.
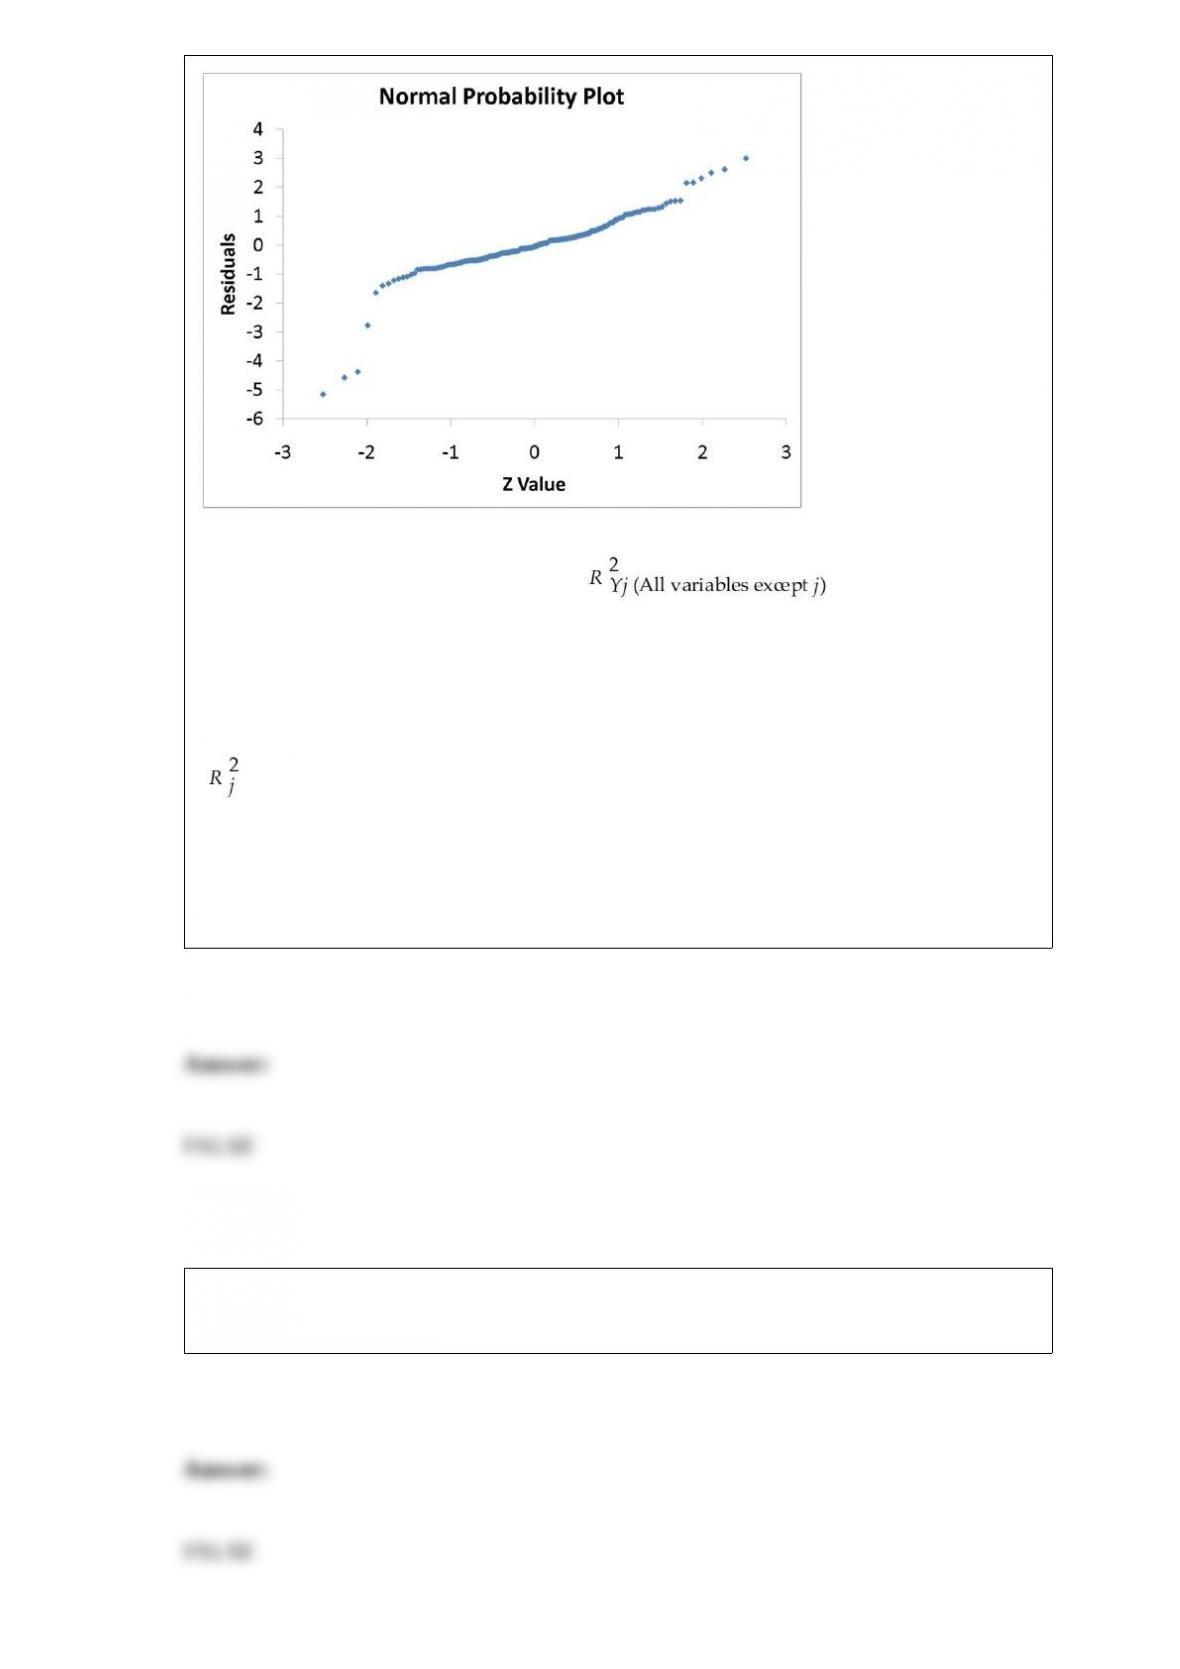
The coefficient of partial determination ( ) of each of the 5
predictors are, respectively, 0.0380, 0.4376, 0.0248, 0.0188, and 0.0312.
The coefficient of multiple determination for the regression model using each of the 5
variables Xj as the dependent variable and all other X variables as independent variables
( ) are, respectively, 0.7461, 0.5676, 0.6764, 0.8582, 0.6632.
Referring to Table 17-9, there is enough evidence to conclude that SUV makes a
significant contribution to the regression model in the presence of the other independent
variables at a 5% level of significance.
True or False: The answer to the question “What is your sleeping bag temperature
rating?” is an example of a ratio scaled variable.
True or False: Double-clicking a cell in a PivotTable causes Excel to drill down and
display the underlying data in a new worksheet.
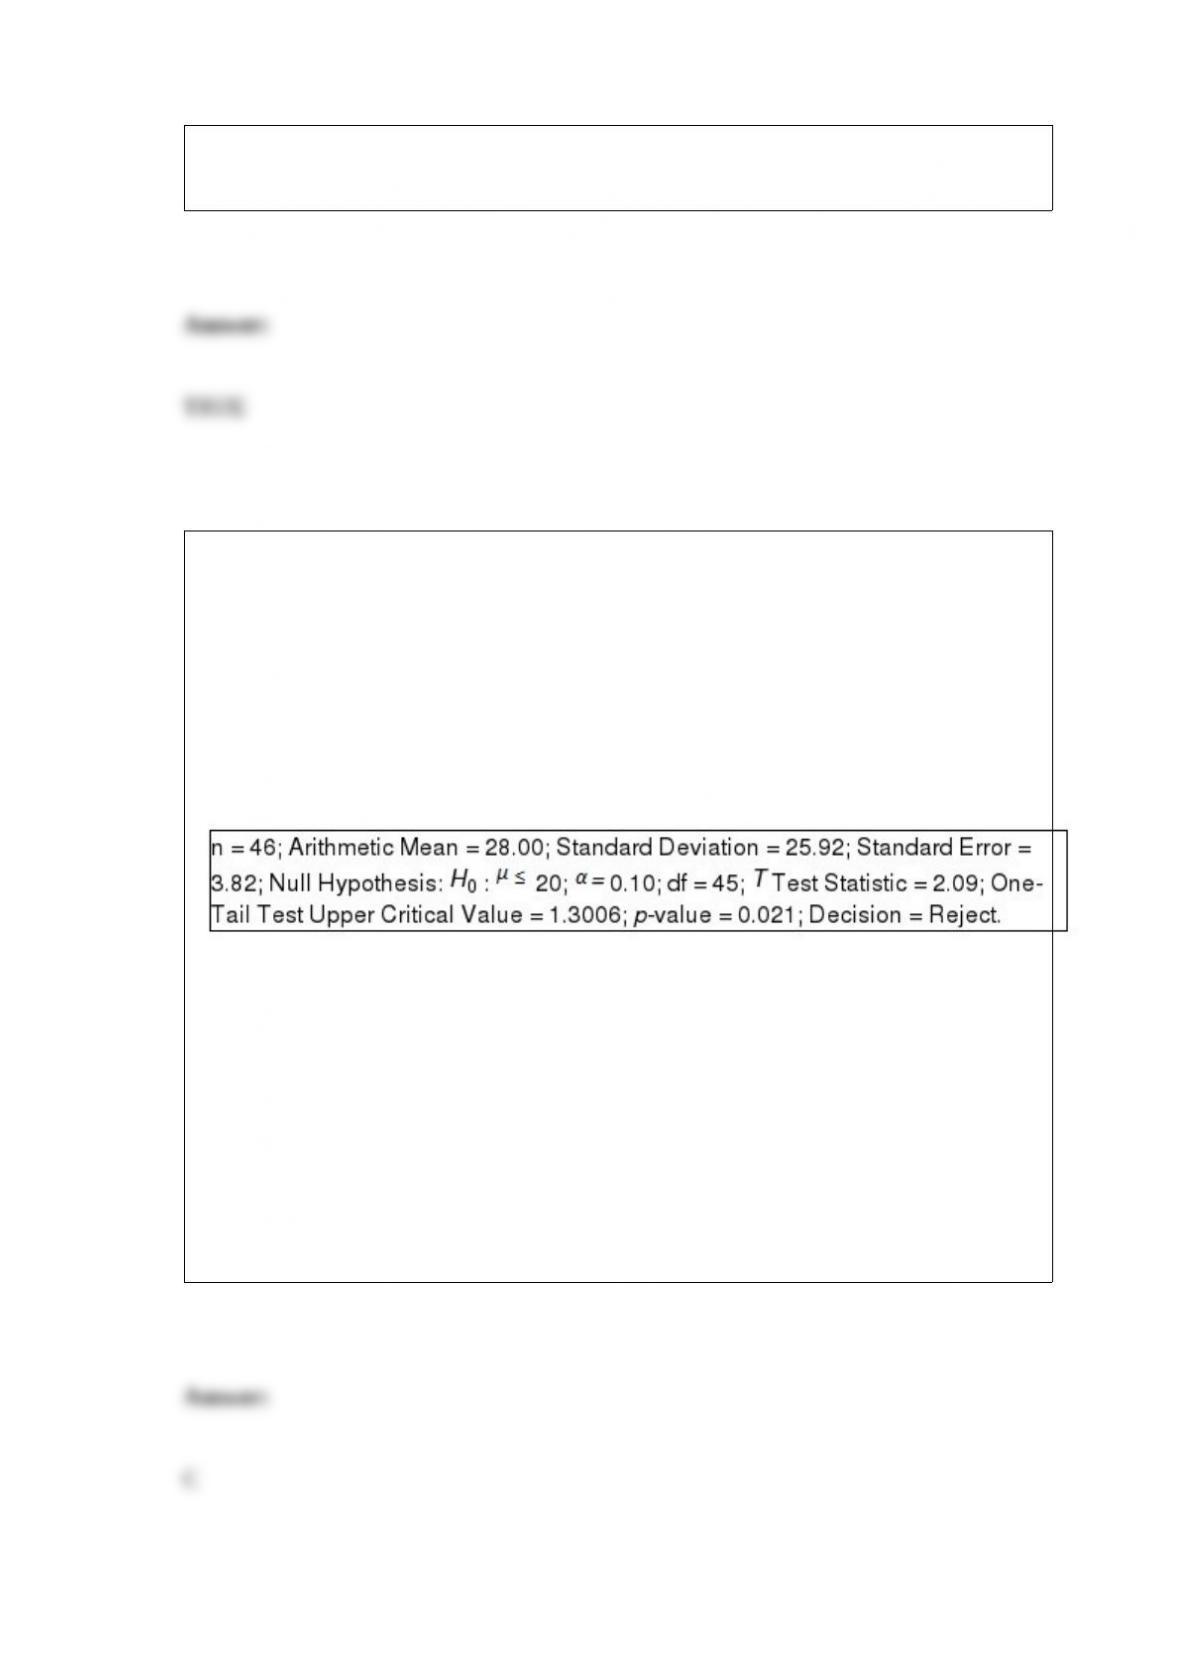
TABLE 9-1
Microsoft Excel was used on a set of data involving the number of defective items
found in a random sample of 46 cases of light bulbs produced during a morning shift at
a plant. A manager wants to know if the mean number of defective bulbs per case is
greater than 20 during the morning shift. She will make her decision using a test with a
level of significance of 0.10. The following information was extracted from the
Microsoft Excel output for the sample of 46 cases:
Referring to Table 9-1, the parameter the manager is interested in is
A) the mean number of defective light bulbs per case produced at the plant.
B) the mean number of defective light bulbs per case among the 46 cases.
C) the mean number of defective light bulbs per case produced during the morning
shift.
D) the proportion of cases with defective light bulbs produced at the plant.
Researchers are concerned that the weight of the average American school child is
increasing implying, among other things, that children’s clothing should be
manufactured and marketed in larger sizes. If X is the weight of school children
sampled in a nationwide study, then X is an example of
A) a categorical variable.
B) a discrete variable.
C) a continuous variable.
D) a table of random numbers.
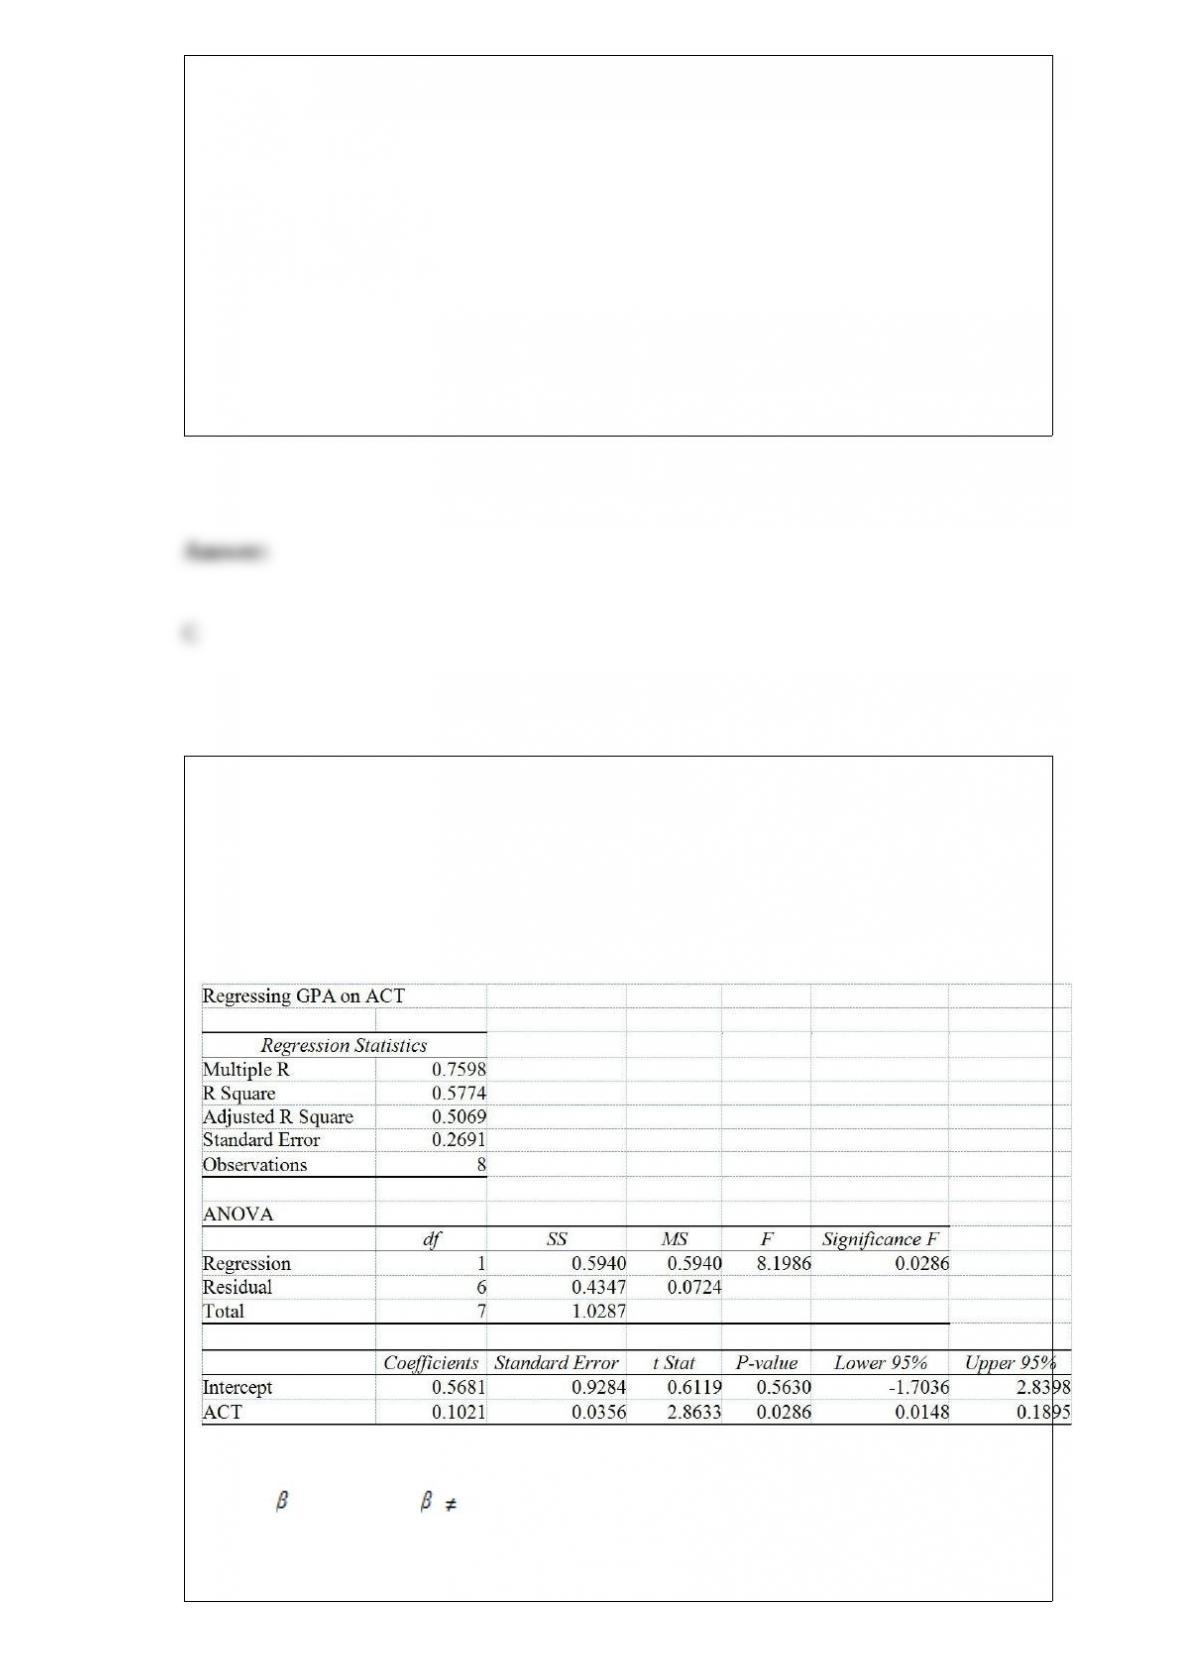
TABLE 13-8
It is believed that GPA (grade point average, based on a four point scale) should have a
positive linear relationship with ACT scores. Given below is the Excel output for
predicting GPA using ACT scores based on a data set of 8 randomly chosen students
from a Big-Ten university.
Referring to Table 13-8, the value of the measured (observed) test statistic of the F test
for H0 : 1 = 0 vs. H1 : 1 0
A) may be negative.

B) is always positive.
C) is always negative.
D) has the same sign as the corresponding t test statistic.
A quality control engineer is in charge of the manufacture of computer disks. Two
different processes can be used to manufacture the disks. He suspects that the Kohler
method produces a greater proportion of defects than the Russell method. He samples
150 of the Kohler and 200 of the Russell disks and finds that 27 and 18 of them,
respectively, are defective. If Kohler is designated as “Group 1” and Russell is
designated as “Group 2,” which of the following tests will you use to find out if the
Kohler method is worse than the Russell method?
A) Paired t test
B) Z test for difference in proportions
C) χ2 test for difference in proportions
D) McNemar test
If two events are collectively exhaustive, what is the probability that both occur at the
same time?
A) 0
B) 0.50
C) 1.00
D) Cannot be determined from the information given.

The probability that a new advertising campaign will increase sales is assessed as being
0.80. The probability that the cost of developing the new ad campaign can be kept
within the original budget allocation is 0.40. Assuming that the two events are
independent, the probability that neither the cost is kept within budget nor the campaign
will increase sales is
A) 0.12.
B) 0.32.
C) 0.68.
D) 0.88.
TABLE 11-3
As part of an evaluation program, a sporting goods retailer wanted to compare the
downhill coasting speeds of 4 brands of bicycles. She took 3 of each brand and
determined their maximum downhill speeds. The results are presented in miles per hour
in the table below.
Referring to Table 11-3, what should be the decision for the Levene’s test for
homogeneity of variances at a 5% level of significance?
A) Reject the null hypothesis because the p-value is smaller than the level of

significance.
B) Reject the null hypothesis because the p-value is larger than the level of significance.
C) Do not reject the null hypothesis because the p-value is smaller than the level of
significance.
D) Do not reject the null hypothesis because the p-value is larger than the level of
significance.
It was believed that the probability of being hit by lightning is the same during the
course of a thunderstorm. Which of the following distributions would you use to
determine the probability of being hit by lightning during the first half of a
thunderstorm?
A) Normal distribution
B) Poisson distribution
C) Uniform distribution
D) Exponential distribution
TABLE 4-1
Mothers Against Drunk Driving is a very visible group whose main focus is to educate
the public about the harm caused by drunk drivers. A study was recently done that
emphasized the problem we all face with drinking and driving. Four hundred accidents
that occurred on a Saturday night were analyzed. Two items noted were the number of
vehicles involved and whether alcohol played a role in the accident. The numbers are

shown below:
Referring to Table 4-1, what proportion of accidents involved more than one vehicle?
A) 50/400 or 12.5%
B) 75/400 or 18.75%
C) 275/400 or 68.75%
D) 325/400 or 81.25%
A few years ago, Pepsi invited consumers to take the “Pepsi Challenge.” Consumers
were asked to decide which of two sodas, Coke or Pepsi, they preferred in a blind taste
test. Pepsi was interested in determining what factors played a role in people’s taste
preferences. One of the factors studied was the gender of the consumer. Data on the
percentage of men and women depicting preference for Pepsi were collected. Which of
the following tests will you use to find out if there is any difference in preference
between the different gender groups?
A) McNemar test
B) Paired t test
C) Z test for difference in proportions
D) Wilcoxon rank sum test
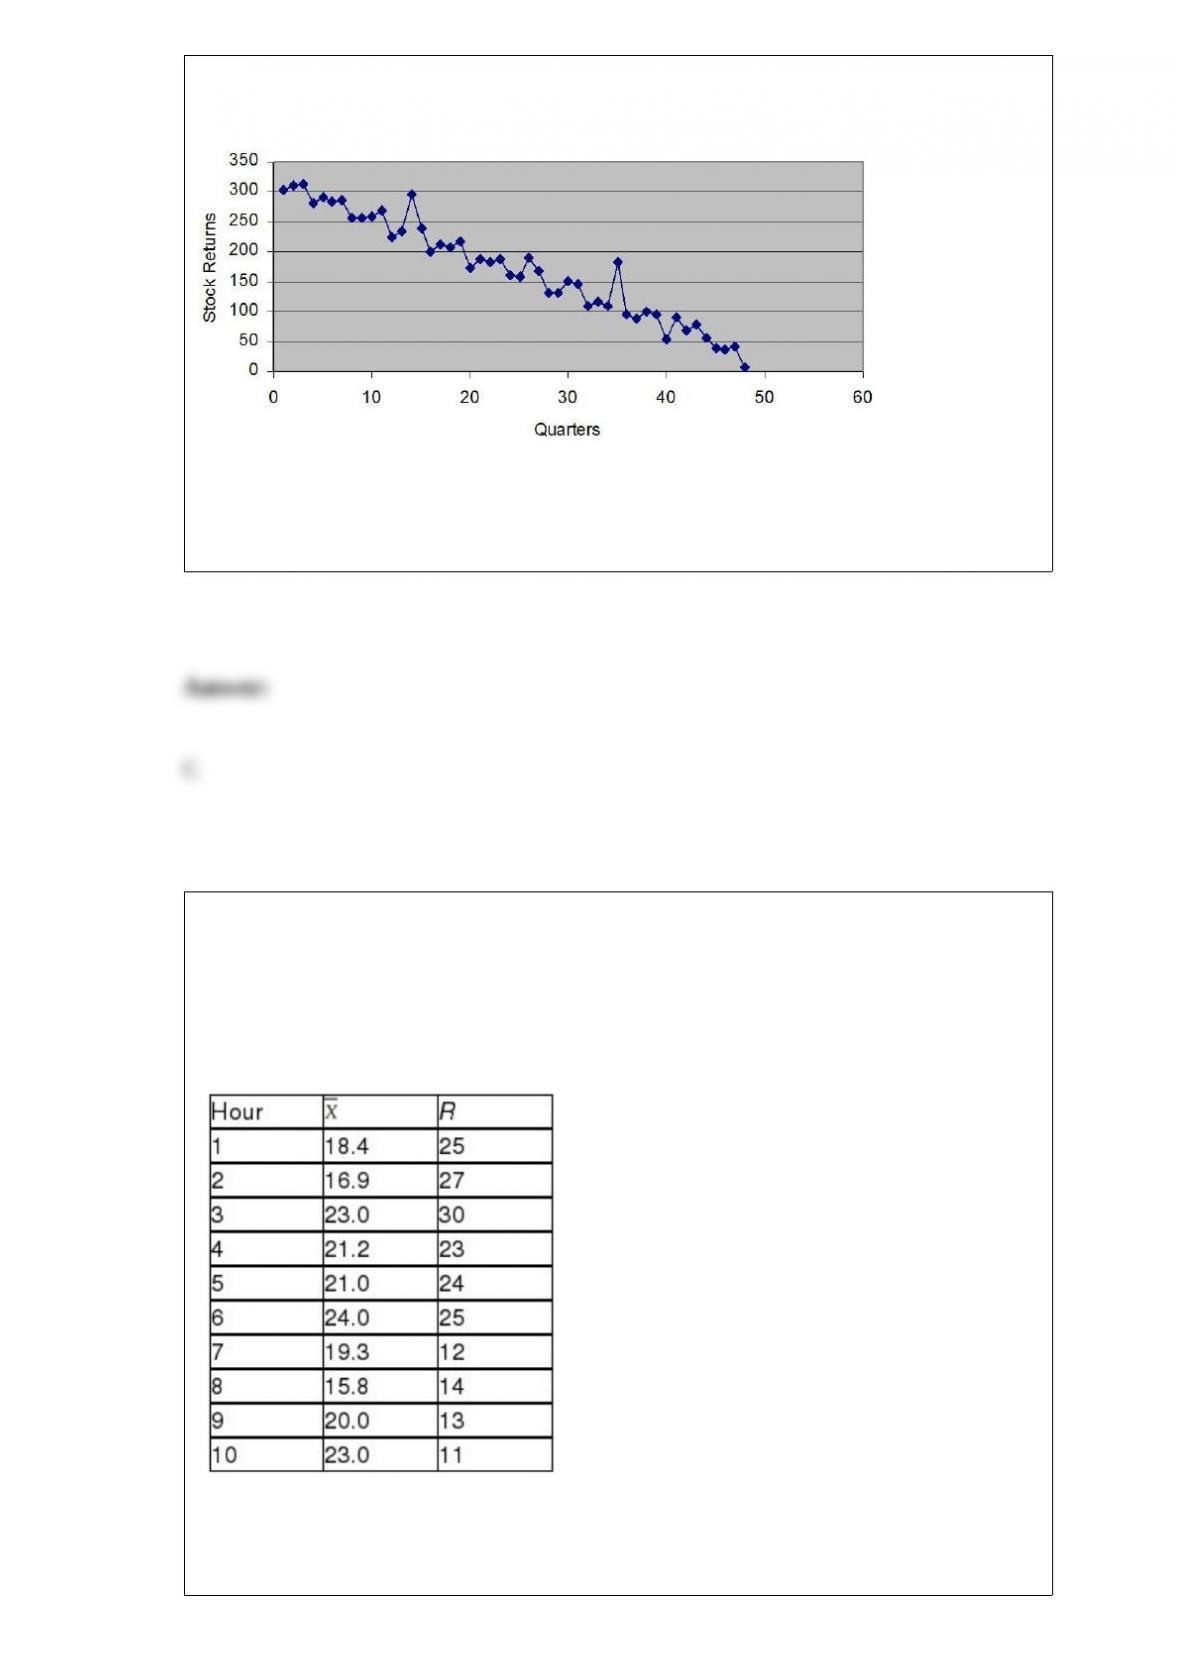
Based on the following scatter plot, which of the time-series components is not present
in this quarterly time series?
A) trend
B) seasonal
C) cyclical
D) irregular
TABLE 18-4
A factory supervisor is concerned that the time it takes workers to complete an
important production task (measured in seconds) is too erratic and adversely affects
expected profits. The supervisor proceeds by randomly sampling 5 individuals per hour
for a period of 10 hours. The sample mean and range for each hour are listed below.
She also decides that lower and upper specification limit for the critical-to-quality
variable should be 10 and 30 seconds, respectively.
Referring to Table 18-4, what is the value of the Cp index?
At a computer manufacturing company, the actual size of computer chips is normally
distributed with a mean of 1 centimeter and a standard deviation of 0.1 centimeter. A
random sample of 12 computer chips is taken. What is the probability that the sample
mean will be below 0.95 centimeters?
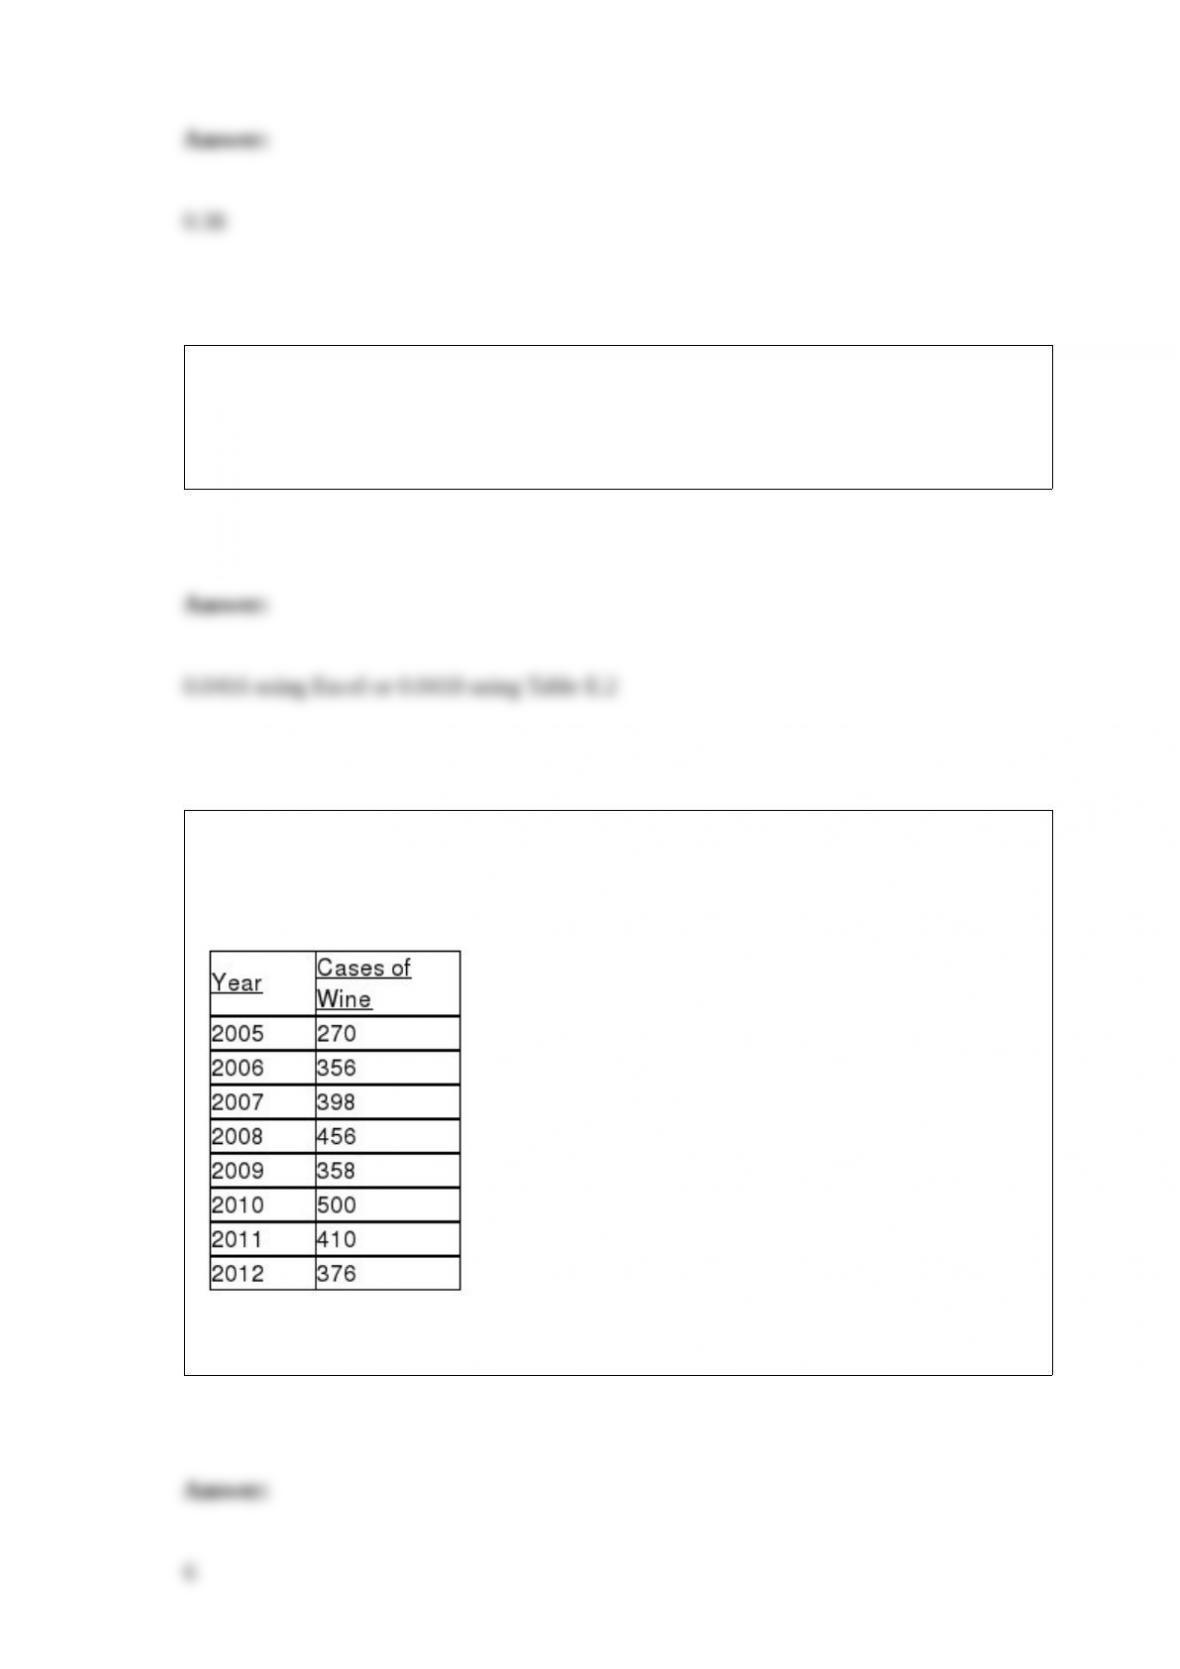
TABLE 16-4
The number of cases of merlot wine sold by a Paso Robles winery in an 8-year period
follows.
Referring to Table 16-4, a centered 3-year moving average is to be constructed for the
wine sales. The result of this process will lead to a total of ________ moving averages.
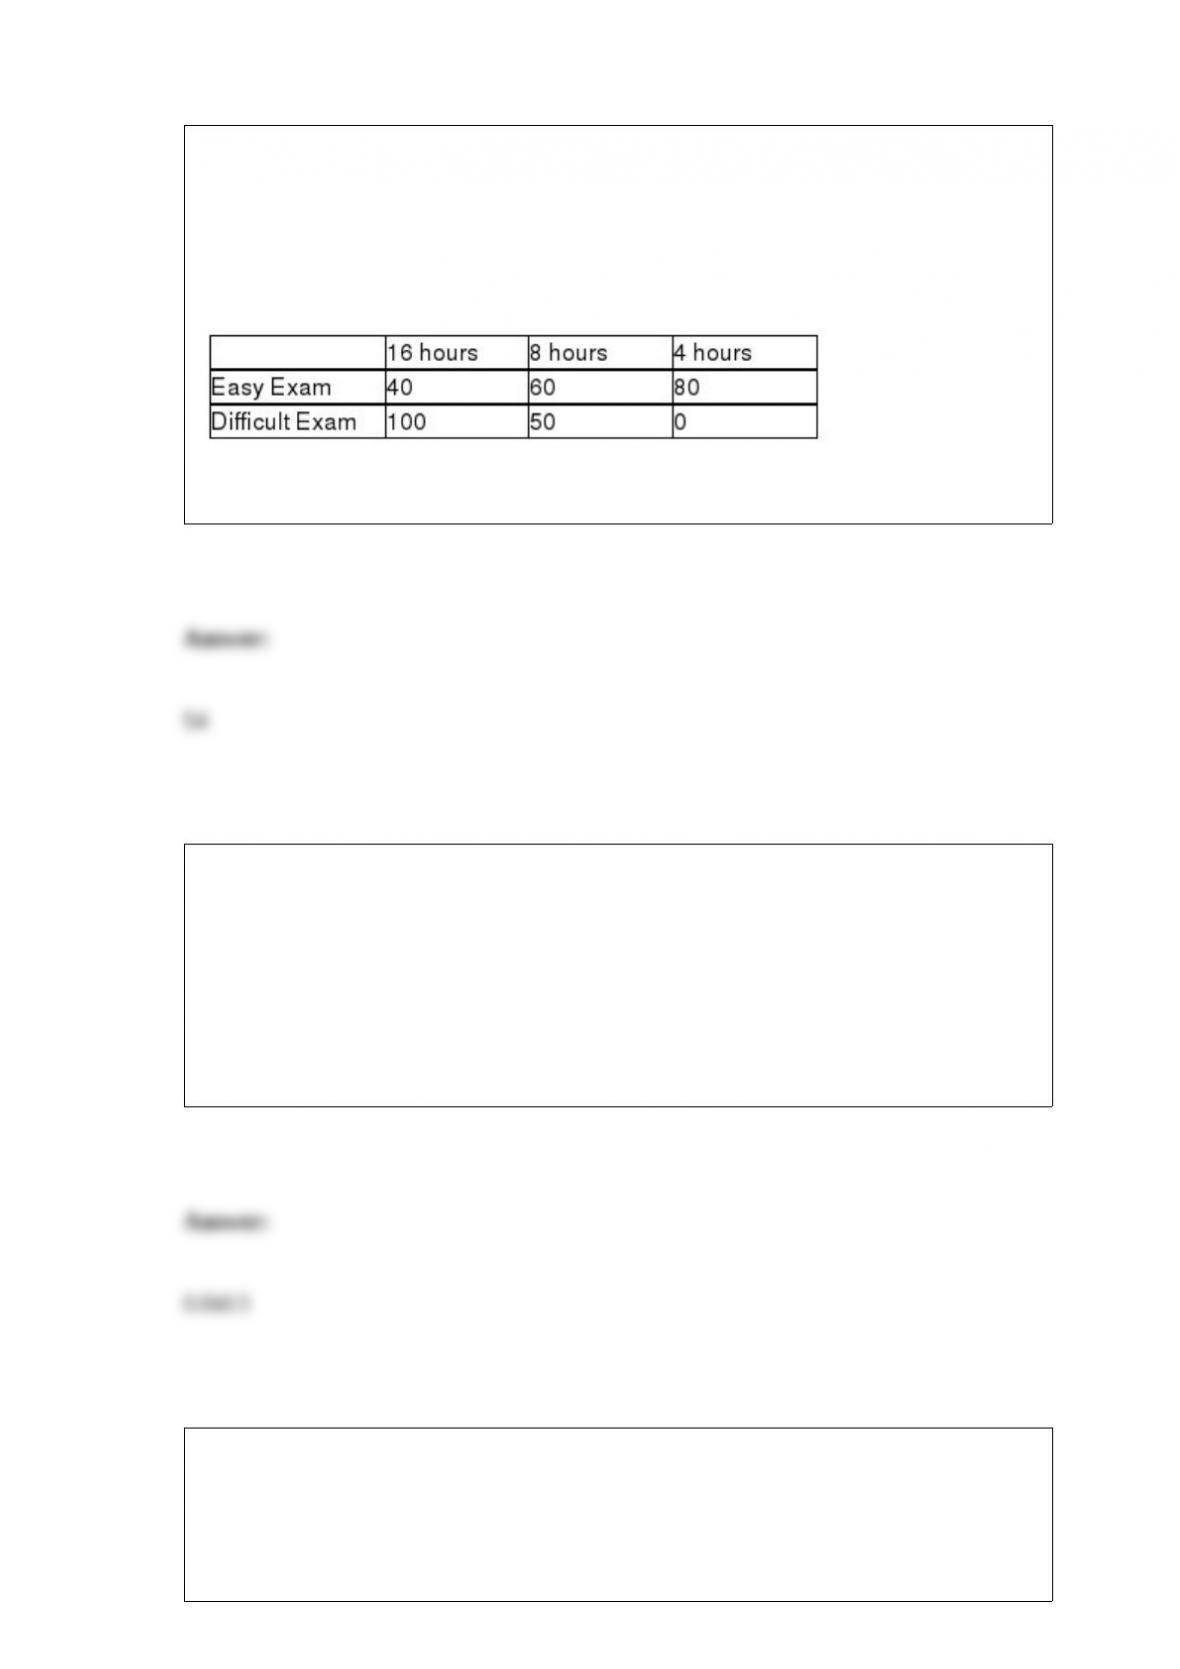
TABLE 19-6
A student wanted to find out the optimal strategy to study for a Business Statistics
exam. He constructed the following payoff table based on the mean amount of time he
needed to study every week for the course and the degree of difficulty of the exam.
From the information that he gathered from students who had taken the course, he
concluded that there was a 40% probability that the exam would be easy.
Referring to Table 19-6, what is the expected monetary value of spending 8 hours per
week on average studying for the exam?
TABLE 7-3
The lifetimes of a certain brand of light bulbs are known to be normally distributed with
a mean of 1,600 hours and a standard deviation of 400 hours. A random sample of 64 of
these light bulbs is taken.
Referring to Table 7-3, what is the probability that the sample mean lifetime is more
than 1,550 hours?
TABLE 5-8
Two different designs on a new line of winter jackets for the coming winter are
available for your manufacturing plants. Your profit (in thousands of dollars) will
depend on the taste of the consumers when winter arrives. The probability of the three
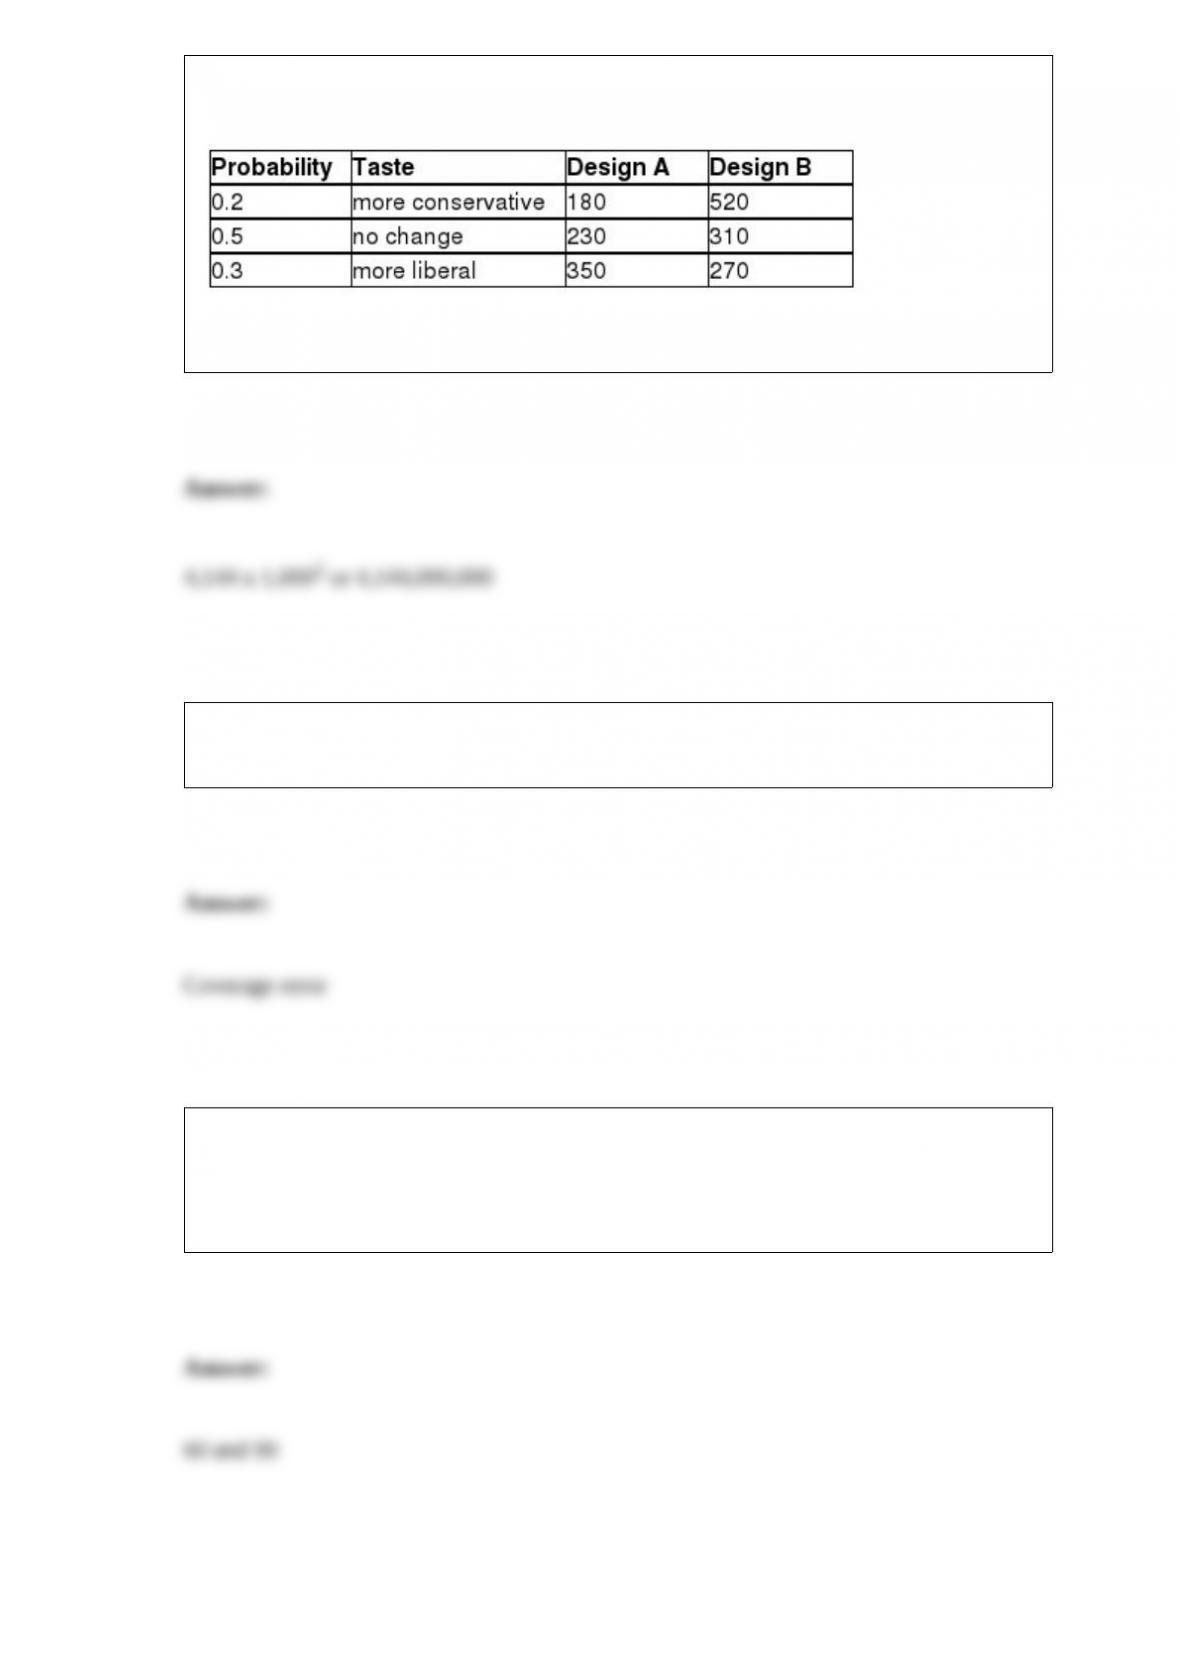
possible different tastes of the consumers and the corresponding profits are presented in
the following table.
Referring to Table 5-8, what is the variance of your profit when Design A is chosen?
________ results from the exclusion of certain groups of subjects from a population
frame.
You were told that the mean score on a statistics exam is 75 with the scores normally
distributed. In addition, you know the probability of a score between 55 and 60 is
4.41% and that the probability of a score greater than 90 is 6.68%. The middle 86.64%
of the students will score between which two scores?

The amount of bleach a machine pours into bottles has a mean of 36 oz. with a standard
deviation of 0.15 oz. Suppose we take a random sample of 36 bottles filled by this
machine. The probability that the mean of the sample is between 35.95 and 35.98 oz. is
________.