TABLE 8-9
A university wanted to find out the percentage of students who felt comfortable
reporting cheating by their fellow students. A survey of 2,800 students was conducted
and the students were asked if they felt comfortable reporting cheating by their fellow
students. The results were 1,344 answered “Yes” and 1,456 answered “No.”
Referring to Table 8-9, the sampling error of a 99% confidence interval for the
proportion of student population who feel comfortable reporting cheating by their
fellow students is ________.
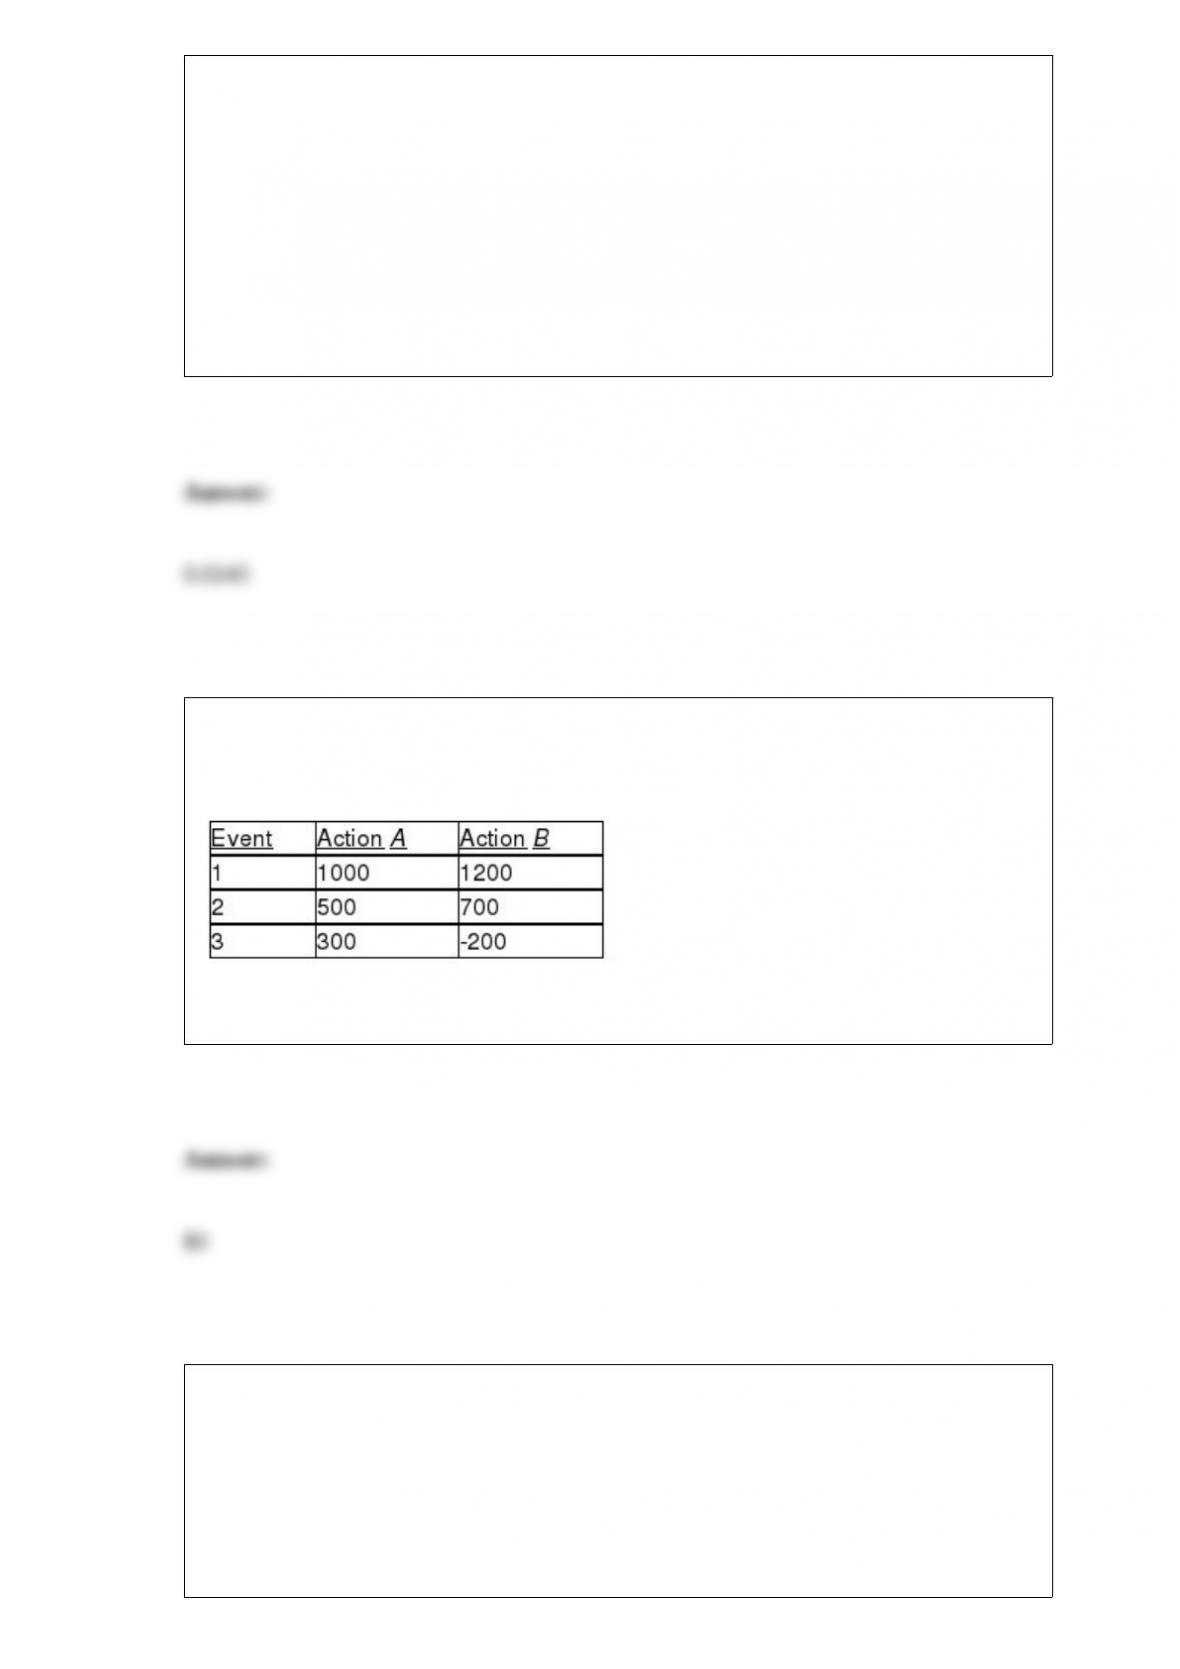
TABLE 19-5
The following payoff table shows profits associated with a set of 2 alternatives under 3
possible events.
Suppose that the probability of Event 1 is 0.2, Event 2 is 0.5, and Event 3 is 0.3.
Referring to Table 19-5, what is the opportunity loss for Action B with Event 1?
TABLE 17-10
Given below are results from the regression analysis where the dependent variable is
the number of weeks a worker is unemployed due to a layoff (Unemploy) and the
independent variables are the age of the worker (Age), the number of years of education
received (Edu), the number of years at the previous job (Job Yr), a dummy variable for
marital status (Married: 1 = married, 0 = otherwise), a dummy variable for head of
household (Head: 1 = yes, 0 = no) and a dummy variable for management position
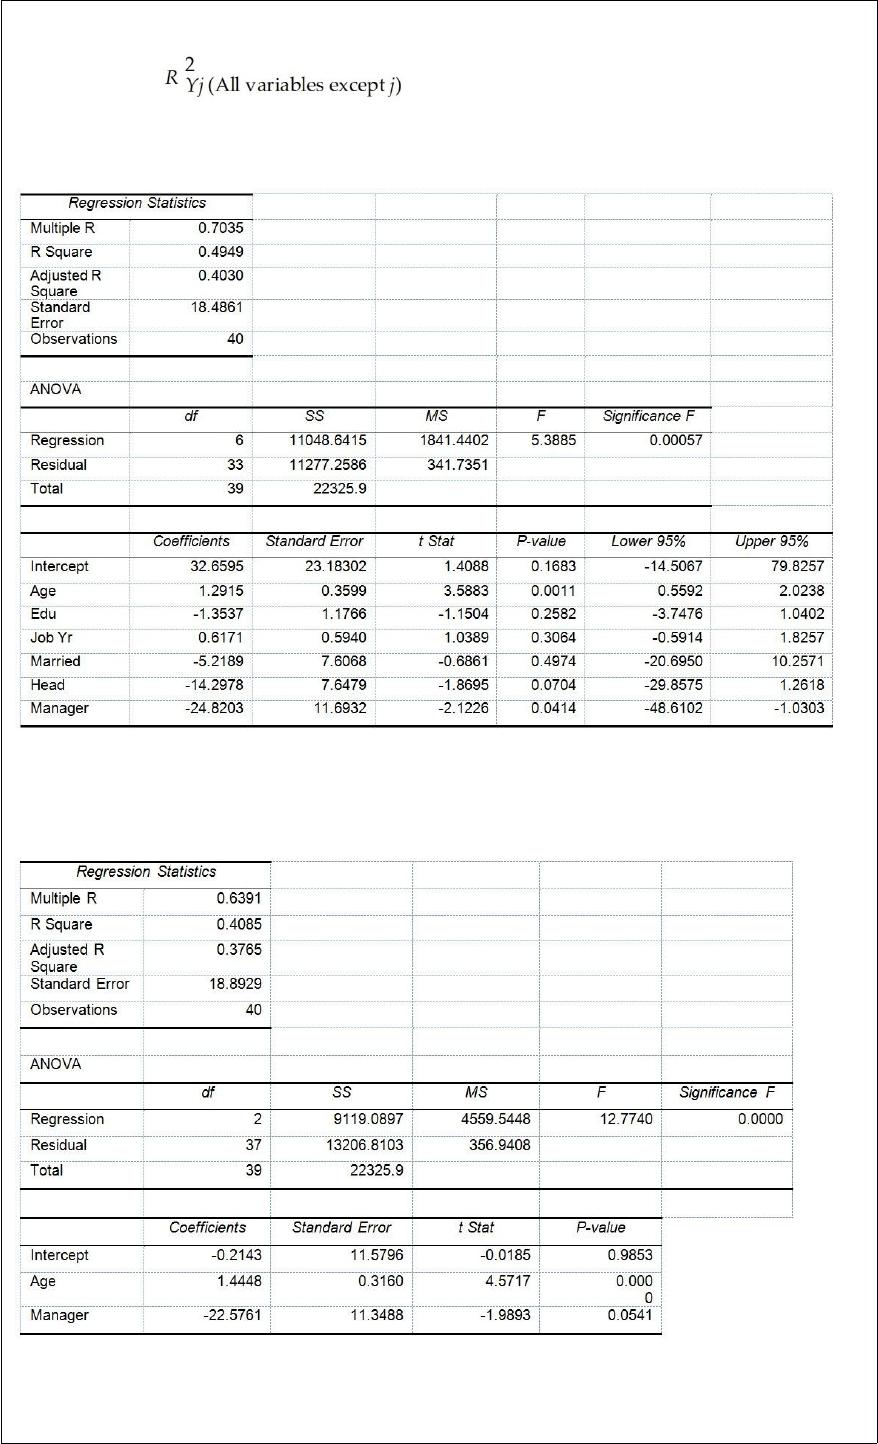
(Manager: 1 = yes, 0 = no). We shall call this Model 1. The coefficient of partial
determination ( ) of each of the 6 predictors are, respectively,
0.2807, 0.0386, 0.0317, 0.0141, 0.0958, and 0.1201.
Model 2 is the regression analysis where the dependent variable is Unemploy and the
independent variables are Age and Manager. The results of the regression analysis are
given below:
Referring to Table 17-10, Model 1, ________ of the variation in the number of weeks a
worker is unemployed due to a layoff can be explained by the marital status while
controlling for the other independent variables.
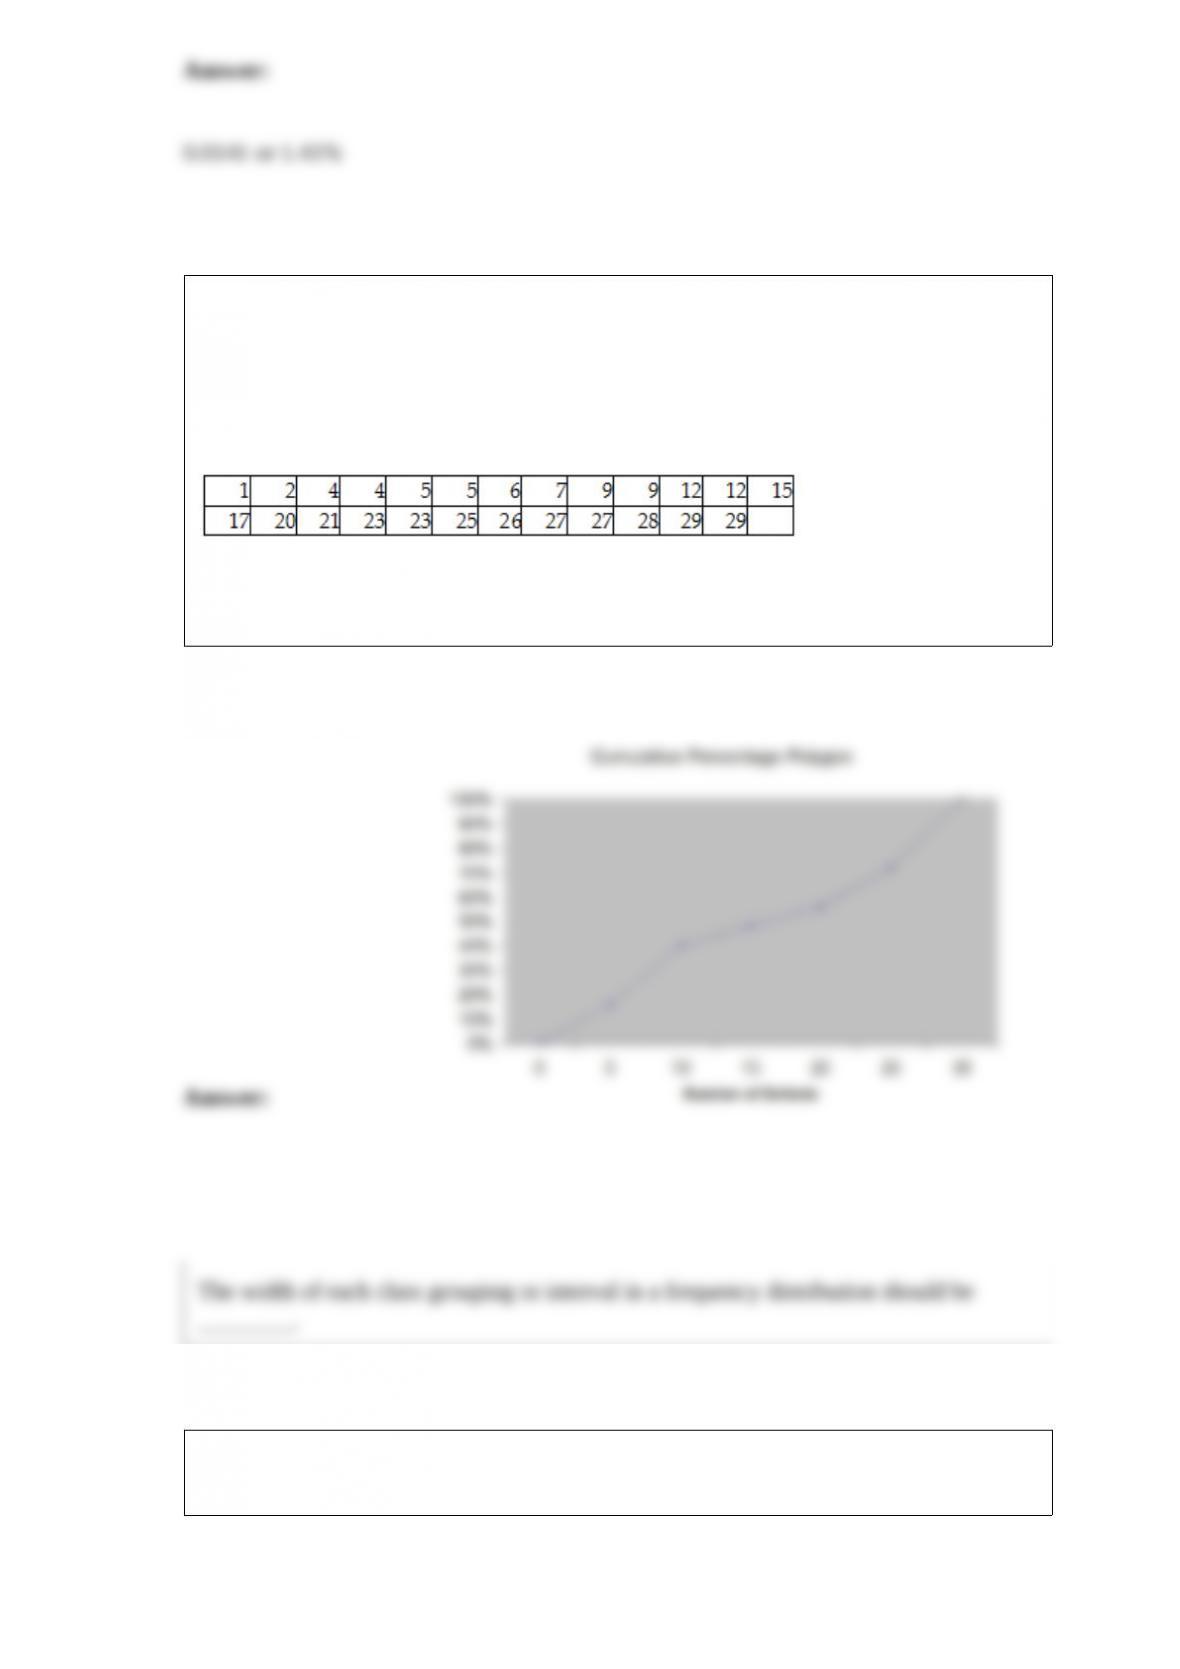
TABLE 2-11
The ordered array below resulted from selecting a sample of 25 batches of 500
computer chips and determining how many in each batch were defective.
Defects
Referring to Table 2-11, construct a cumulative percentage polygon for the defects data
if the corresponding frequency distribution uses “0 but less than 5” as the first class.
The width of each class grouping or interval in a frequency distribution should be
________.
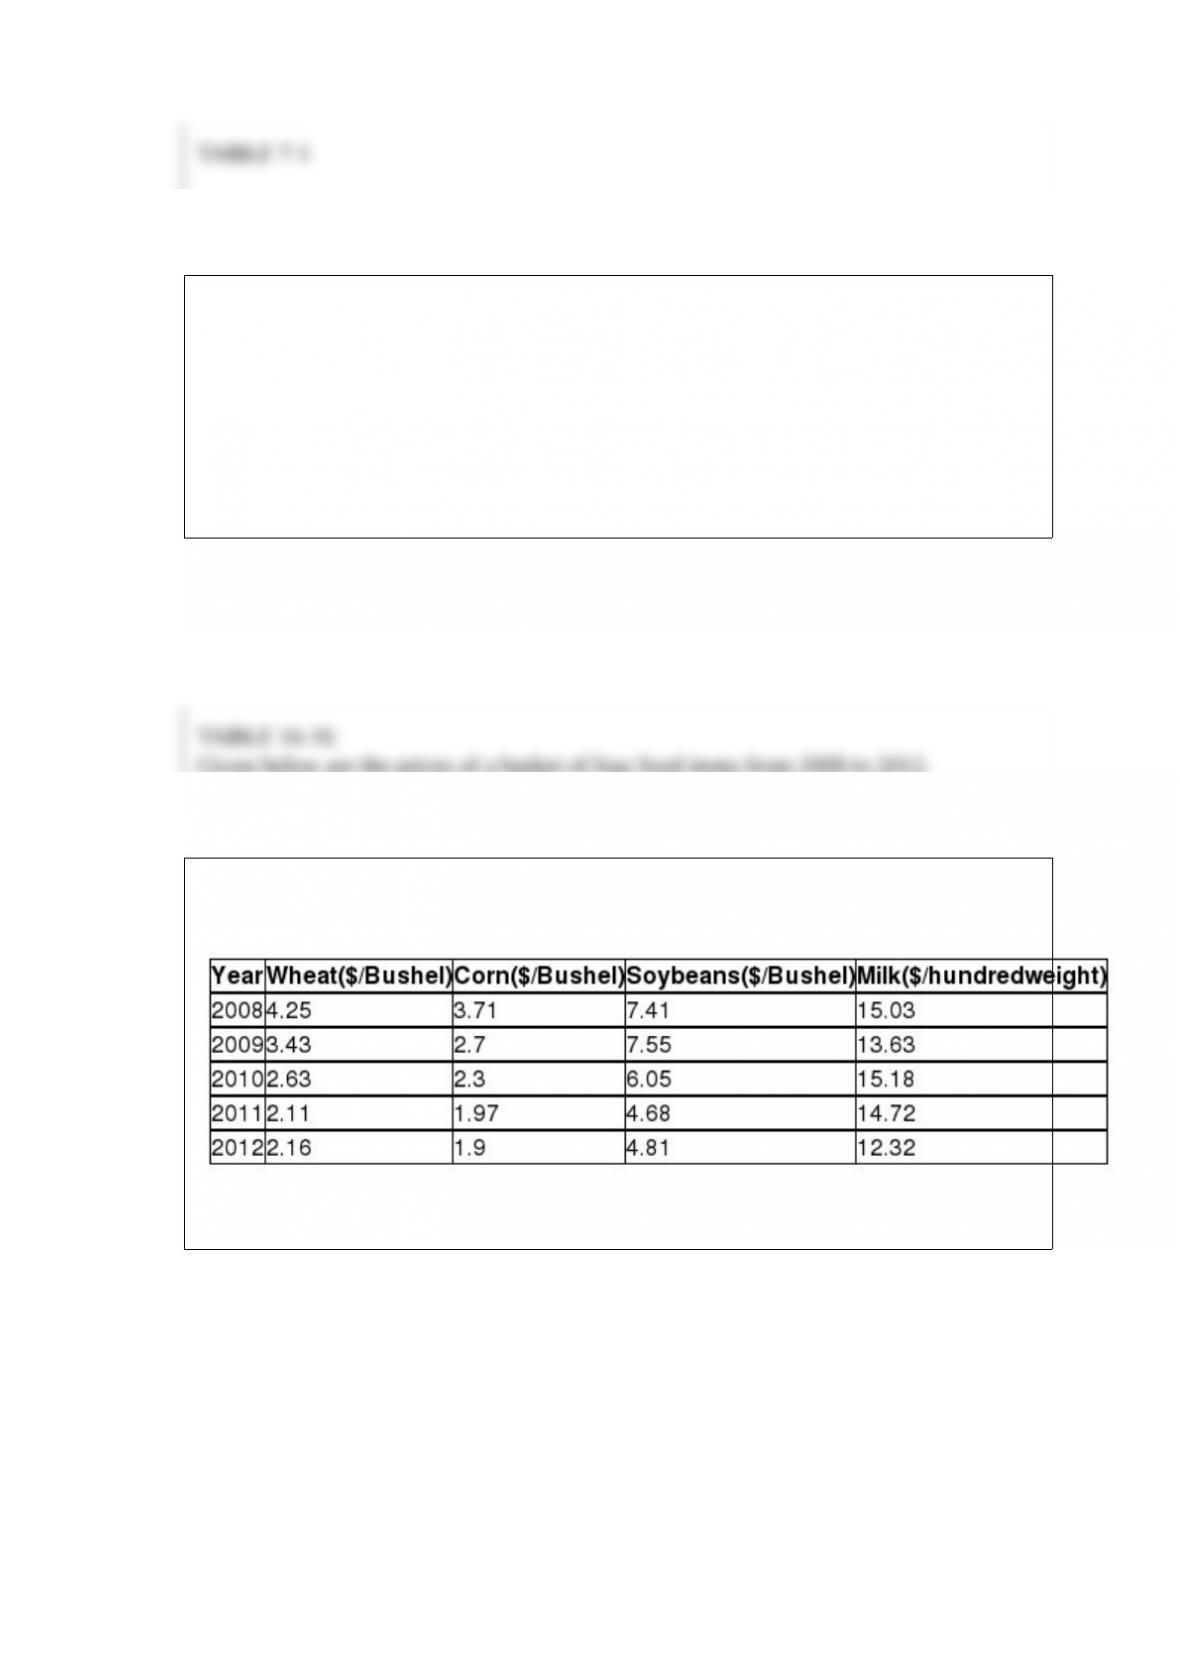
TABLE 7-1
The time spent studying by students in the week before final exams follows a normal
distribution with a standard deviation of 8 hours. A random sample of 4 students was
taken in order to estimate the mean study time for the population of all students.
Referring to Table 7-1, what is the probability that the sample mean differs from the
population mean by less than 2 hours?
TABLE 16-16
Given below are the prices of a basket of four food items from 2008 to 2012.
Referring to Table 16-16, what are the simple price indices for wheat, corn, soybeans
and milk, respectively, in 2011 using 2008 as the base year?