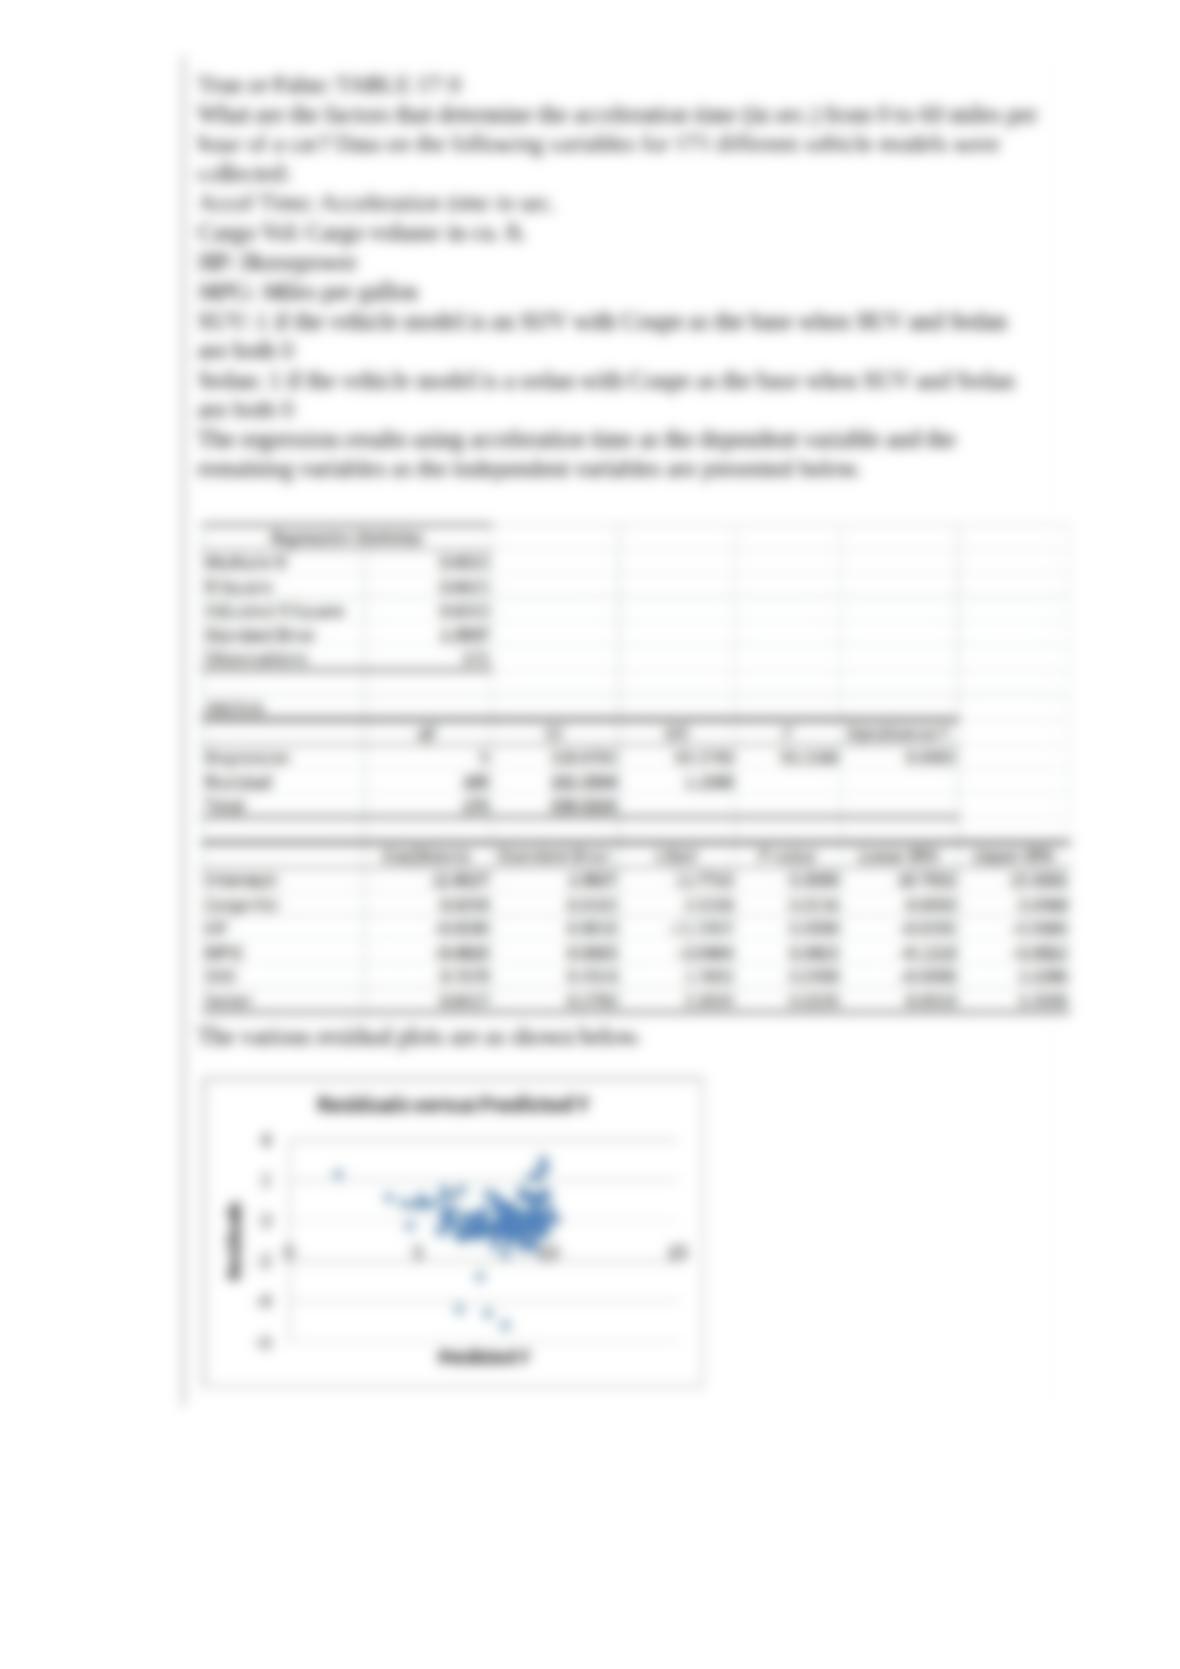
True or False: TABLE 17-9
What are the factors that determine the acceleration time (in sec.) from 0 to 60 miles per
hour of a car? Data on the following variables for 171 different vehicle models were
collected:
Accel Time: Acceleration time in sec.
Cargo Vol: Cargo volume in cu. ft.
HP: Horsepower
MPG: Miles per gallon
SUV: 1 if the vehicle model is an SUV with Coupe as the base when SUV and Sedan
are both 0
Sedan: 1 if the vehicle model is a sedan with Coupe as the base when SUV and Sedan
are both 0
The regression results using acceleration time as the dependent variable and the
remaining variables as the independent variables are presented below.
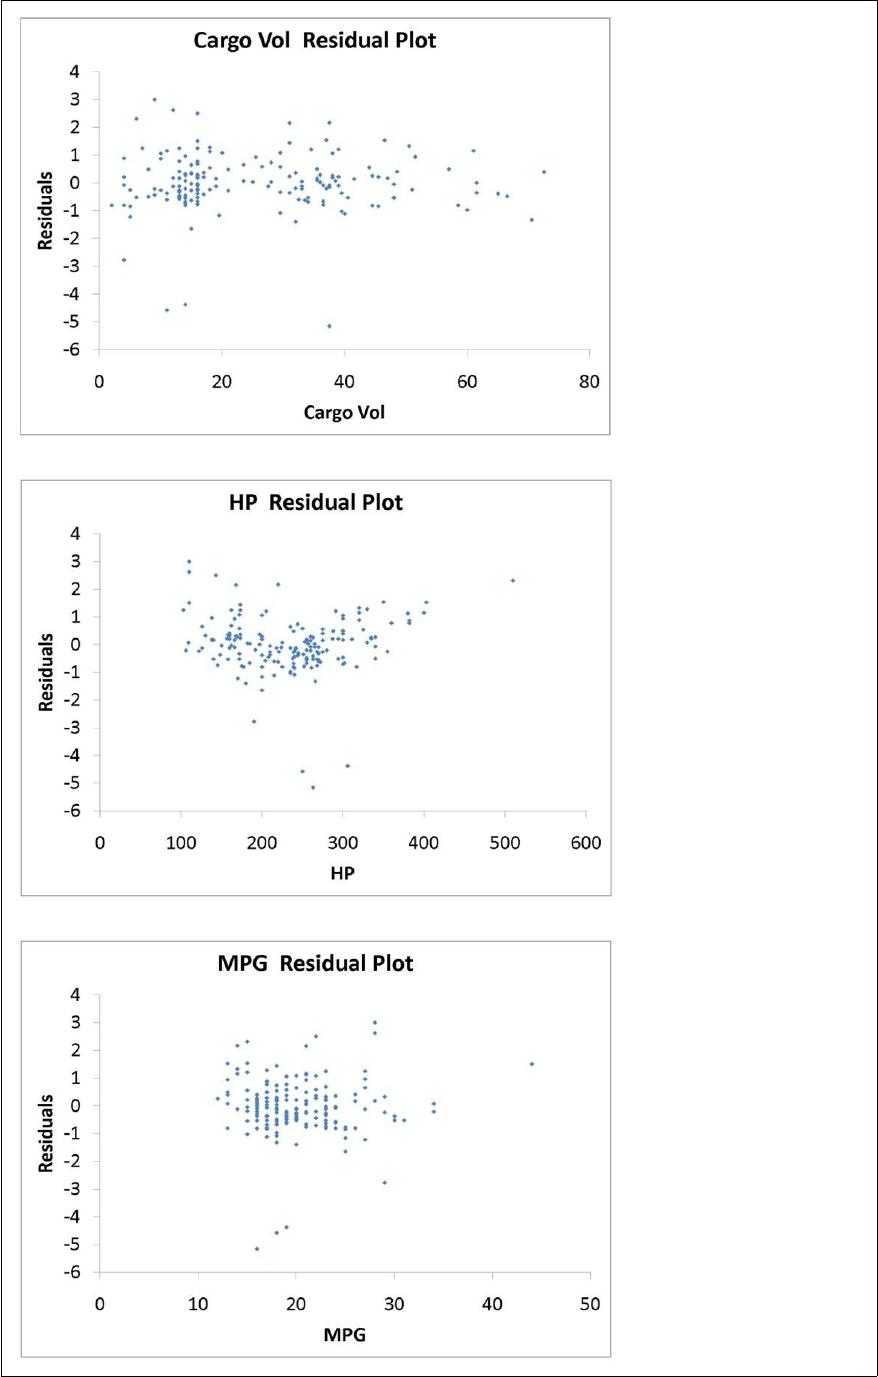
The various residual plots are as shown below.
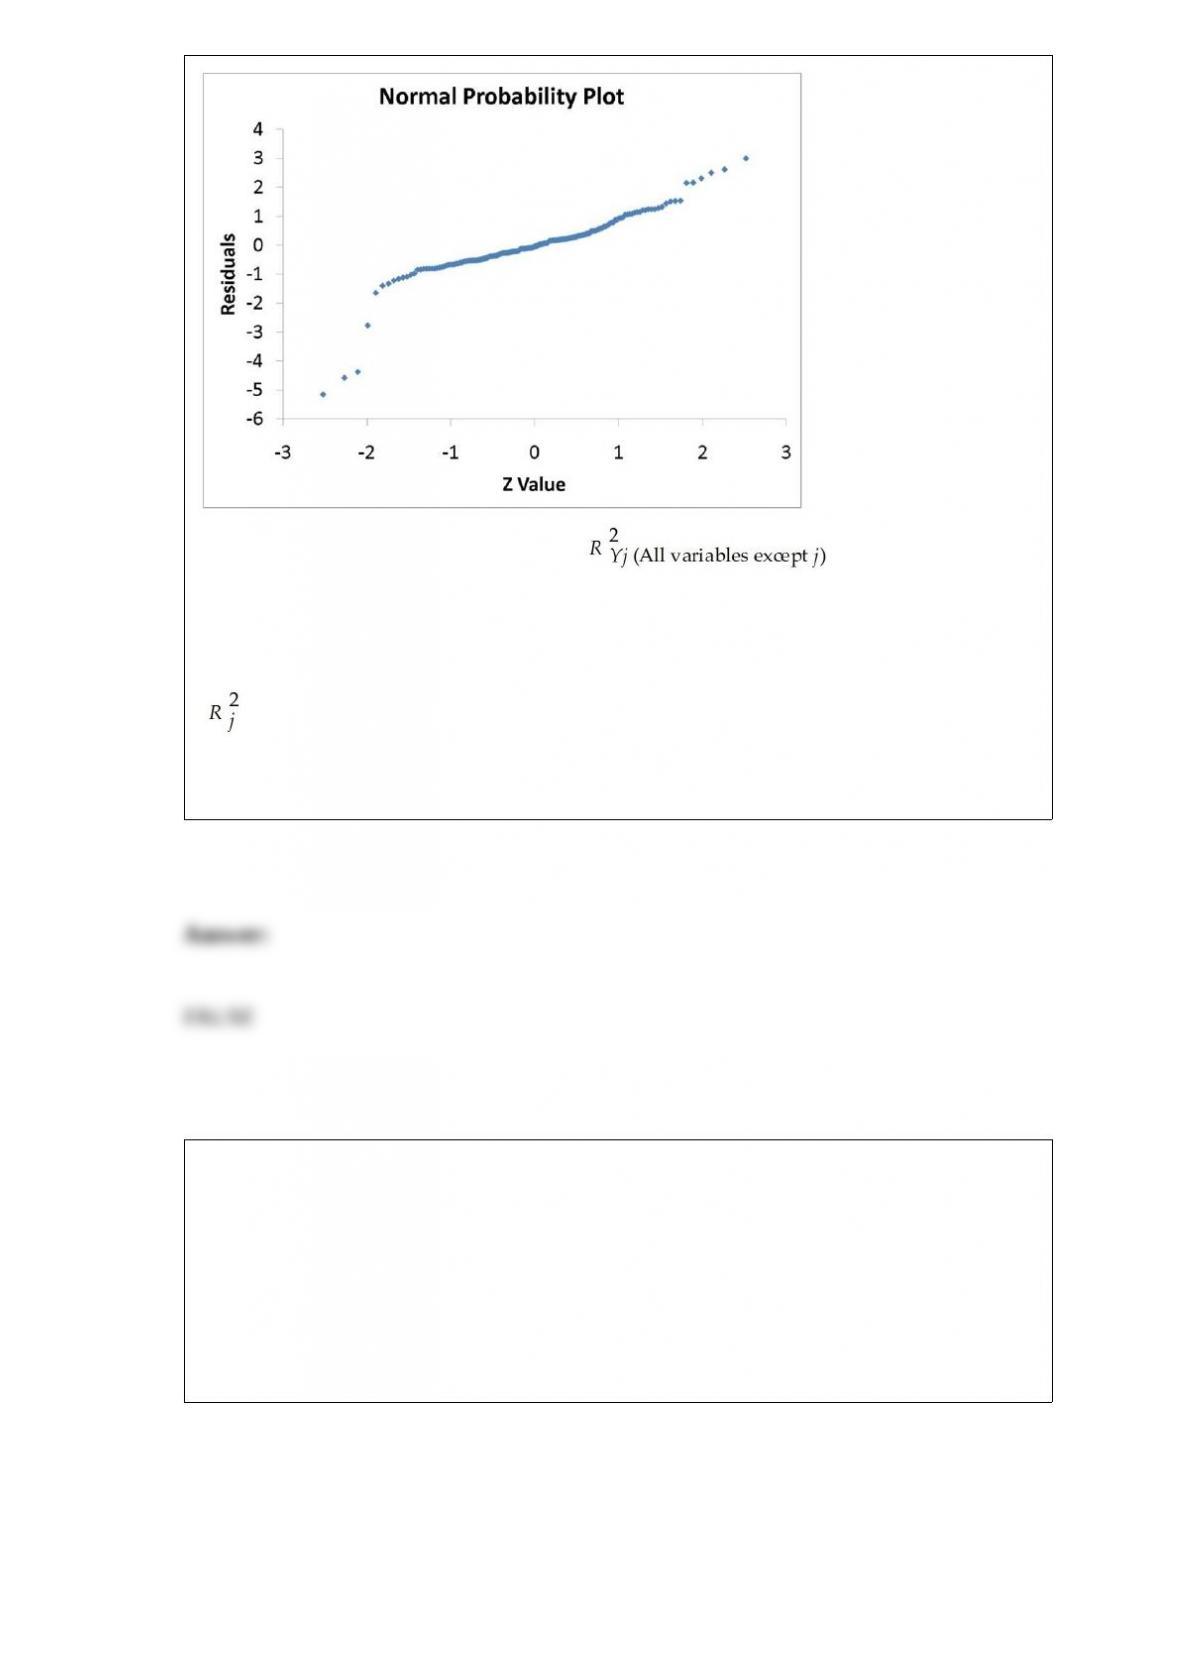
The coefficient of partial determination ( ) of each of the 5
predictors are, respectively, 0.0380, 0.4376, 0.0248, 0.0188, and 0.0312.
The coefficient of multiple determination for the regression model using each of the 5
variables Xj as the dependent variable and all other X variables as independent variables
( ) are, respectively, 0.7461, 0.5676, 0.6764, 0.8582, 0.6632.
Referring to Table 17-9, the 0 to 60 miles per hour acceleration time of a sedan is
predicted to be 0.1252 seconds higher than that of an SUV.
TABLE 13-11
A computer software developer would like to use the number of downloads (in
thousands) for the trial version of his new shareware to predict the amount of revenue
(in thousands of dollars) he can make on the full version of the new shareware.
Following is the output from a simple linear regression along with the residual plot and
normal probability plot obtained from a data set of 30 different sharewares that he has
developed:
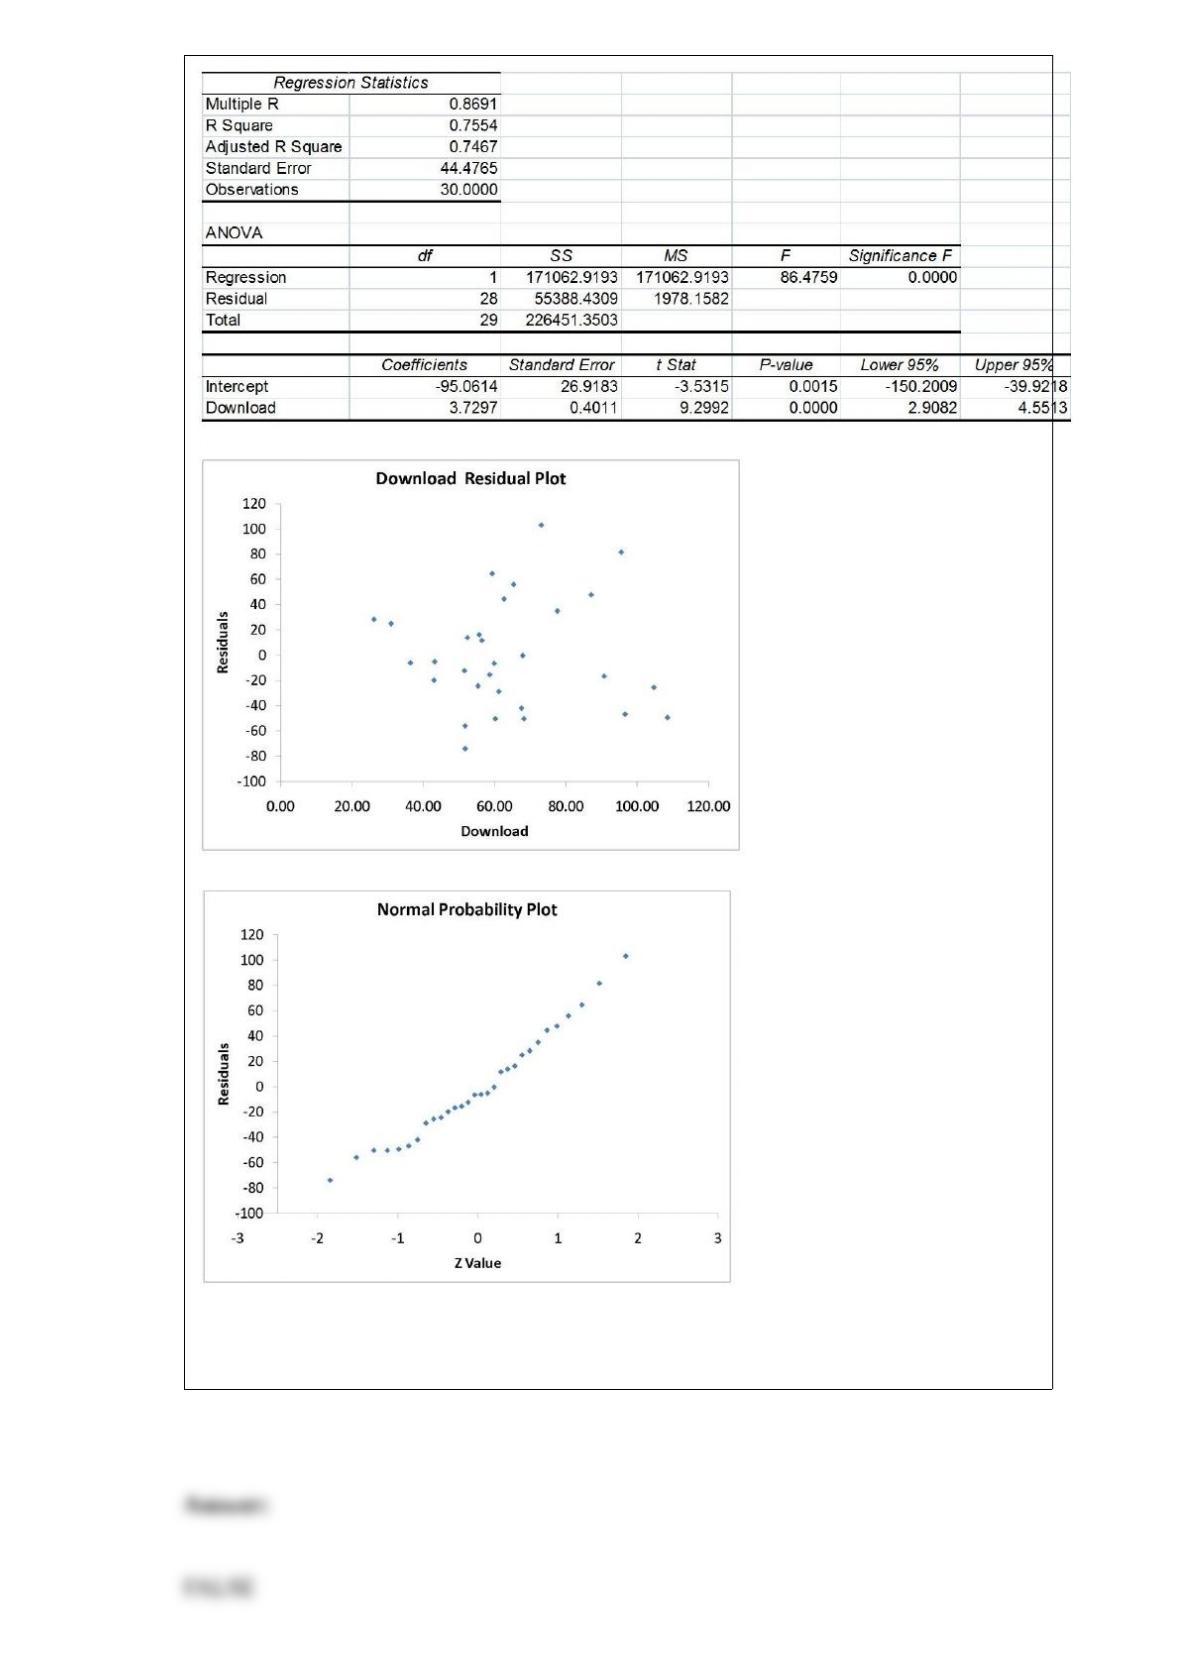
True or False: Referring to Table 13-11, there appears to be autocorrelation in the
residuals.

True or False: For a given data set, the confidence interval will be wider for 95%
confidence than for 90% confidence.
True or False: A professor of economics at a small Texas university wanted to determine
what year in school students were taking his tough economics course. Data were
collected on the class status (“freshman”, ‘sophomore”, “junior” or ‘senior”) of 50
students enrolled in one of his economics course. A side-by-side bar chart can be used
to present this information.
True or False: The answer to the question “How many hours on average do you spend
watching TV every week?” is an example of a ratio scaled variable.
True or False: If a data set is approximately normally distributed, its normal probability
plot would be S-shaped.
True or False: The coefficient of multiple determination measures the proportion
of variation in Y that is explained by X1 and X2.
TABLE 8-6
After an extensive advertising campaign, the manager of a company wants to estimate
the proportion of potential customers that recognize a new product. She samples 120
potential consumers and finds that 54 recognize this product. She uses this sample
information to obtain a 95% confidence interval that goes from 0.36 to 0.54.
True or False: Referring to Table 8-6, this interval requires the use of the t distribution
to obtain the confidence coefficient.
TABLE 11-8
An important factor in selecting database software is the time required for a user to
learn how to use the system. To evaluate three potential brands (A, B and C) of database
software, a company designed a test involving five different employees. To reduce
variability due to differences among employees, each of the five employees is trained
on each of the three different brands. The amount of time (in hours) needed to learn
each of the three different brands is given below:
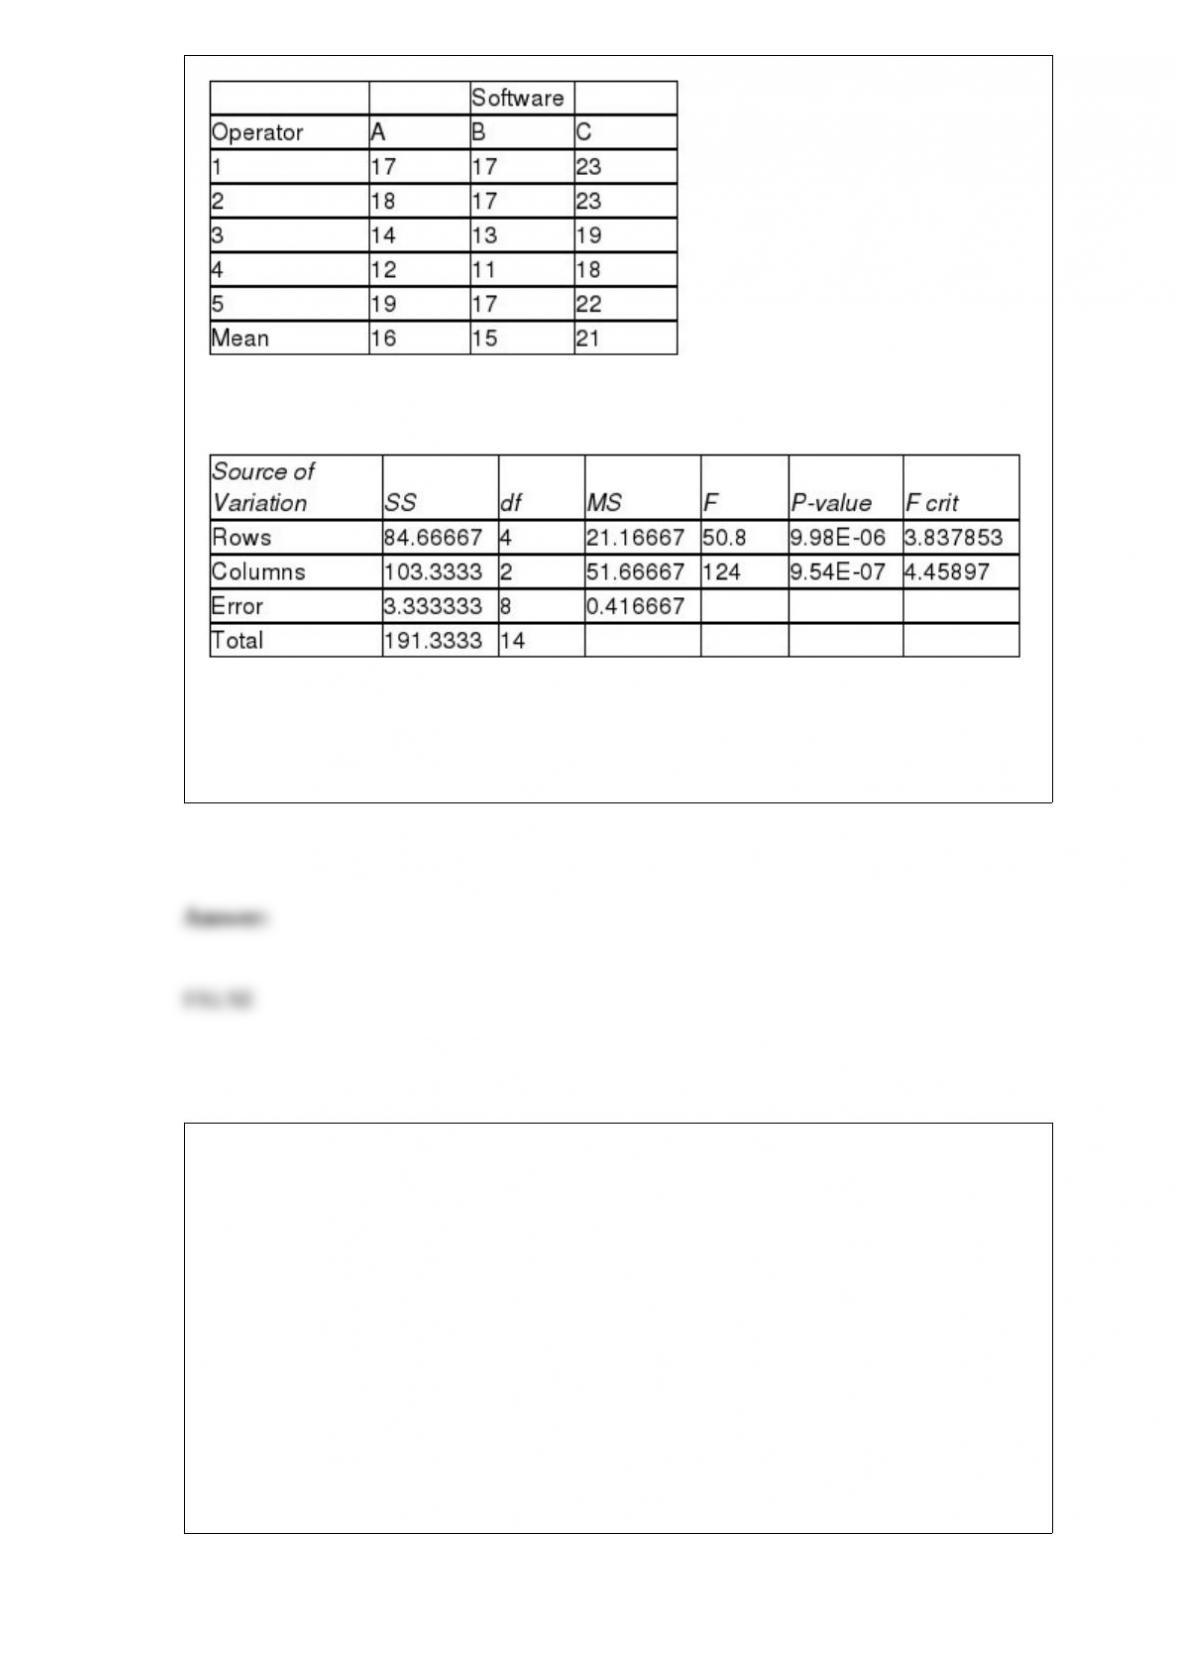
Below is the Excel output for the randomized block design:
True or False: Referring to Table 11-8, the decision made at a 0.05 level of significance
on the randomized block F test for the difference in means implies that all 3 means are
significantly different from each other.
TABLE 8-3
To become an actuary, it is necessary to pass a series of 10 exams, including the most
important one, an exam in probability and statistics. An insurance company wants to
estimate the mean score on this exam for actuarial students who have enrolled in a
special study program. They take a sample of 8 actuarial students in this program and
determine that their scores are: 2, 5, 8, 8, 7, 6, 5, and 7. This sample will be used to
calculate a 90% confidence interval for the mean score for actuarial students in the
special study program.
True or False: Referring to Table 8-3, for the confidence interval to be valid, it is
necessary that test scores of students in the special study program on the actuarial exam
be normally distributed.
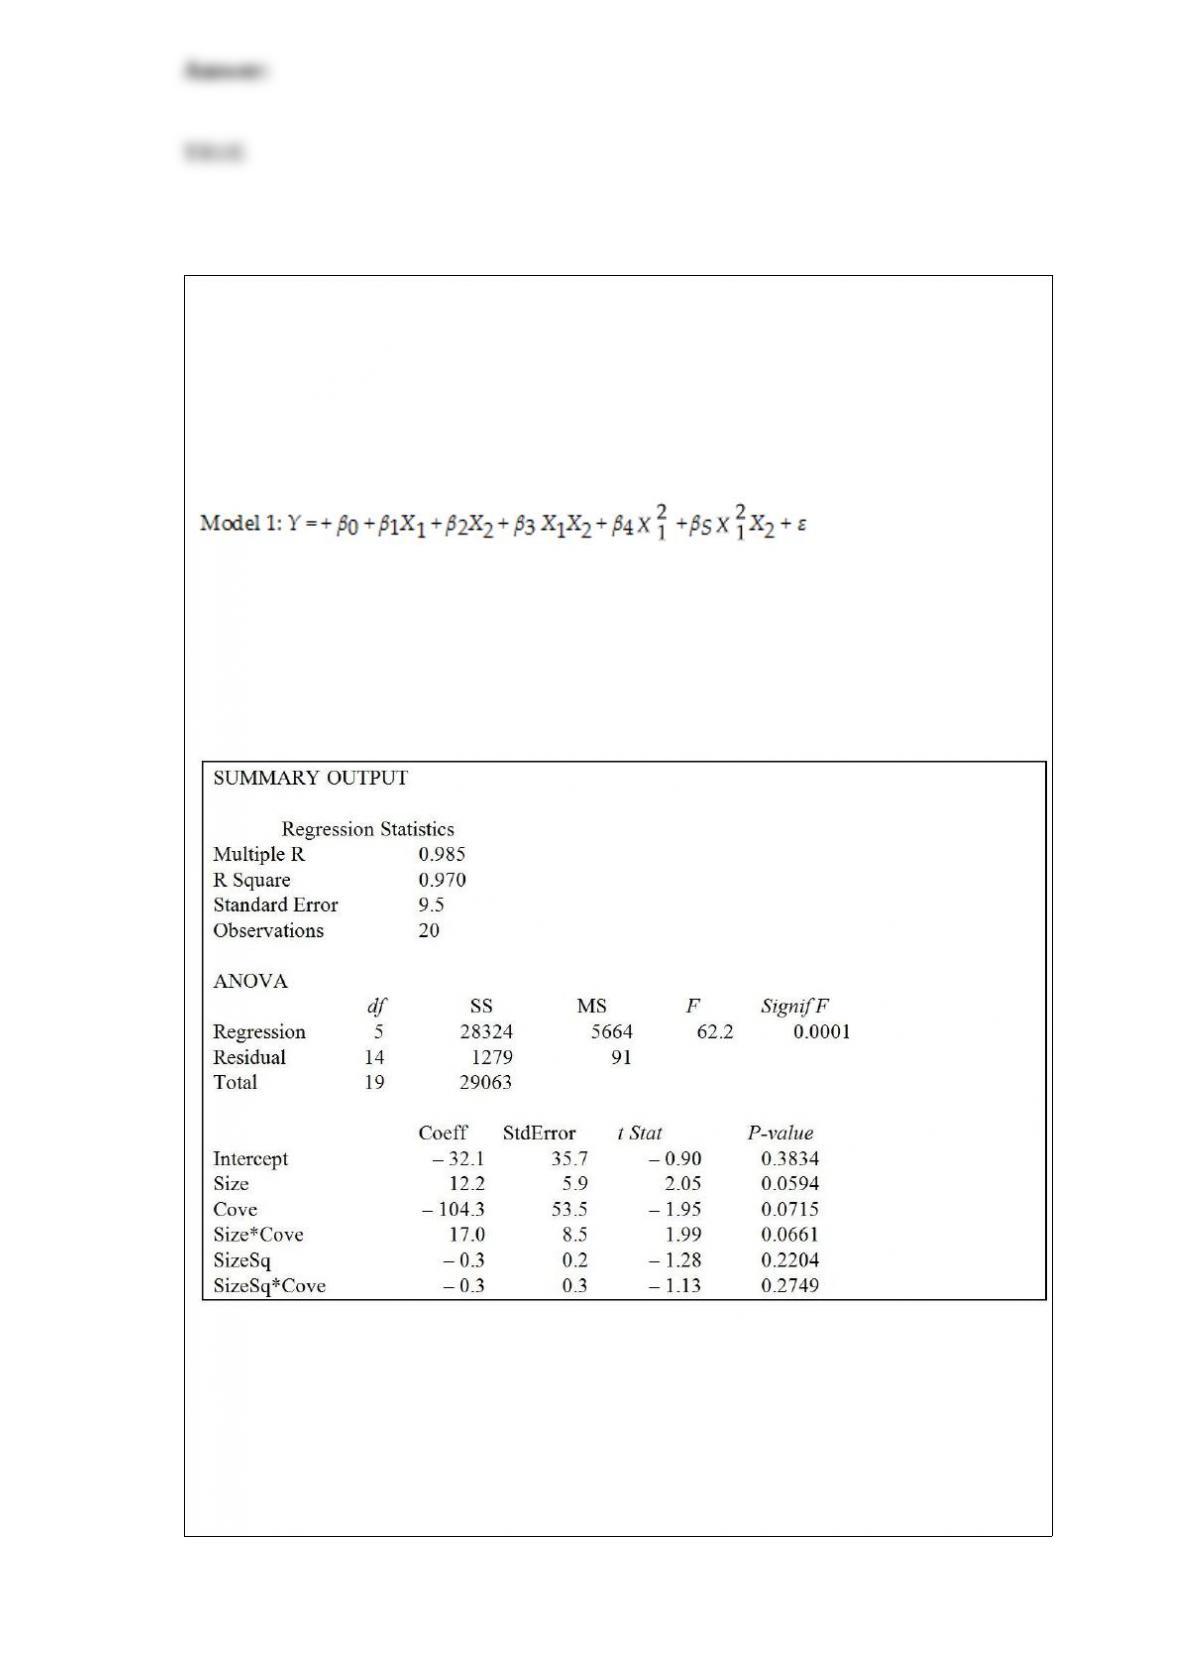
TABLE 15-2
In Hawaii, condemnation proceedings are under way to enable private citizens to own
the property that their homes are built on. Until recently, only estates were permitted to
own land, and homeowners leased the land from the estate. In order to comply with the
new law, a large Hawaiian estate wants to use regression analysis to estimate the fair
market value of the land. The following model was fit to data collected for n = 20
properties, 10 of which are located near a cove.
where Y = Sale price of property in thousands of dollars
X1 = Size of property in thousands of square feet
X2 = 1 if property located near cove, 0 if not
Using the data collected for the 20 properties, the following partial output obtained
from Microsoft Excel is shown:
Referring to Table 15-2, given a quadratic relationship between sale price (Y) and
property size (X1), what test should be used to test whether the curves differ from cove
and non-cove properties?
A) F test for the entire regression model
B) t test on each of the coefficients in the entire regression model
C) partial F test on the subset of the appropriate coefficients
D) t test on each of the subsets of the appropriate coefficients
An independent variable Xj is considered highly correlated with the other independent
variables if
A) VIFj < 5.
B) VIFj > 5.
C) VIFj < VIFi for i j.
D) VIFj > VIFi for i j.
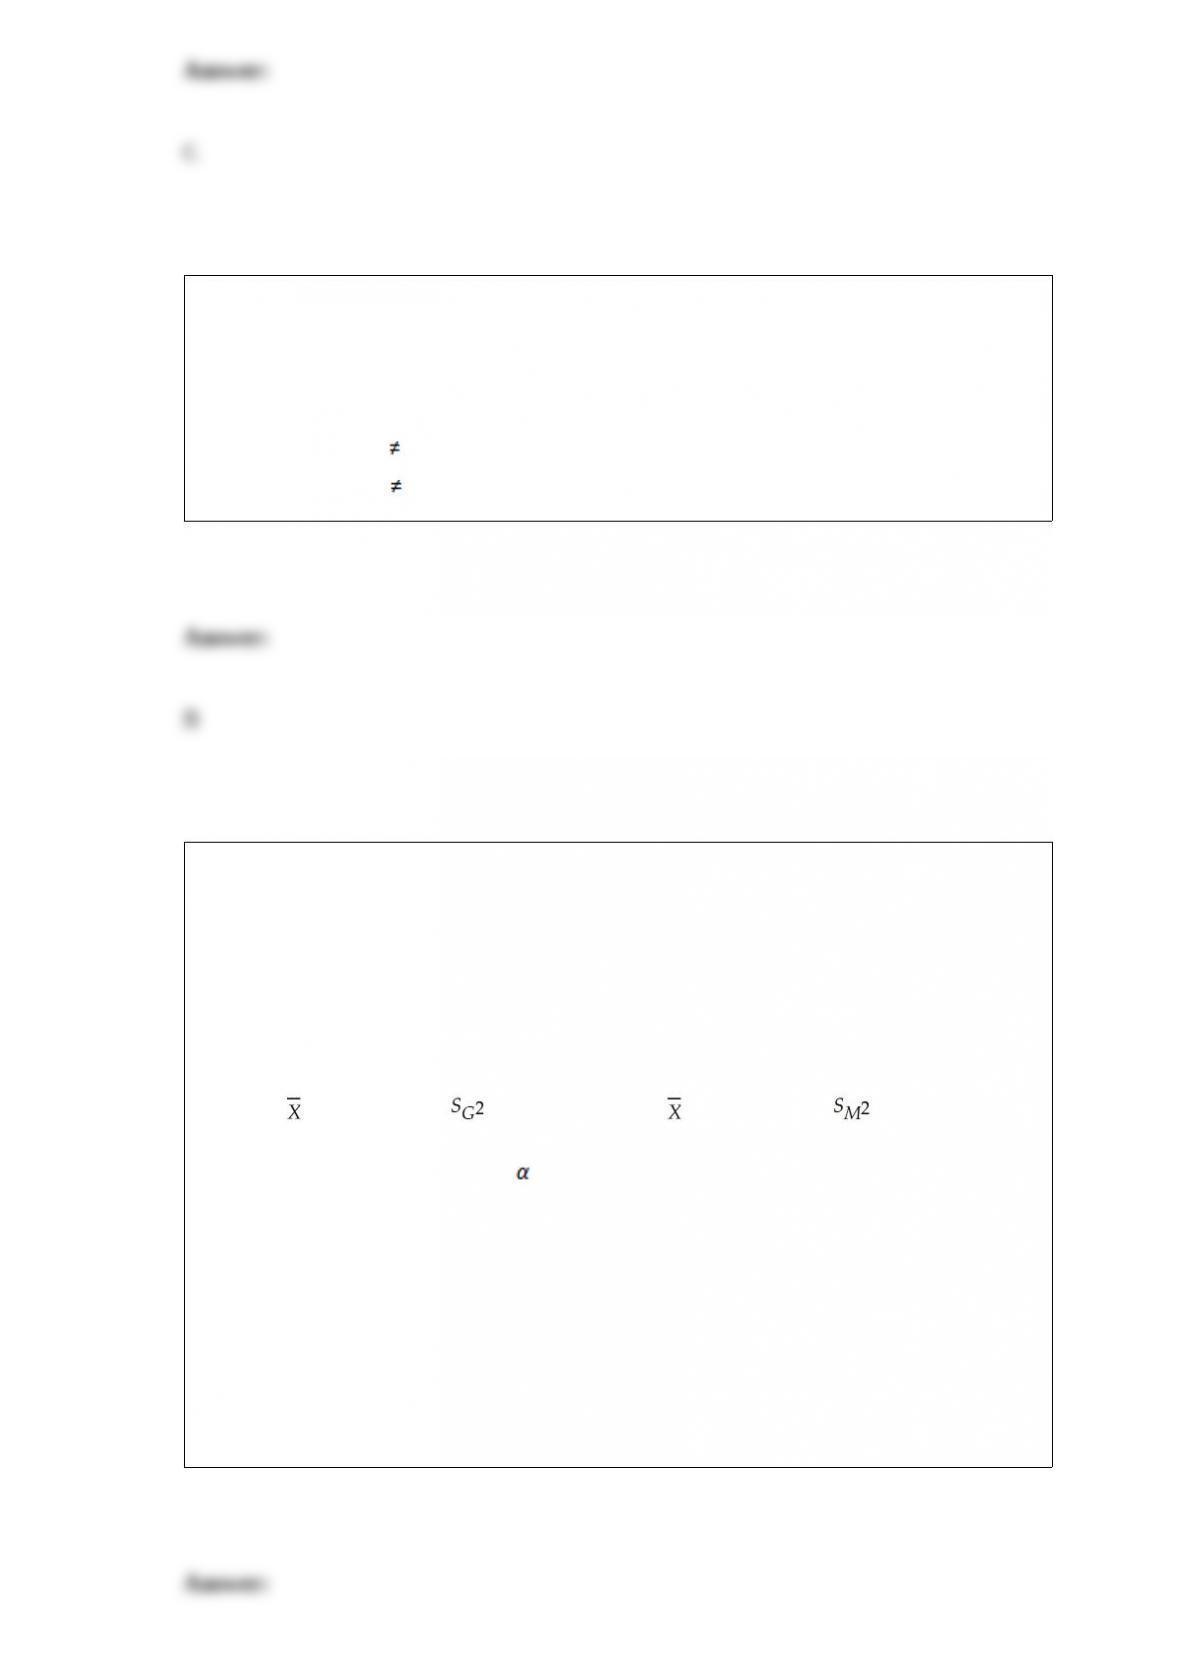
TABLE 10-3
A real estate company is interested in testing whether the mean time that families in
Gotham have been living in their current homes is less than families in Metropolis.
Assume that the two population variances are equal. A random sample of 100 families
from Gotham and a random sample of 150 families in Metropolis yield the following
data on length of residence in current homes.
Gotham: G = 35 months, = 900 Metropolis: M = 50 months, = 1050
Referring to Table 10-3, suppose = 0.01. Which of the following represents the result
of the relevant hypothesis test?
A) The alternative hypothesis is rejected.
B) The null hypothesis is rejected.
C) The null hypothesis is not rejected.
D) Insufficient information exists on which to make a decision.
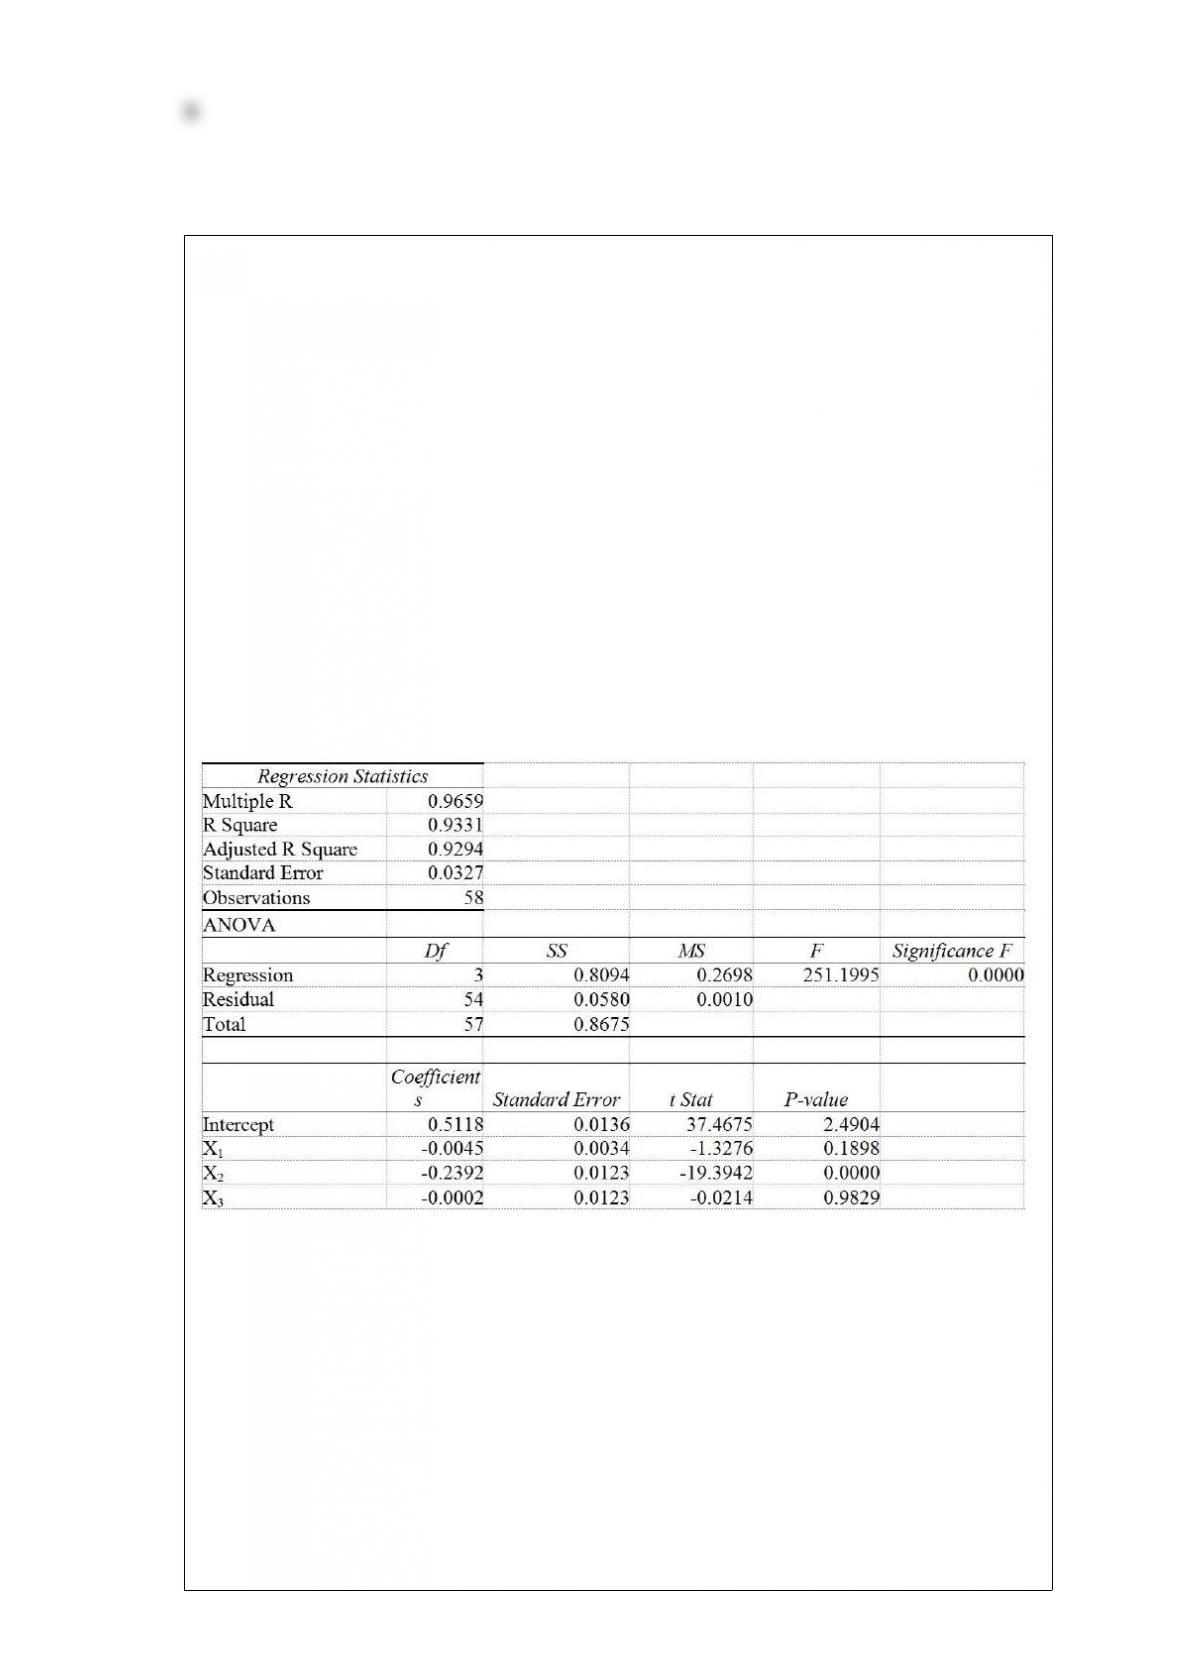
TABLE 17-7
As a project for his business statistics class, a student examined the factors that
determined parking meter rates throughout the campus area. Data were collected for the
price per hour of parking, blocks to the quadrangle, and one of the three jurisdictions:
on campus, in downtown and off campus, or outside of downtown and off campus. The
population regression model hypothesized is
Yi= α + β1X1i + β2X2i + β3X3i + ε
where
Y is the meter price
X1 is the number of blocks to the quad
X2 is a dummy variable that takes the value 1 if the meter is located in downtown and
off campus and the value 0 otherwise
X3 is a dummy variable that takes the value 1 if the meter is located outside of
downtown and off campus, and the value 0 otherwise
The following Excel results are obtained.
Referring to Table 17-7, what is the correct interpretation for the estimated coefficient
for X2?
A) Holding the effect of the other independent variables constant, the estimated mean
difference in costs between parking on campus, and parking outside of downtown and
off campus is -$0.24 per hour.
B) Holding the effect of the other independent variables constant, the estimated mean
difference in costs between parking in downtown and off campus, and parking on
campus is -$0.24 per hour.
C) Holding the effect of the other independent variables constant, the estimated mean
difference in costs between parking in downtown and off campus, and parking outside
of downtown and off campus is -$0.24 per hour.
D) Holding the effect of the other independent variables constant, the estimated mean
difference in costs between parking in downtown and off campus, and parking either
outside of downtown and off campus or on campus is -$0.24 per hour.
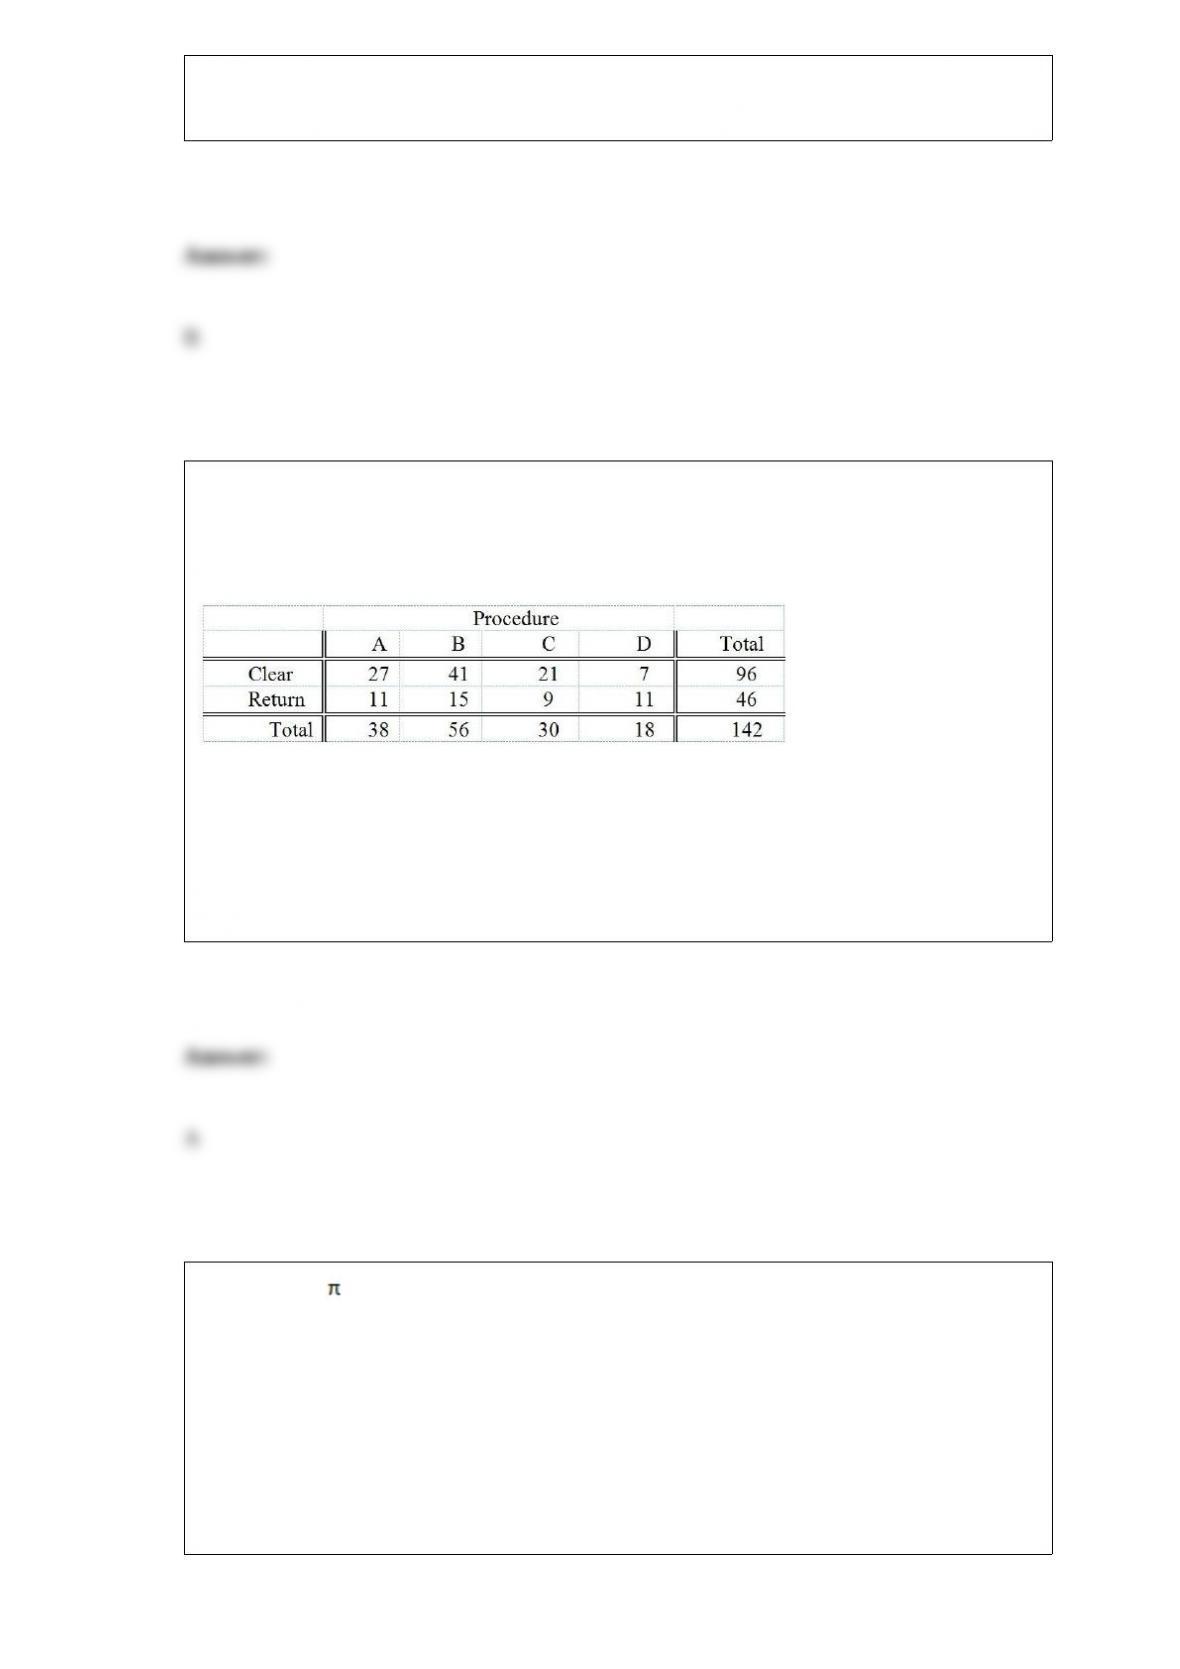
Four surgical procedures currently are used to install pacemakers. If the patient does not
need to return for follow-up surgery, the operation is called a “clear” operation. A heart
center wants to compare the 4 procedures, and collects the following numbers of
patients from their own records:
Which of the following tests will be the most appropriate to find out whether the 4
procedures are equally effective?
A) χ2 test for difference in proportions
B) Z test for difference in proportions
C) One-way ANOVA F test for differences among more than two means
D) McNemar test
If n = 10 and = 0.70, then the standard deviation of the binomial distribution is
A) 0.07.
B) 1.45.
C) 7.00.
D) 14.29.

A major Blu-ray rental chain is considering opening a new store in an area that
currently does not have any such stores. The chain will open if there is evidence that
more than 5,000 of the 20,000 households in the area are equipped with Blu-ray
players. It conducts a telephone poll of 300 randomly selected households in the area
and finds that 96 have Blu-ray players. The rental chain’s conclusion from the
hypothesis test using a 5% level of significance is
A) to open a new store.
B) not to open a new store.
C) to delay opening a new store until additional evidence is collected.
D) We cannot tell what the decision should be from the information given.
TABLE 9-3
An appliance manufacturer claims to have developed a compact microwave oven that
consumes a mean of no more than 250 W. From previous studies, it is believed that
power consumption for microwave ovens is normally distributed with a population
standard deviation of 15 W. A consumer group has decided to try to discover if the
claim appears true. They take a sample of 20 microwave ovens and find that they
consume a mean of 257.3 W.
Referring to Table 9-3, the parameter of interest is
A) the mean power consumption of the 20 microwave ovens.
B) the mean power consumption of all such microwave ovens.
C) 250.
D) 257.3.
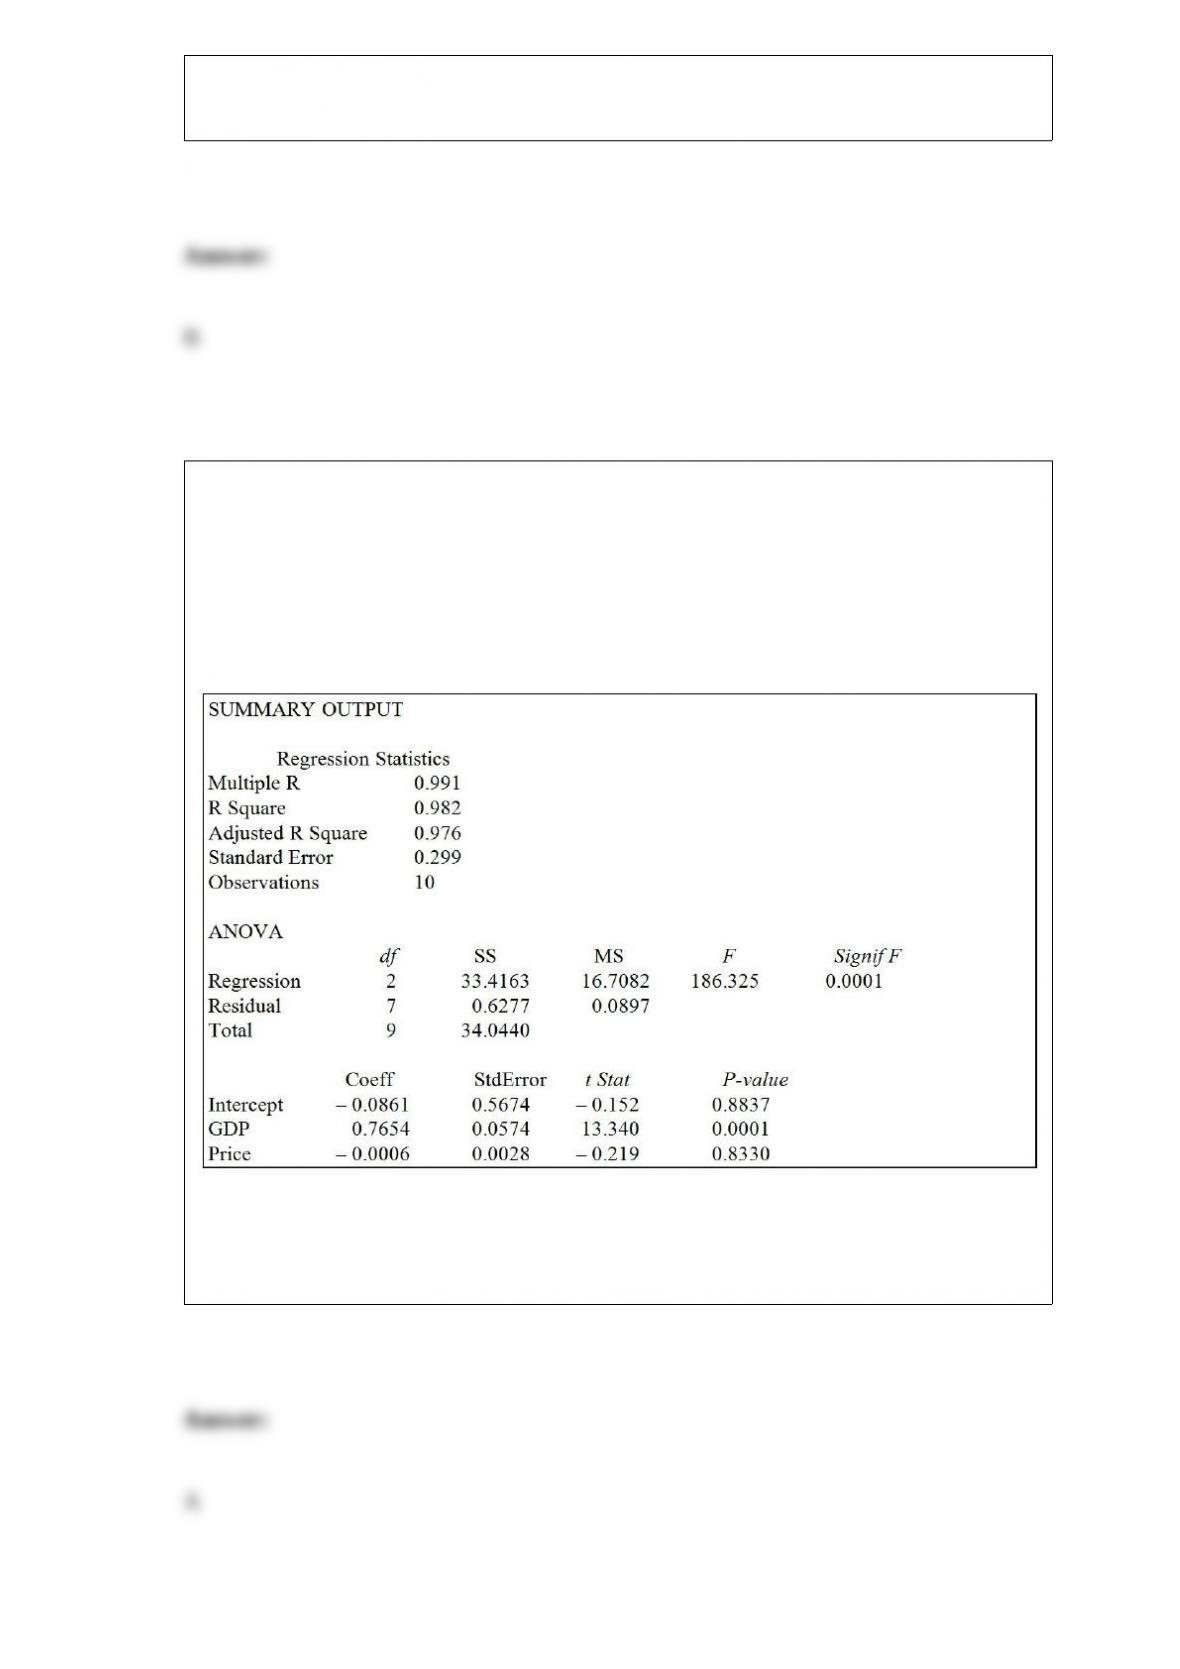
Referring to Table 14-3, to test for the significance of the coefficient on gross domestic
product, the p-value is
TABLE 14-3
An economist is interested to see how consumption for an economy (in $ billions) is
influenced by gross domestic product ($ billions) and aggregate price (consumer price
index). The Microsoft Excel output of this regression is partially reproduced below.
A) 0.0001.
B) 0.8330.
C) 0.8837.
D) 0.9999.
Blossom’s Flowers purchases roses for sale for Valentine’s Day. The roses are purchased
for $10 a dozen and are sold for $20 a dozen. Any roses not sold on Valentine’s Day can
be sold for $5 per dozen. The owner will purchase 1 of 3 amounts of roses for
Valentine’s Day: 100, 200, or 400 dozen roses. Given 0.2, 0.4, and 0.6 are the
probabilities for the sale of 100, 200, or 400 dozen roses, respectively, then the optimal
EOL for buying roses is
A) $700.
B) $900.
C) $1,500.
D) $1,600.
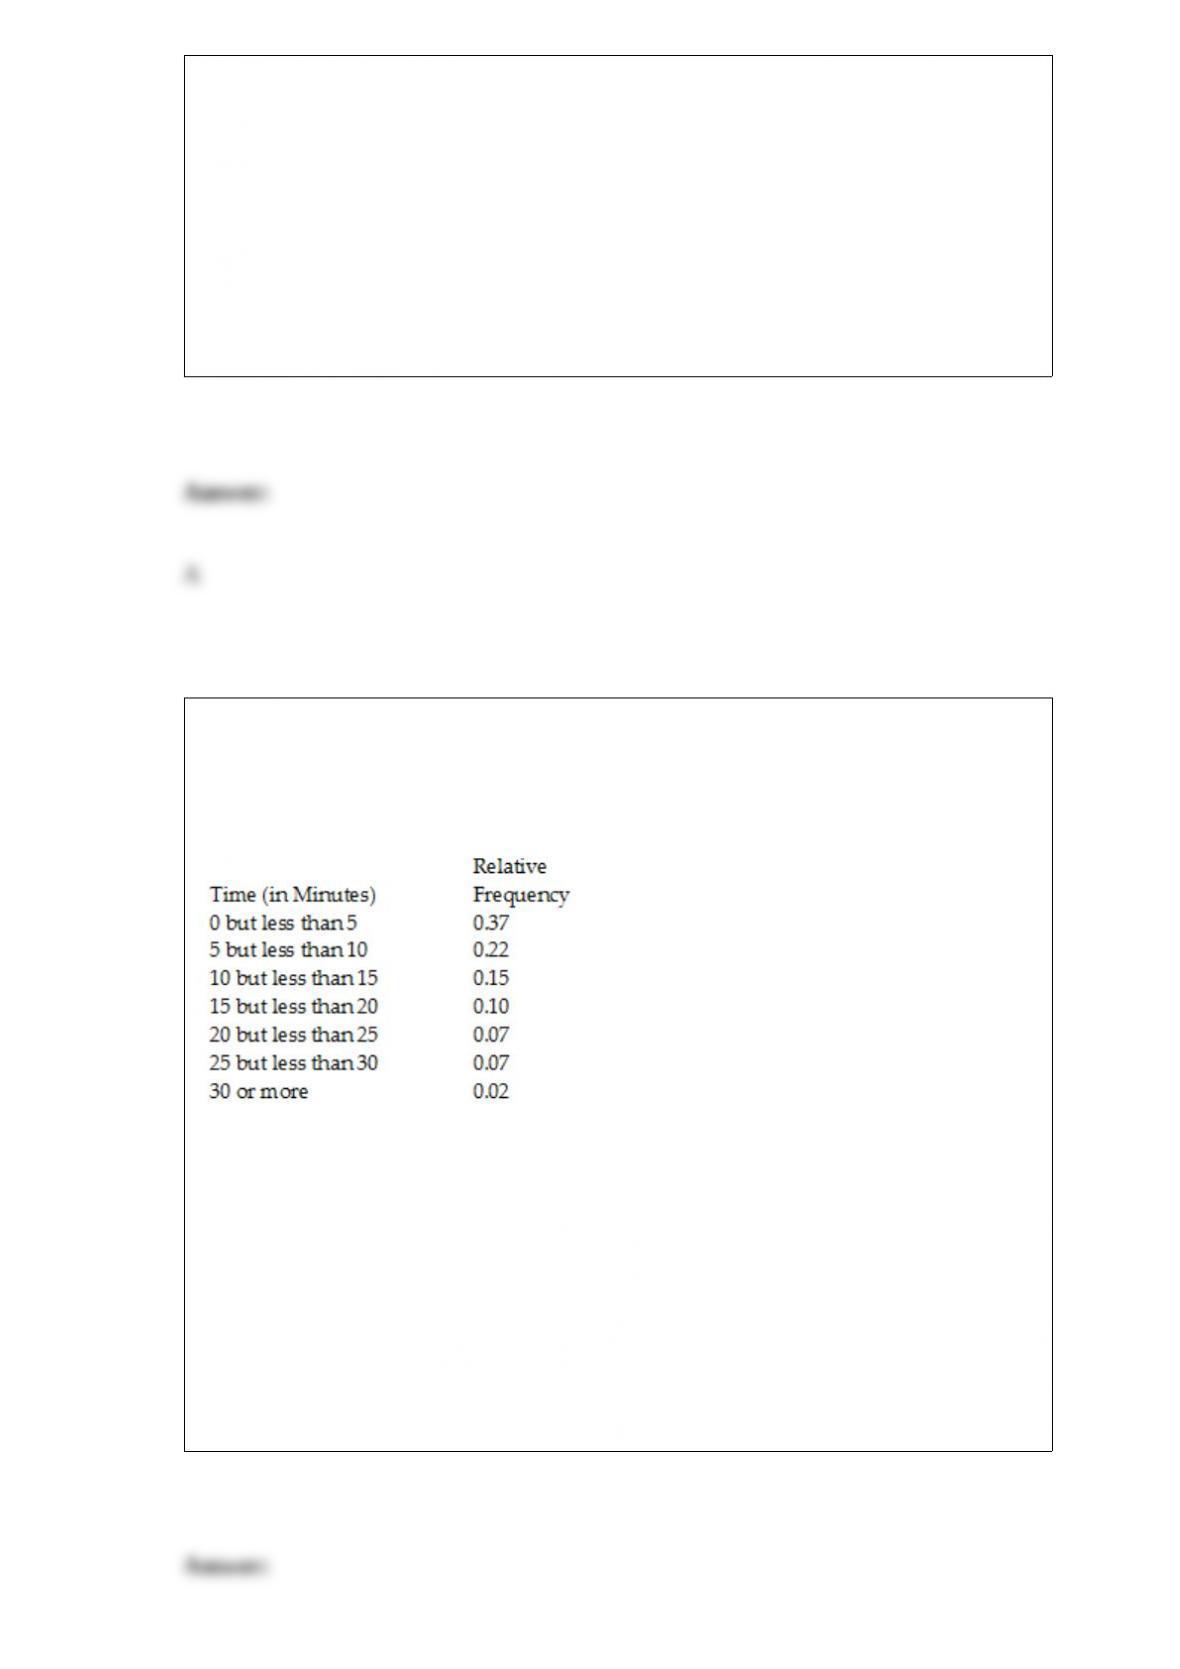
TABLE 2-5
The following are the duration in minutes of a sample of long-distance phone calls
made within the continental United States reported by one long-distance carrier.
Referring to Table 2-5, what is the cumulative relative frequency for the percentage of
calls that lasted under 20 minutes?
A) 0.10
B) 0.59
C) 0.76
D) 0.84

A study is under way in Yosemite National Forest to determine the adult height of
American pine trees. Specifically, the study is attempting to determine what factors aid
a tree in reaching heights greater than 60 feet tall. It is estimated that the forest contains
25,000 adult American pines. The study involves collecting heights from 250 randomly
selected adult American pine trees and analyzing the results. Identify the sample in the
study.
A) the 250 randomly selected adult American pine trees
B) the 25,000 adult American pine trees in the forest
C) all the adult American pine trees taller than 60 feet
D) all American pine trees, of any age, in the forest
Which of the following is appropriate for displaying data collected on the different
brands of cars students at a major university drive?
A) A Pareto chart
B) A two-way classification table
C) A histogram
D) A scatter plot
A political pollster randomly selects a sample of 100 voters each day for 8 successive
days and asks how many will vote for the incumbent. The pollster wishes to see if the
percentage favoring the incumbent candidate is too erratic. Which of the following
would be the most appropriate analysis to perform?
A) Multiple linear regression
B) Exponential smoothing
C) Construct a p-chart
D) Perform a Levene’s test
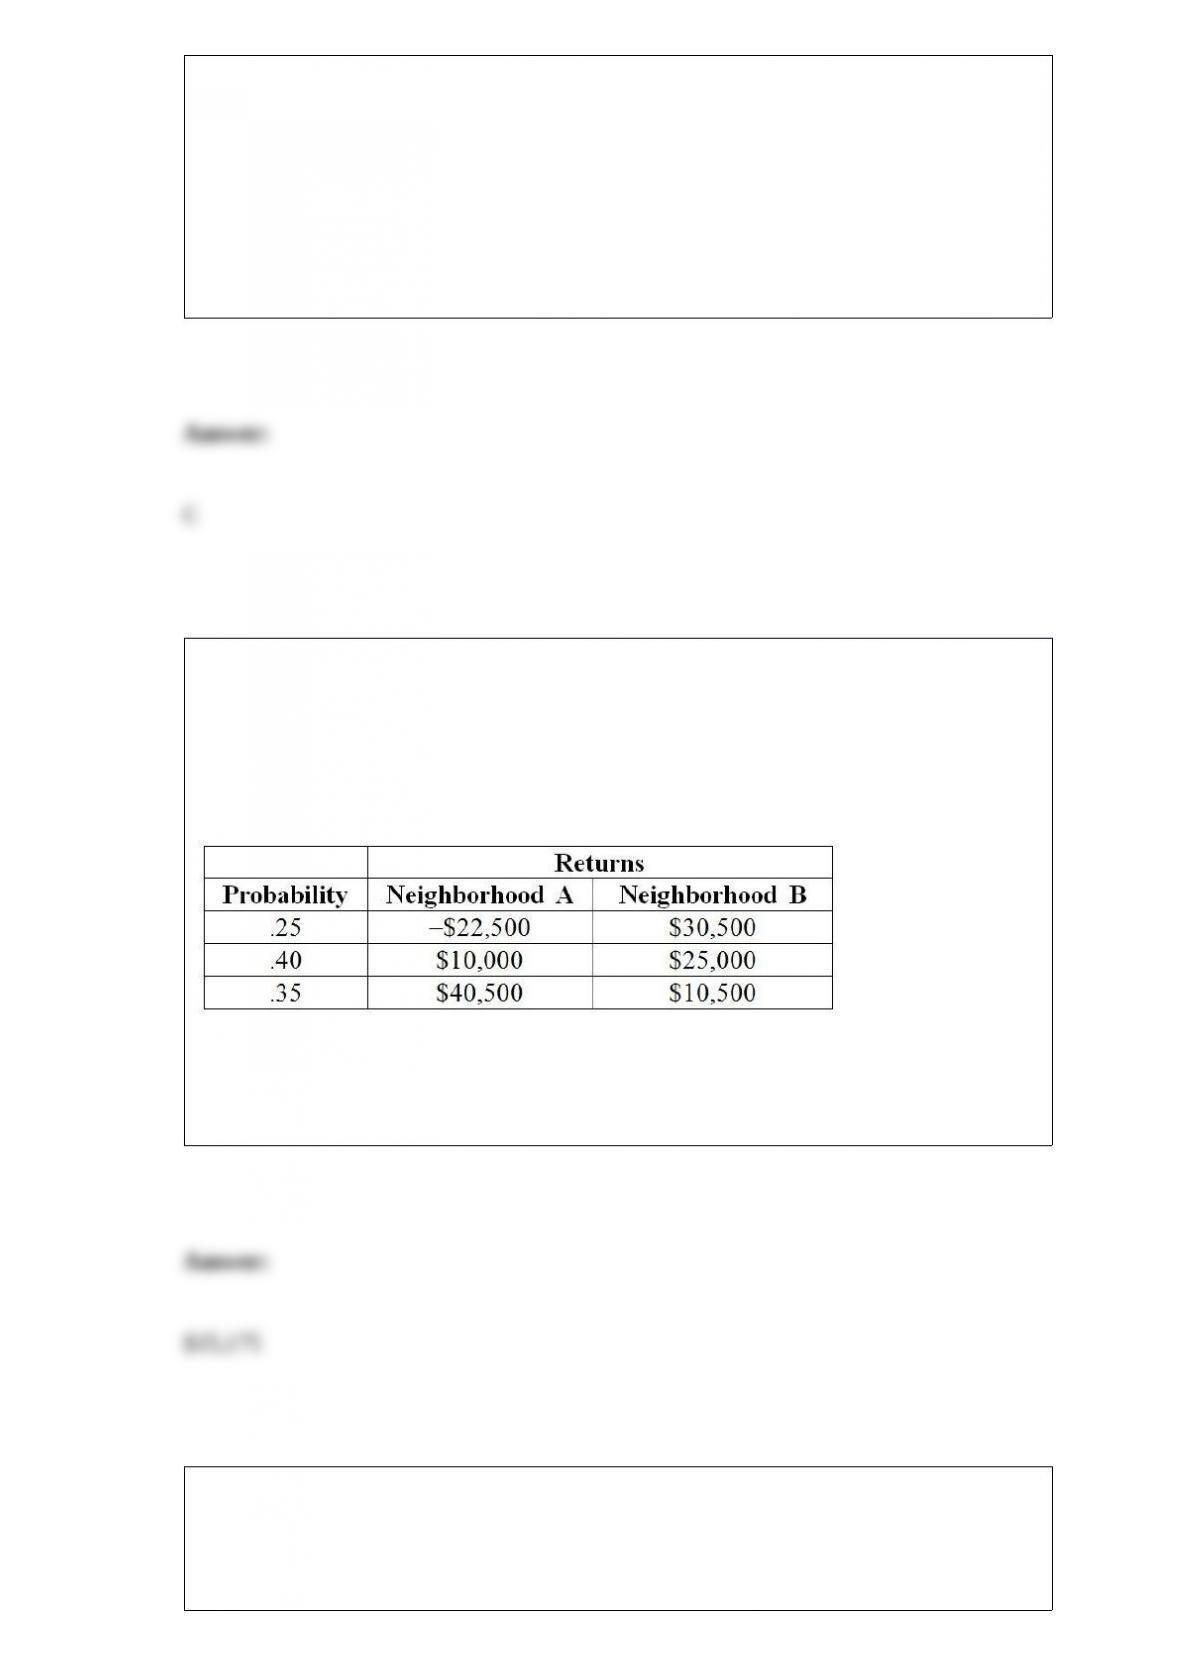
TABLE 5-7
There are two houses with almost identical characteristics available for investment in
two different neighborhoods with drastically different demographic composition. The
anticipated gain in value when the houses are sold in 10 years has the following
probability distribution:
Referring to Table 5-7, if you can invest 70% of your money on the house in
neighborhood A and the remaining on the house in neighborhood B, what is the
portfolio expected return of your investment?
TABLE 12-17
Three new different models of compact SUVs have just arrived at the market. You are
interested in comparing the gas mileage performance of all three models to see if they
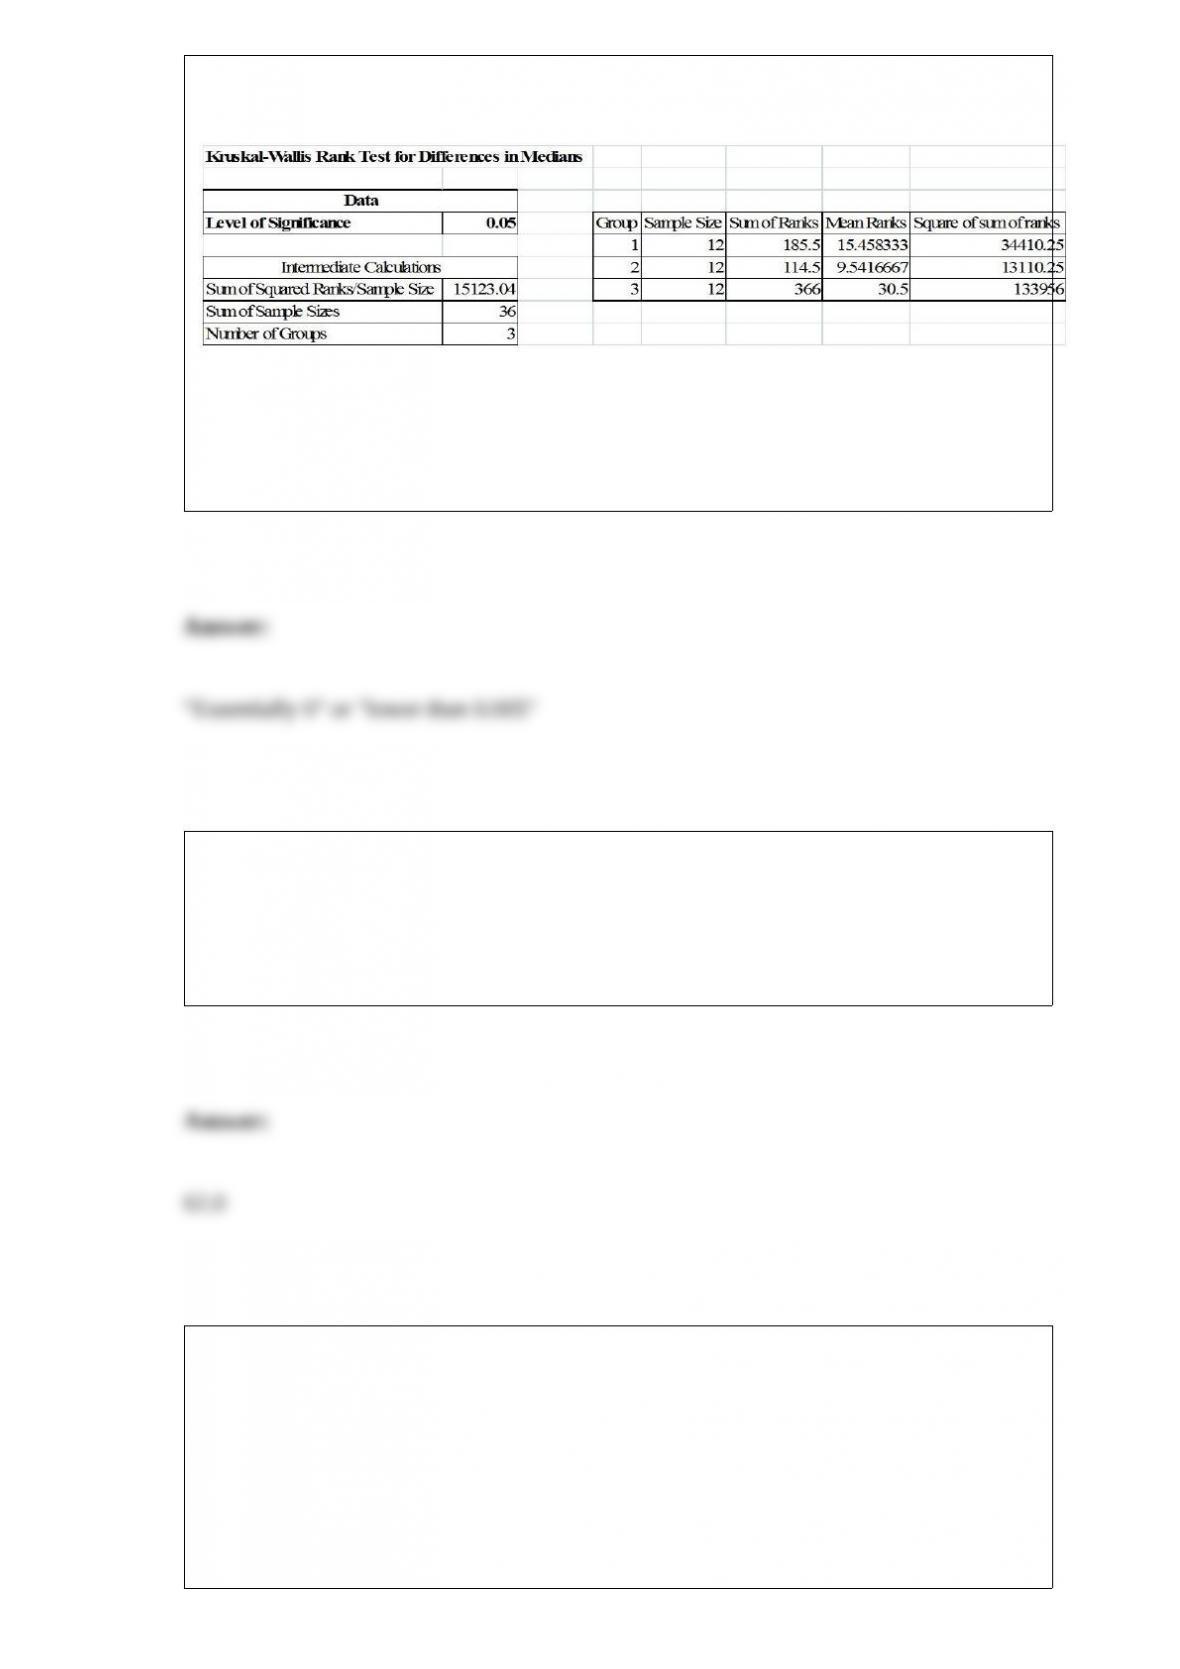
are the same. A partial computer output for twelve compact SUVs of each model is
given below:
You are told that the gas mileage population distributions for all three models are not
normally distributed.
Referring to Table 12-17, what is the p-value of the Kruskal-Wallis test statistic?
TABLE 16-5
The number of passengers arriving at San Francisco on the Amtrak cross-country
express on 6 successive Mondays were: 60, 72, 96, 84, 36, and 48.
Referring to Table 16-5, the number of arrivals will be exponentially smoothed with a
smoothing constant of 0.1. Then the forecast for the seventh Monday will be ________.
TABLE 3-3
The ordered array below represents the number of vitamin supplements sold by a health
food store in a sample of 16 days.
19, 19, 20, 20, 22, 23, 25, 26, 27, 30, 33, 34, 35, 36, 38, 41
Note: For this sample, the sum of the values is 448, and the sum of the squared
differences between each value and the mean is 812.

Referring to Table 3-3, the skewness statistic of the number of vitamin supplements
sold in this sample is ________.
TABLE 8-10
A sales and marketing management magazine conducted a survey on salespeople
cheating on their expense reports and other unethical conduct. In the survey on 200
managers, 58% of the managers have caught salespeople cheating on an expense report,
50% have caught salespeople working a second job on company time, 22% have caught
salespeople listing a ‘strip bar” as a restaurant on an expense report, and 19% have
caught salespeople giving a kickback to a customer.
Referring to Table 8-10, the sampling error of a 95% confidence interval estimate of the
population proportion of managers who have caught salespeople giving a kickback to a
customer is ________.
TABLE 17-11
A logistic regression model was estimated in order to predict the probability that a
randomly chosen university or college would be a private university using information
on mean total Scholastic Aptitude Test score (SAT) at the university or college, the
room and board expense measured in thousands of dollars (Room/Brd), and whether the
TOEFL criterion is at least 550 (Toefl550 = 1 if yes, 0 otherwise.) The dependent
variable, Y, is school type (Type = 1 if private and 0 otherwise).
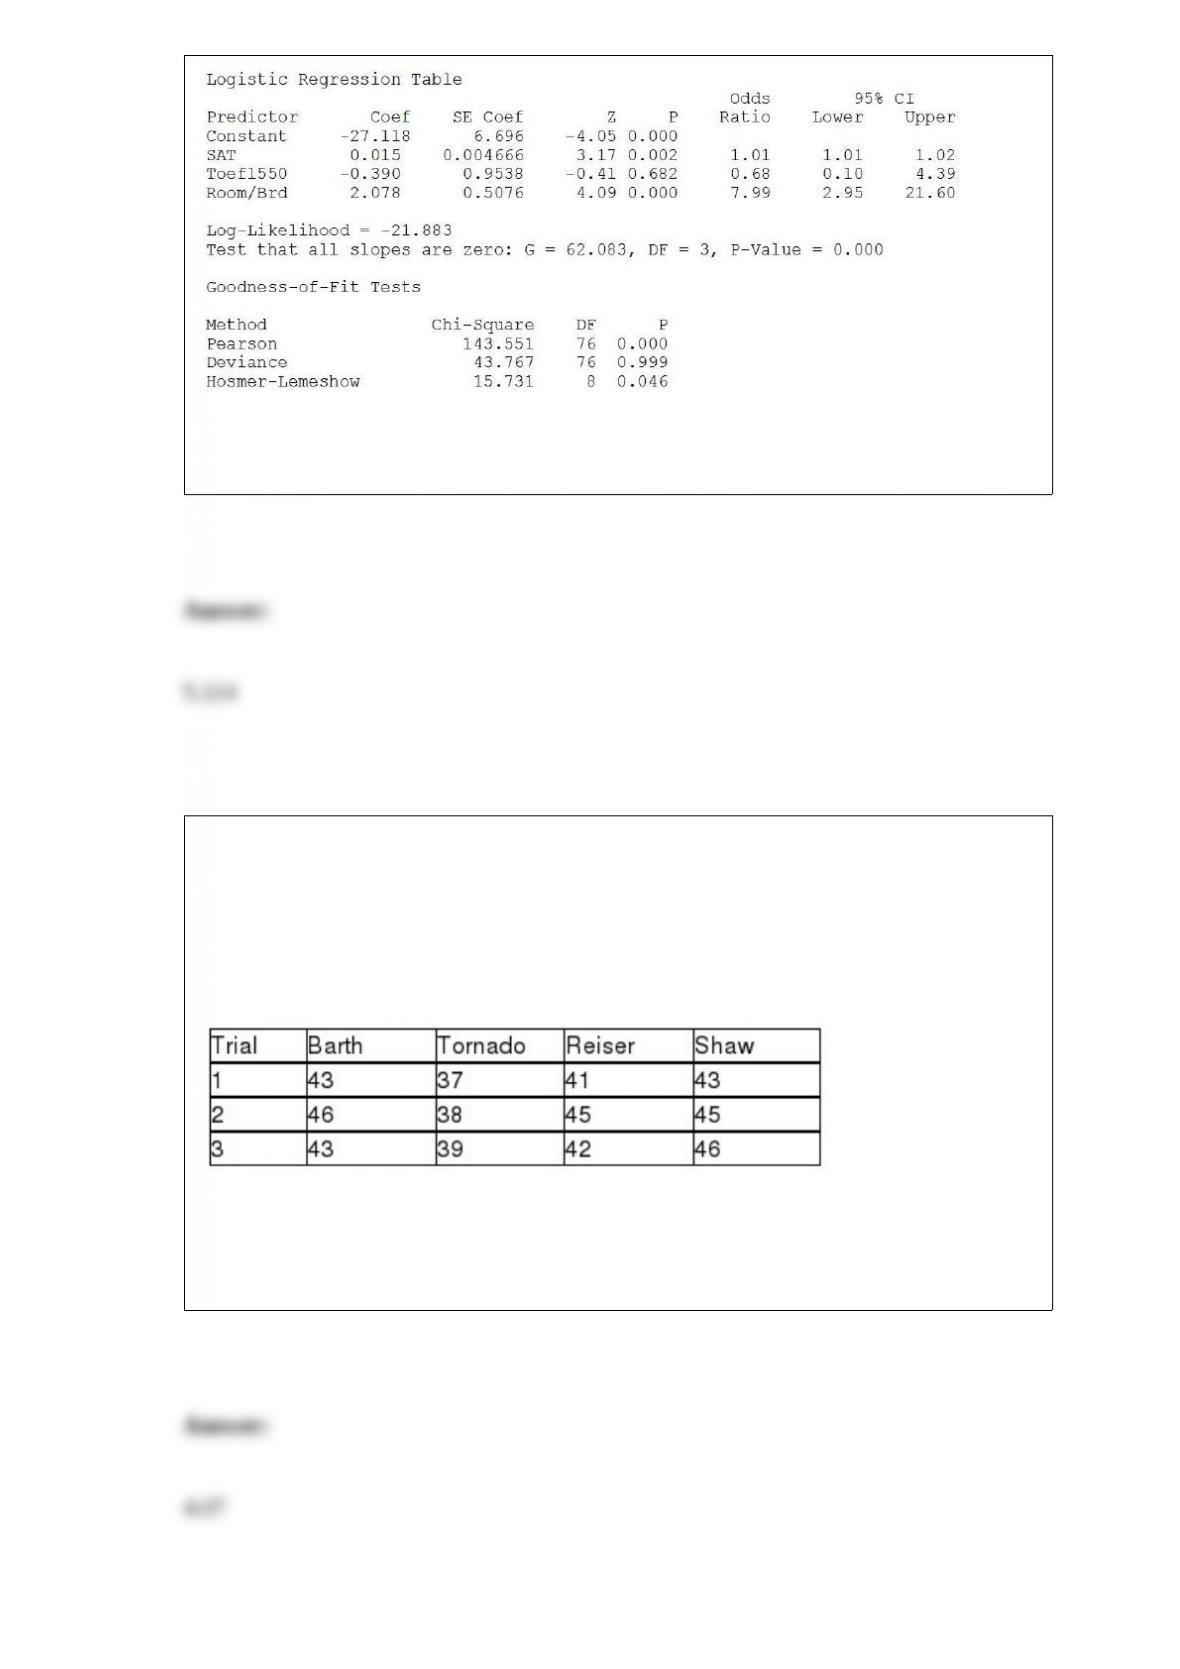
Referring to Table 17-11, what is the estimated odds ratio for a school with a mean SAT
score of 1250, a TOEFL criterion that is at least 550, and the room and board expense
of 5 thousand dollars?
TABLE 11-3
As part of an evaluation program, a sporting goods retailer wanted to compare the
downhill coasting speeds of 4 brands of bicycles. She took 3 of each brand and
determined their maximum downhill speeds. The results are presented in miles per hour
in the table below.
Referring to Table 11-3, the null hypothesis that the mean downhill coasting speeds of
the 4 brands of bicycles are equal will be rejected at a level of significance of 0.05 if the
value of the test statistic is greater than ________.
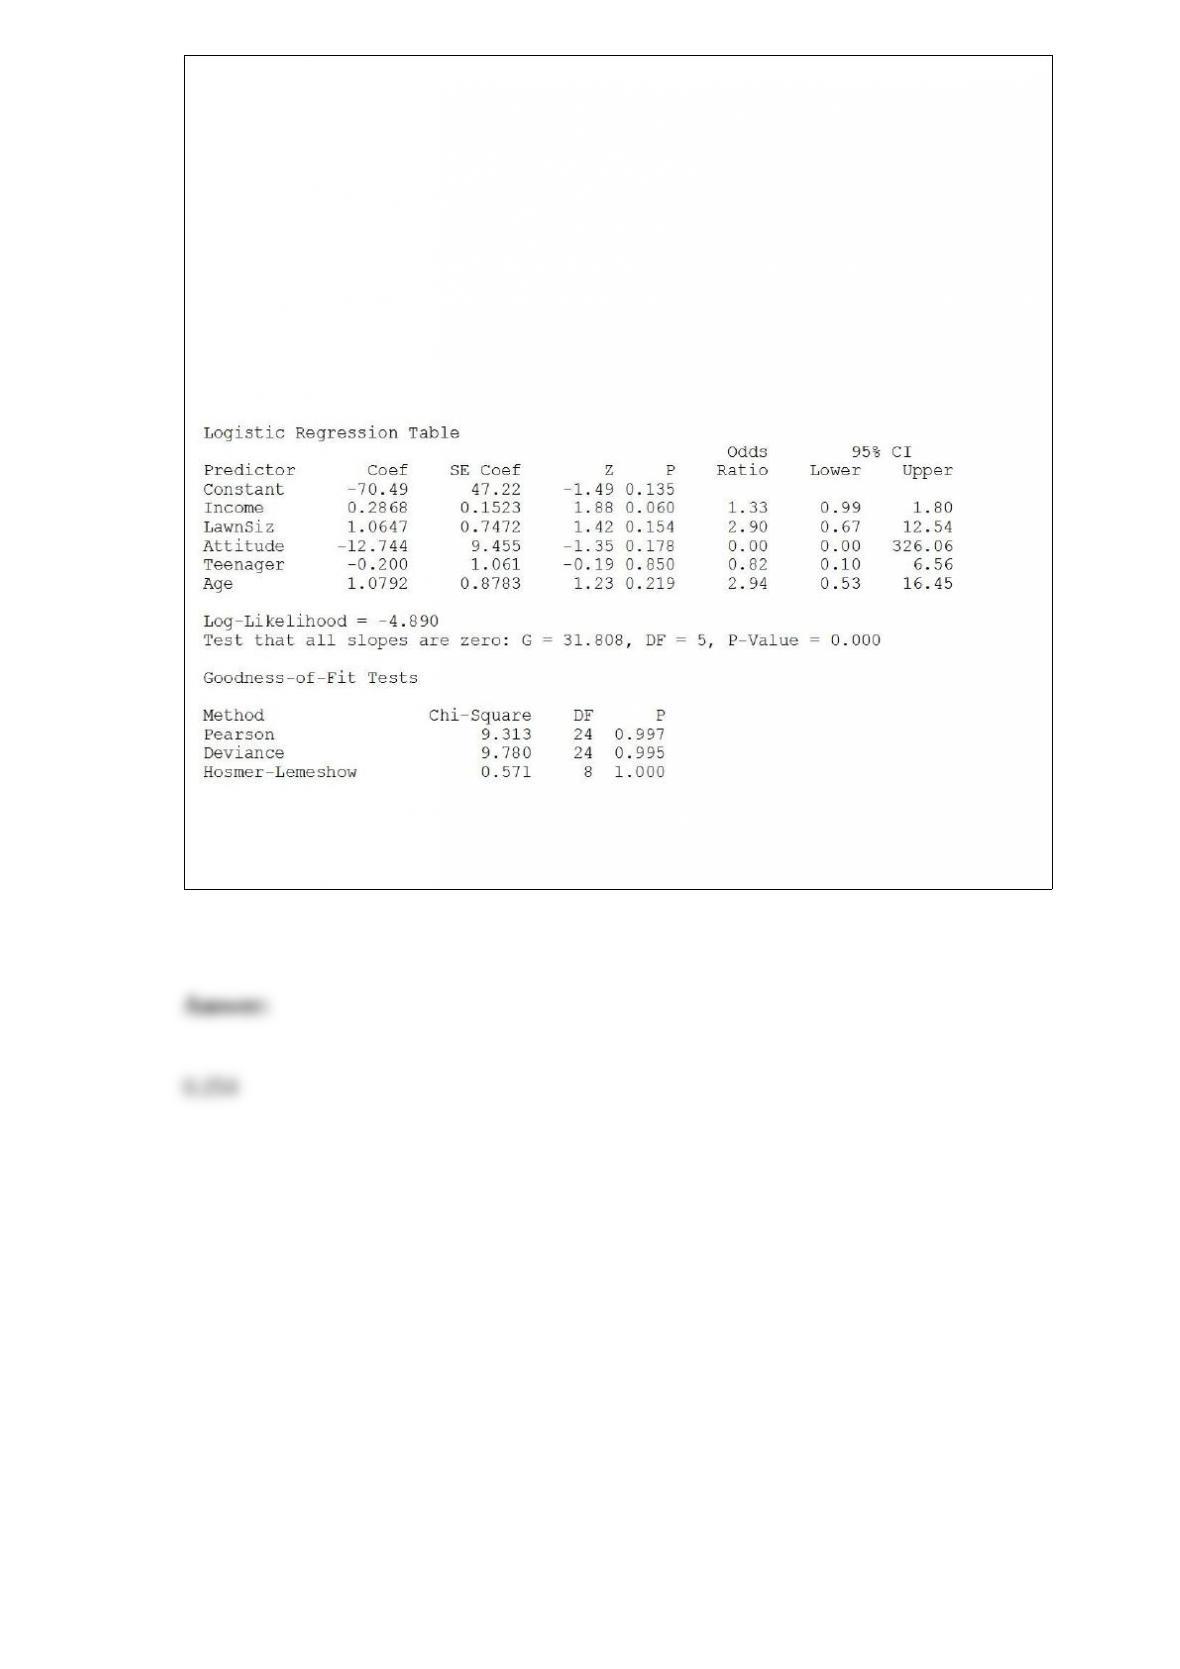
TABLE 17-12
The marketing manager for a nationally franchised lawn service company would like to
study the characteristics that differentiate home owners who do and do not have a lawn
service. A random sample of 30 home owners located in a suburban area near a large
city was selected; 15 did not have a lawn service (code 0) and 15 had a lawn service
(code 1). Additional information available concerning these 30 home owners includes
family income (Income, in thousands of dollars), lawn size (Lawn Size, in thousands of
square feet), attitude toward outdoor recreational activities (Attitude 0 = unfavorable, 1
= favorable), number of teenagers in the household (Teenager), and age of the head of
the household (Age).
The Minitab output is given below:
Referring to Table 17-12, what is the p-value of the test statistic when testing whether
LawnSize makes a significant contribution to the model in the presence of the other
independent variables?