TABLE 15-6
Given below are results from the regression analysis on 40 observations where the
dependent variable is the number of weeks a worker is unemployed due to a layoff (Y)
and the independent variables are the age of the worker (X1), the number of years of
education received (X2), the number of years at the previous job (X3), a dummy variable
for marital status (X4: 1 = married, 0 = otherwise), a dummy variable for head of
household (X5: 1 = yes, 0 = no) and a dummy variable for management position (X6: 1
= yes, 0 = no).
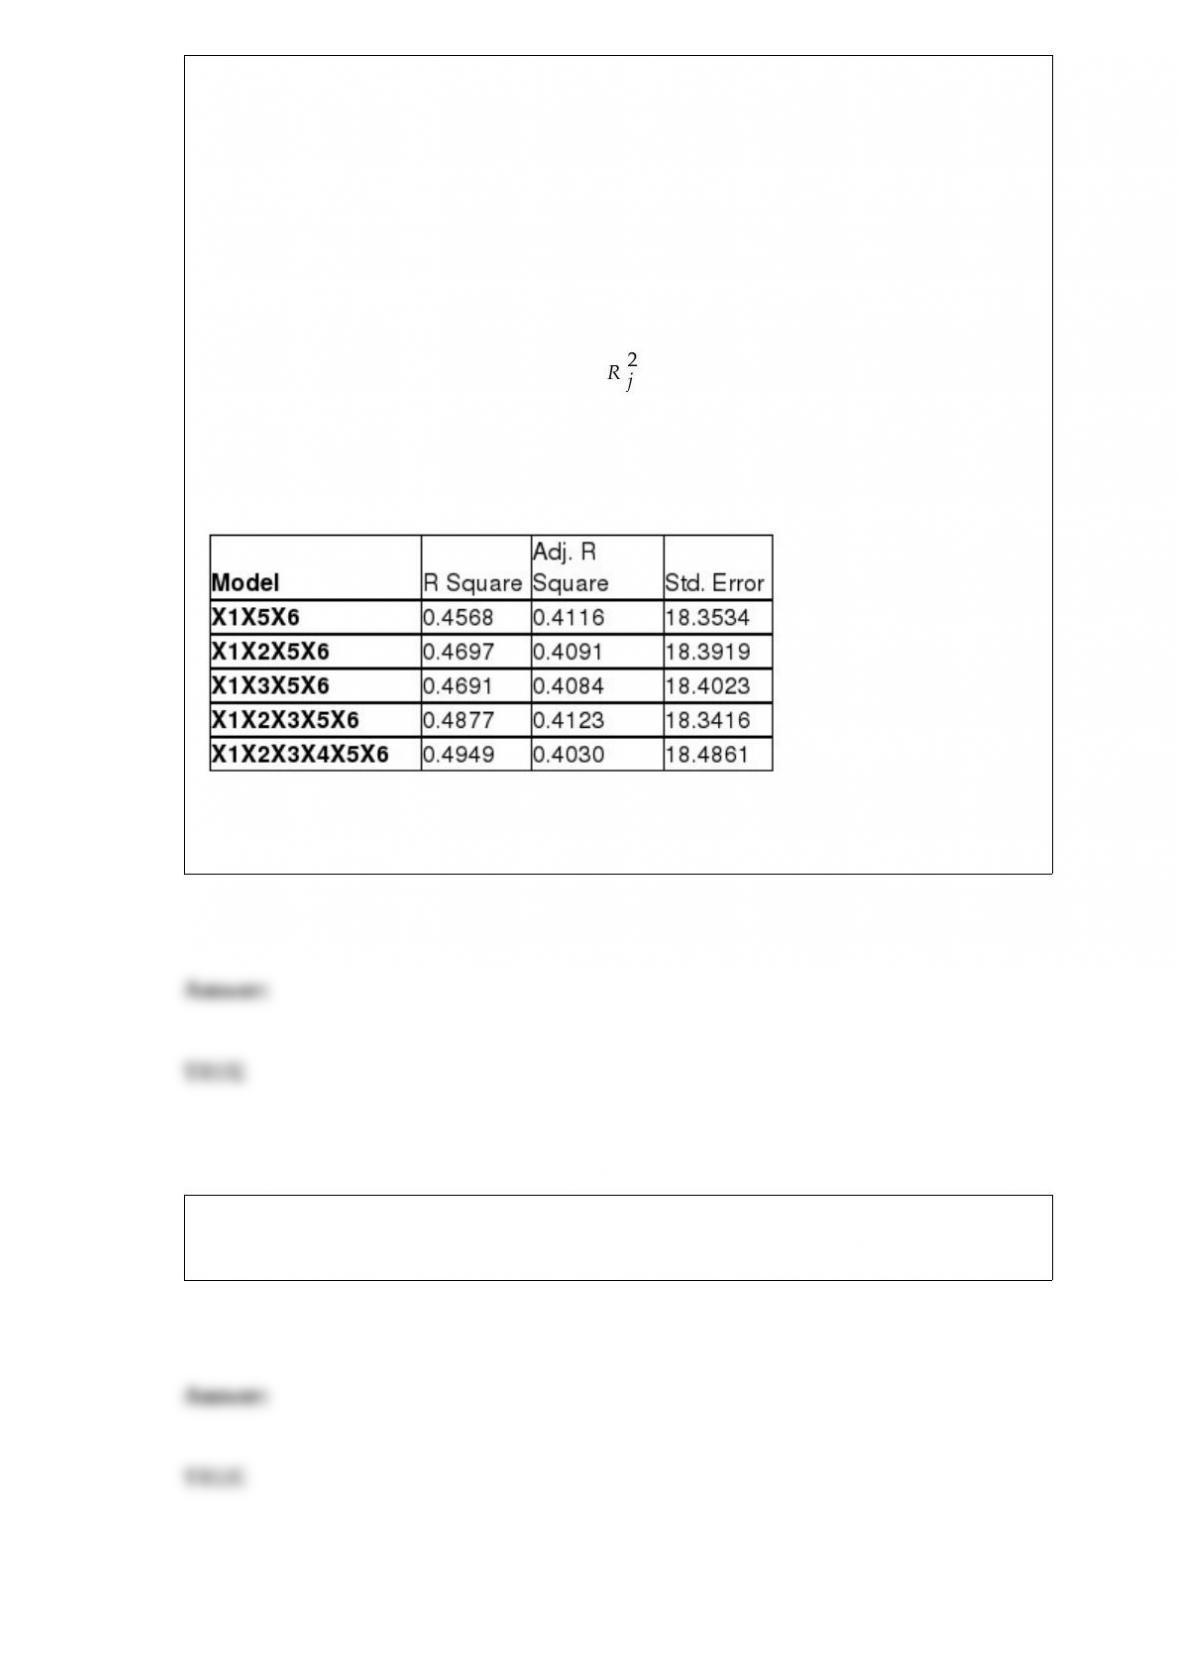
The coefficient of multiple determination ( ) for the regression model using each of
the 6 variables Xj as the dependent variable and all other X variables as independent
variables are, respectively, 0.2628, 0.1240, 0.2404, 0.3510, 0.3342 and 0.0993.
The partial results from best-subset regression are given below:
True or False: Referring to Table 15-6, the model that includes X1, X2, X3, X5 and X6
should be among the appropriate models using the Mallow’s Cp statistic.
True or False: The probability that a standard normal variable, Z, is between 1.50 and
2.10 is the same as the probability Z is between -2.10 and -1.50.

True or False: The difference between the upper limit of a confidence interval and the
point estimate used in constructing the confidence interval is called the sampling error.
True or False: The amount of calories contained in a 12-ounce package of cheese will
be measured on a ratio scale.
TABLE 8-17
A random sample of 100 stores from a large chain of 500 garden supply stores was
selected to determine the mean number of lawnmowers sold at an end-of-season
clearance sale. The sample results indicated a mean of 6 and a standard deviation of 2
lawnmowers sold. A 95% confidence interval (5.623 to 6.377) was established based on
these results.
True or False: Referring to Table 8-17, there are 10 possible samples of 100 stores that
can be selected out of the population of 1,000 stores.
True or False: TABLE 19-6
A student wanted to find out the optimal strategy to study for a Business Statistics
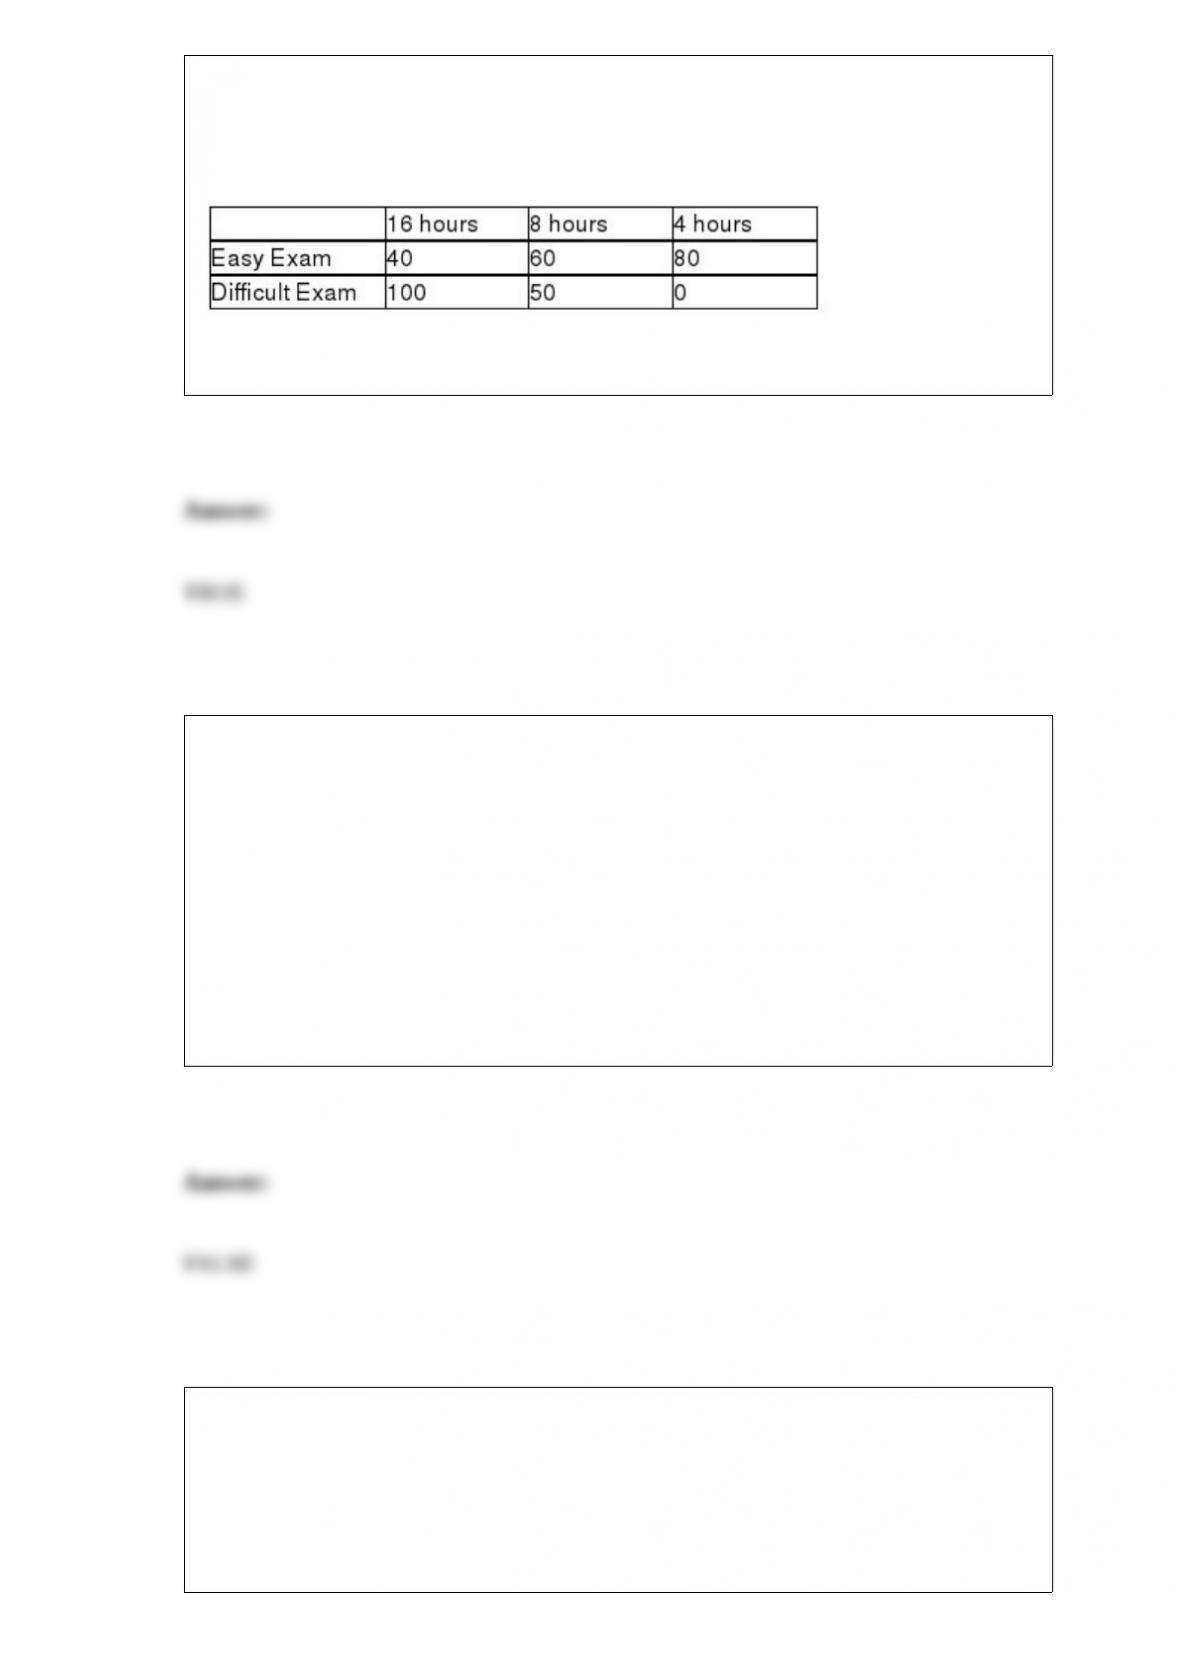
exam. He constructed the following payoff table based on the mean amount of time he
needed to study every week for the course and the degree of difficulty of the exam.
From the information that he gathered from students who had taken the course, he
concluded that there was a 40% probability that the exam would be easy.
Referring to Table 19-6, the optimal strategy using the maximax criterion is to study 16
hours per week on average for the exam.
TABLE 9-6
The quality control engineer for a furniture manufacturer is interested in the mean
amount of force necessary to produce cracks in stressed oak furniture. She performs a
two-tail test of the null hypothesis that the mean for the stressed oak furniture is 650.
The calculated value of the Z test statistic is a positive number that leads to a p-value of
0.080 for the test.
True or False: Referring to Table 9-6, if the test is performed with a level of
significance of 0.10, the engineer can conclude that the mean amount of force necessary
to produce cracks in stressed oak furniture is 650.
TABLE 14-18
A logistic regression model was estimated in order to predict the
probability that a randomly chosen university or college would be a
private university using information on mean total Scholastic Aptitude
Test score (SAT) at the university or college and whether the TOEFL

criterion is at least 90 (Toe90 = 1 if yes, 0 otherwise). The
dependent variable, Y, is school type (Type = 1 if private and 0
otherwise).
The PHStat output is given below:
True or False: Referring to Table 14-18, there is not enough evidence
to conclude that SAT score makes a signiticant contribution to the
model in the presence of Toe90 at a 0.05 level of signiticance.
True or False: As a general rule, a value is considered an extreme value if its Z score is
greater than -3.
True or False: To determine the probability of getting at least 3 events of interest in a
binomial distribution, you will find the area under the normal curve for X = 2.5 and
above.

TABLE 14-17
Given below are results from the regression analysis where the
dependent variable is the number of weeks a worker is unemployed
due to a layo3 (Unemploy) and the independent variables are the age
of the worker (Age) and a dummy variable for management position
(Manager: 1 = yes, 0 = no).
The results of the regression analysis are given below:
True or False: Referring to Table 14-17, the null hypothesis H0 : β1 =
β2 = 0 implies that the number of weeks a worker is unemployed due
to a layo3 is not affected by any of the explanatory variables.

True or False: If a set of data is perfectly symmetrical, the arithmetic mean must be
identical to the median.
True or False: The difference between the sample size and the population size is called
the sampling error.
The value of the cumulative standardized normal distribution at Z is 0.8770. The value
of Z is
A) 0.18.
B) 0.81.
C) 1.16.
D) 1.47.
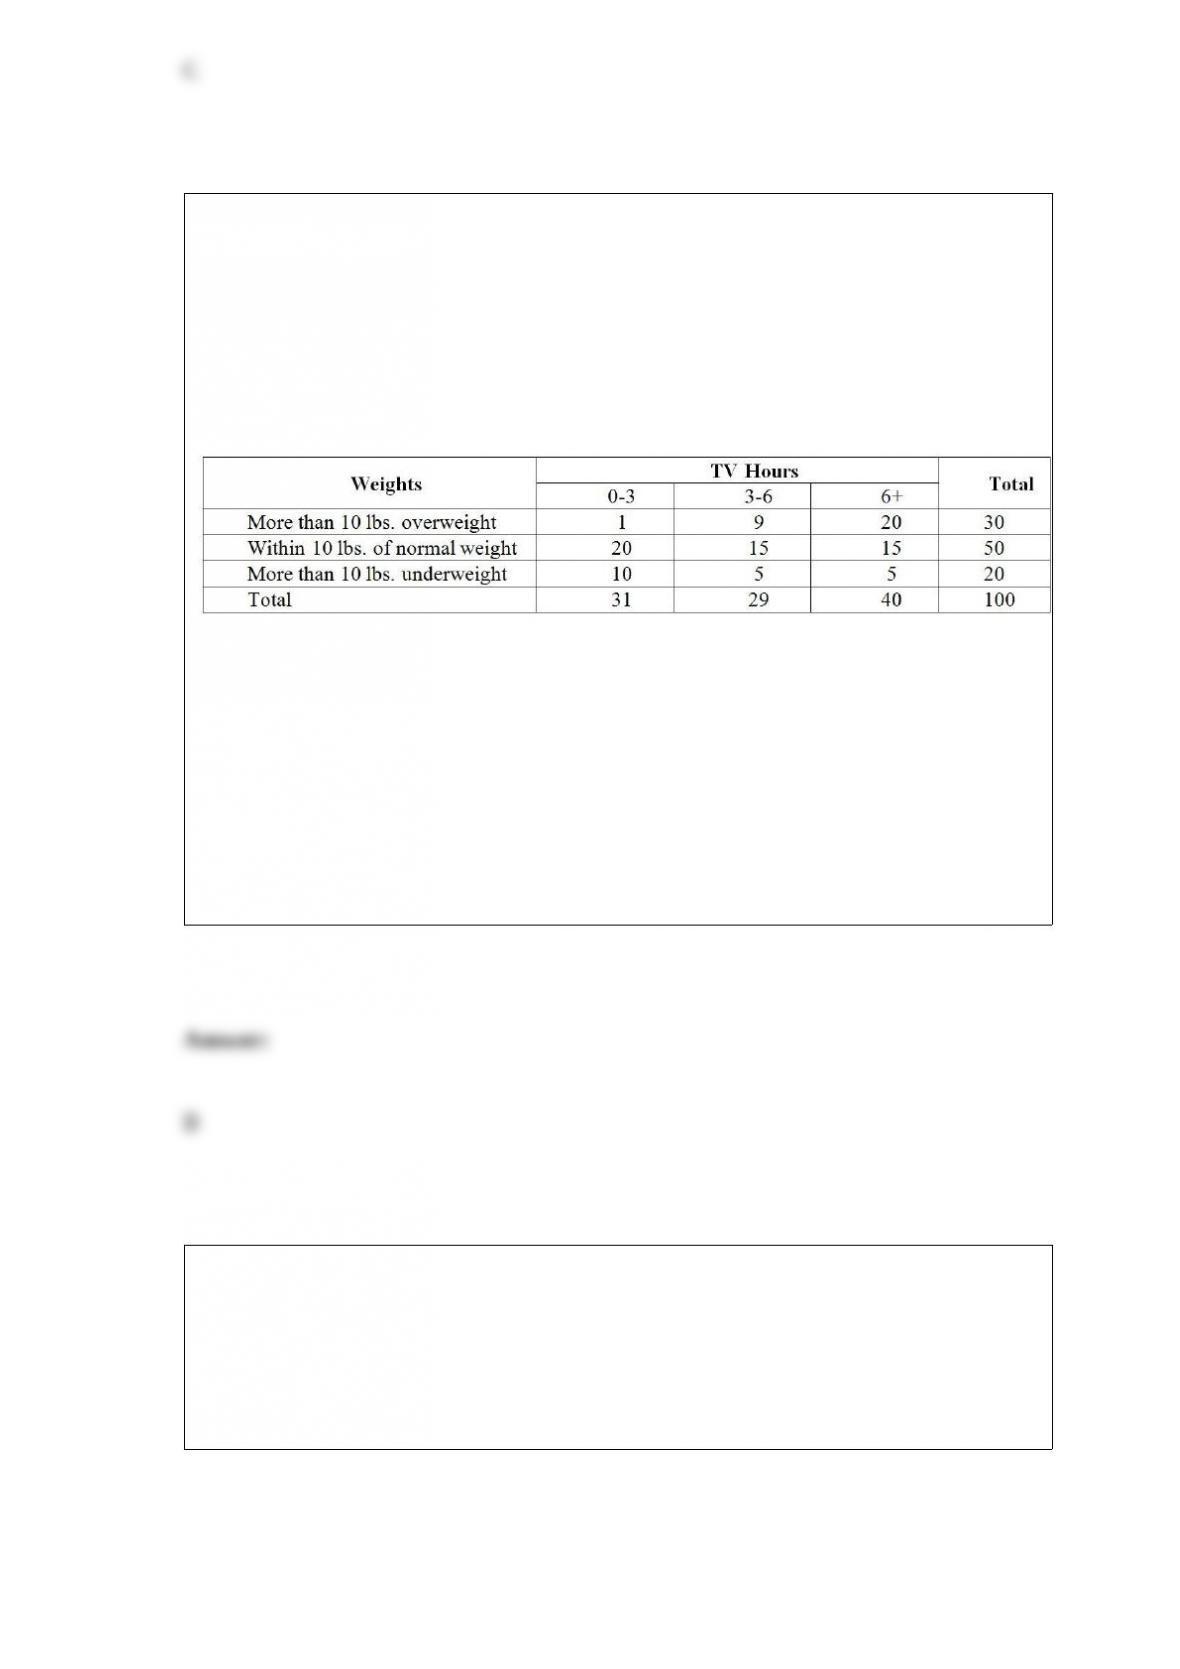
TABLE 12-13
Recent studies have found that American children are more obese than in the past. The
amount of time children spent watching television has received much of the blame. A
survey of 100 ten-year-olds revealed the following with regards to weights and average
number of hours a day spent watching television. We are interested in testing whether
the mean number of hours spent watching TV and weights are independent at 1% level
of significance.
Referring to Table 12-13, the critical value of the test will be
A) 6.635.
B) 13.277.
C) 14.860.
D) 21.666.
TABLE 17-1
A real estate builder wishes to determine how house size (House) is influenced by
family income (Income), family size (Size), and education of the head of household
(School). House size is measured in hundreds of square feet, income is measured in
thousands of dollars, and education is in years. The builder randomly selected 50
families and ran the multiple regression. Microsoft Excel output is provided below:
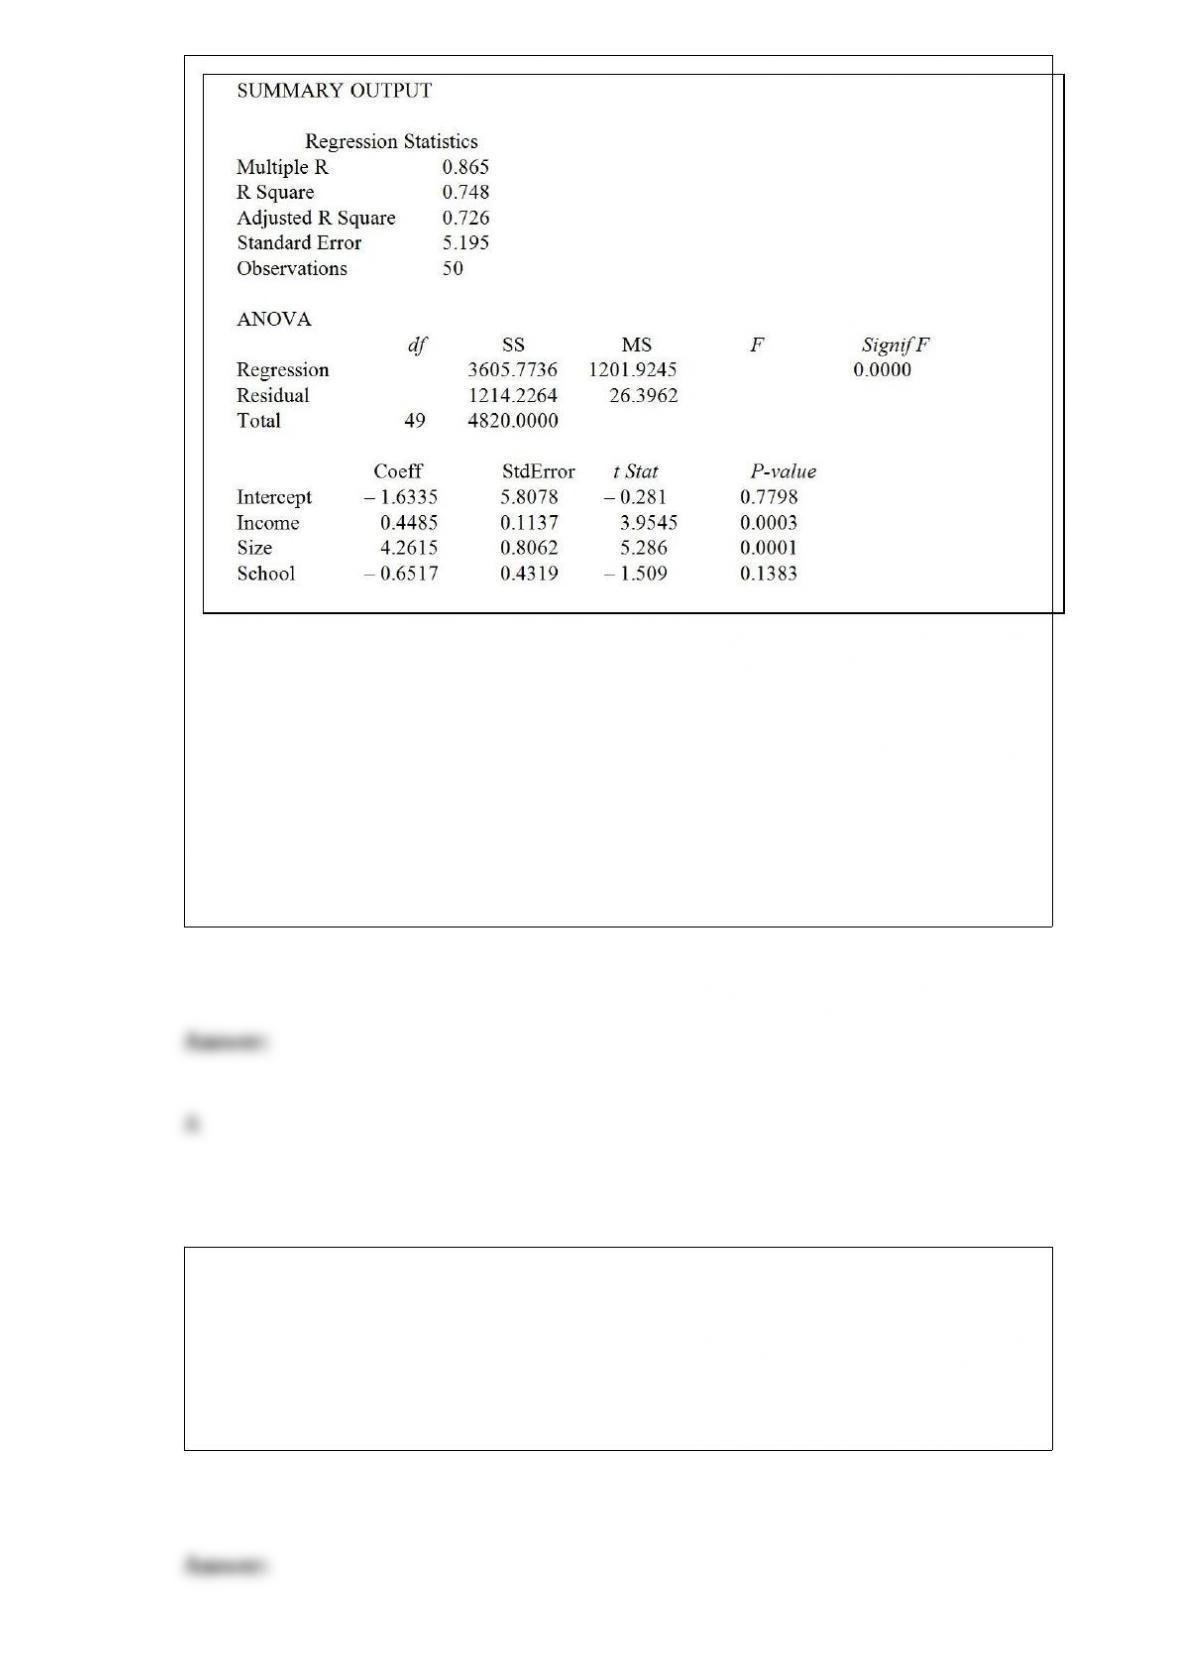
Referring to Table 17-1, at the 0.01 level of significance, what conclusion should the
builder reach regarding the inclusion of Income in the regression model?
A) Income is significant in explaining house size and should be included in the model
because its p-value is less than 0.01.
B) Income is significant in explaining house size and should be included in the model
because its p-value is more than 0.01.
C) Income is not significant in explaining house size and should not be included in the
model because its p-value is less than 0.01.
D) Income is not significant in explaining house size and should not be included in the
model because its p-value is more than 0.01.
A process is said to be out of control if
A) a point falls above the upper or below the lower control lines.
B) eight or more consecutive points fall above the center line or eight or more
consecutive points fall below the center line.
C) Either of the above.
D) None of the above.
An entrepreneur is considering the purchase of a coin-operated laundry. The current
owner claims that over the past 5 years, the mean daily revenue was $675 with a
standard deviation of $75. A sample of 30 days reveals a daily mean revenue of $625
and a standard deviation of $70. Which of the following tests will be the most
appropriate?
A) t test for the mean
B) Z test for the proportion
C) Pooled-variance t test
D) Separate-variance t test
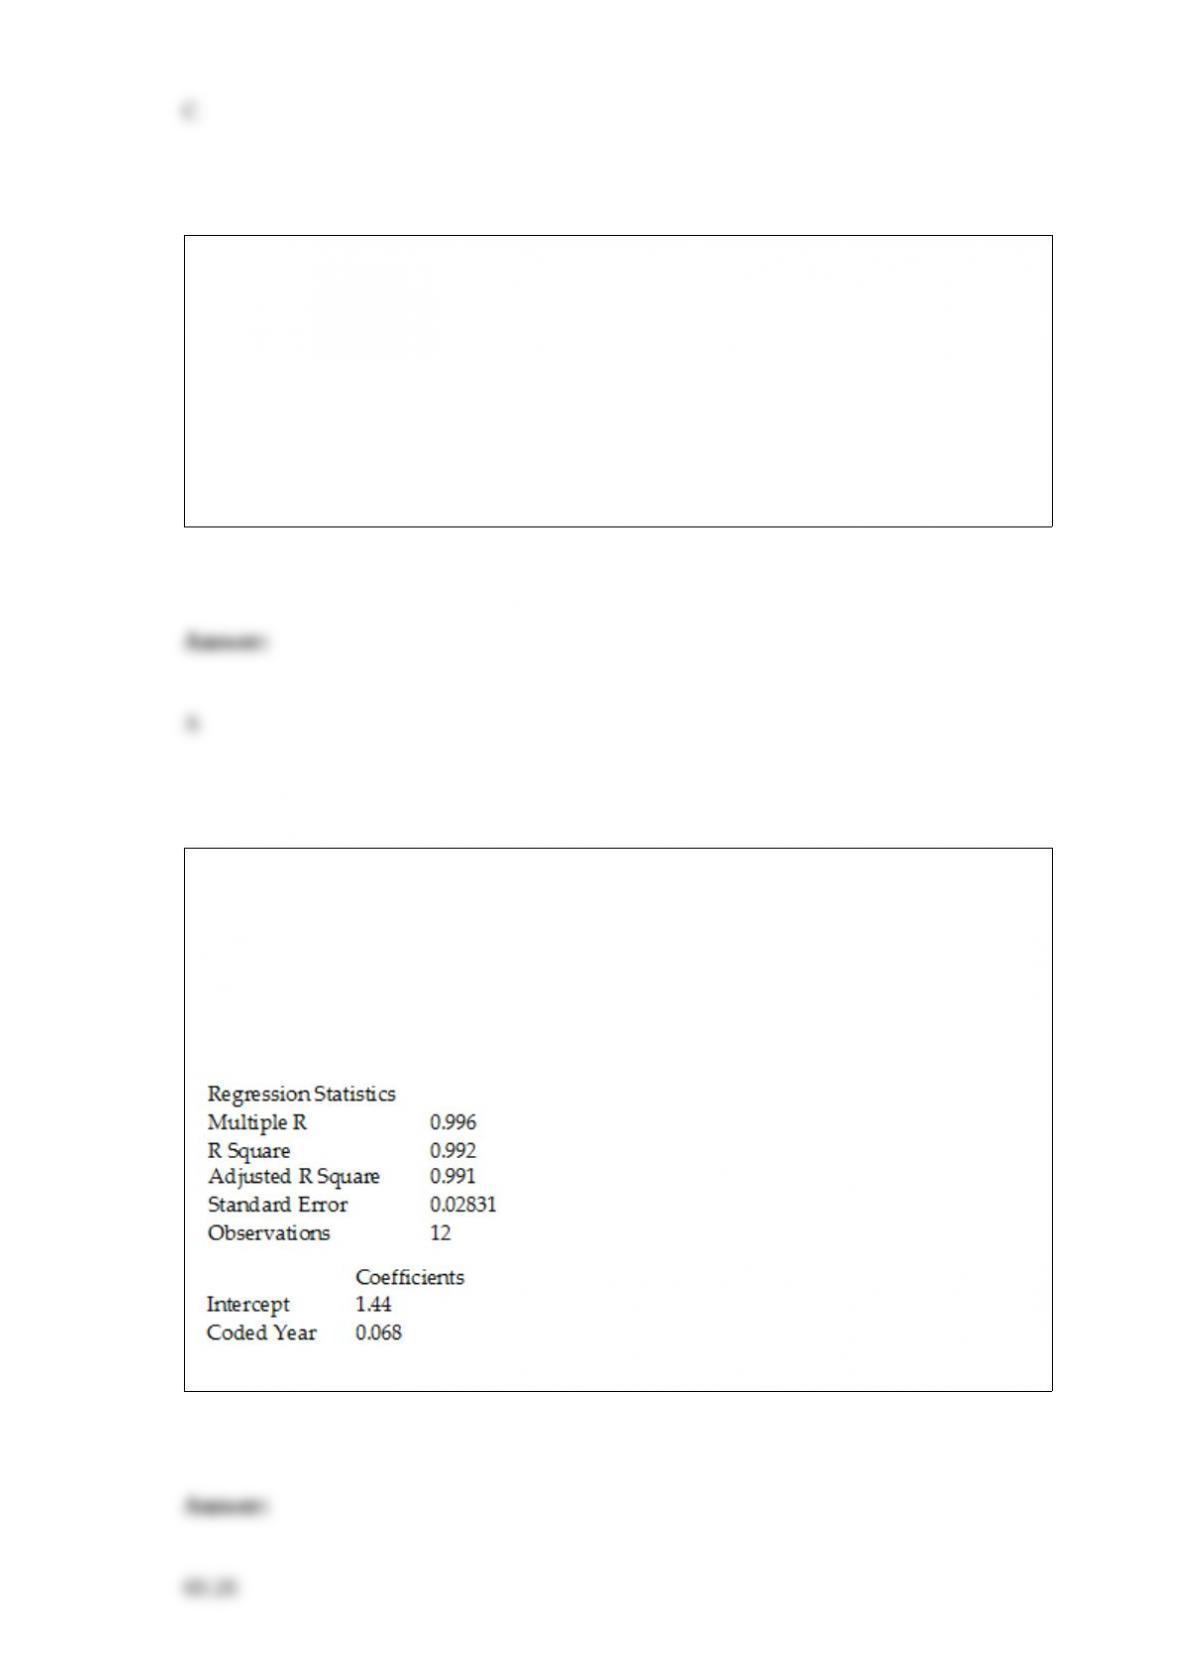
TABLE 16-7
The executive vice-president of a drug manufacturing firm believes that the demand for
the firm’s most popular drug has been evidencing an exponential trend since 1999. She
uses Microsoft Excel to obtain the partial output below. The dependent variable is the
log base 10 of the demand for the drug, while the independent variable is years, where
1999 is coded as 0, 2000 is coded as 1, etc.
SUMMARY OUTPUT
Referring to Table 16-7, the fitted trend value for 2004 is ________.

If we wish to determine whether there is evidence that the proportion of items of
interest is the same in group 1 as in group 2, the appropriate test to use is
A) the Z test.
B) the X2 test.
C) Both A and B.
D) Neither A nor B.
When testing for independence in a contingency table with 3 rows and 4 columns, there
are ________ degrees of freedom.
A) 5
B) 6
C) 7
D) 12
Which of the following is the easiest to compute?
A) the arithmetic mean
B) the median
C) the mode
D) the geometric mean
The sample correlation coefficient between X and Y is 0.375. It has been found out that
the p-value is 0.256 when testing H0 : = 0 against the two-sided alternative H1 :
0. To test H0 : = 0 against the one-sided alternative H1 : < 0 at a significance level of
0.1, the p-value is
A) 0.256 / 2.
B) (0.256) 2.
C) 1 – 0.256.
D) 1 – 0.256 / 2.
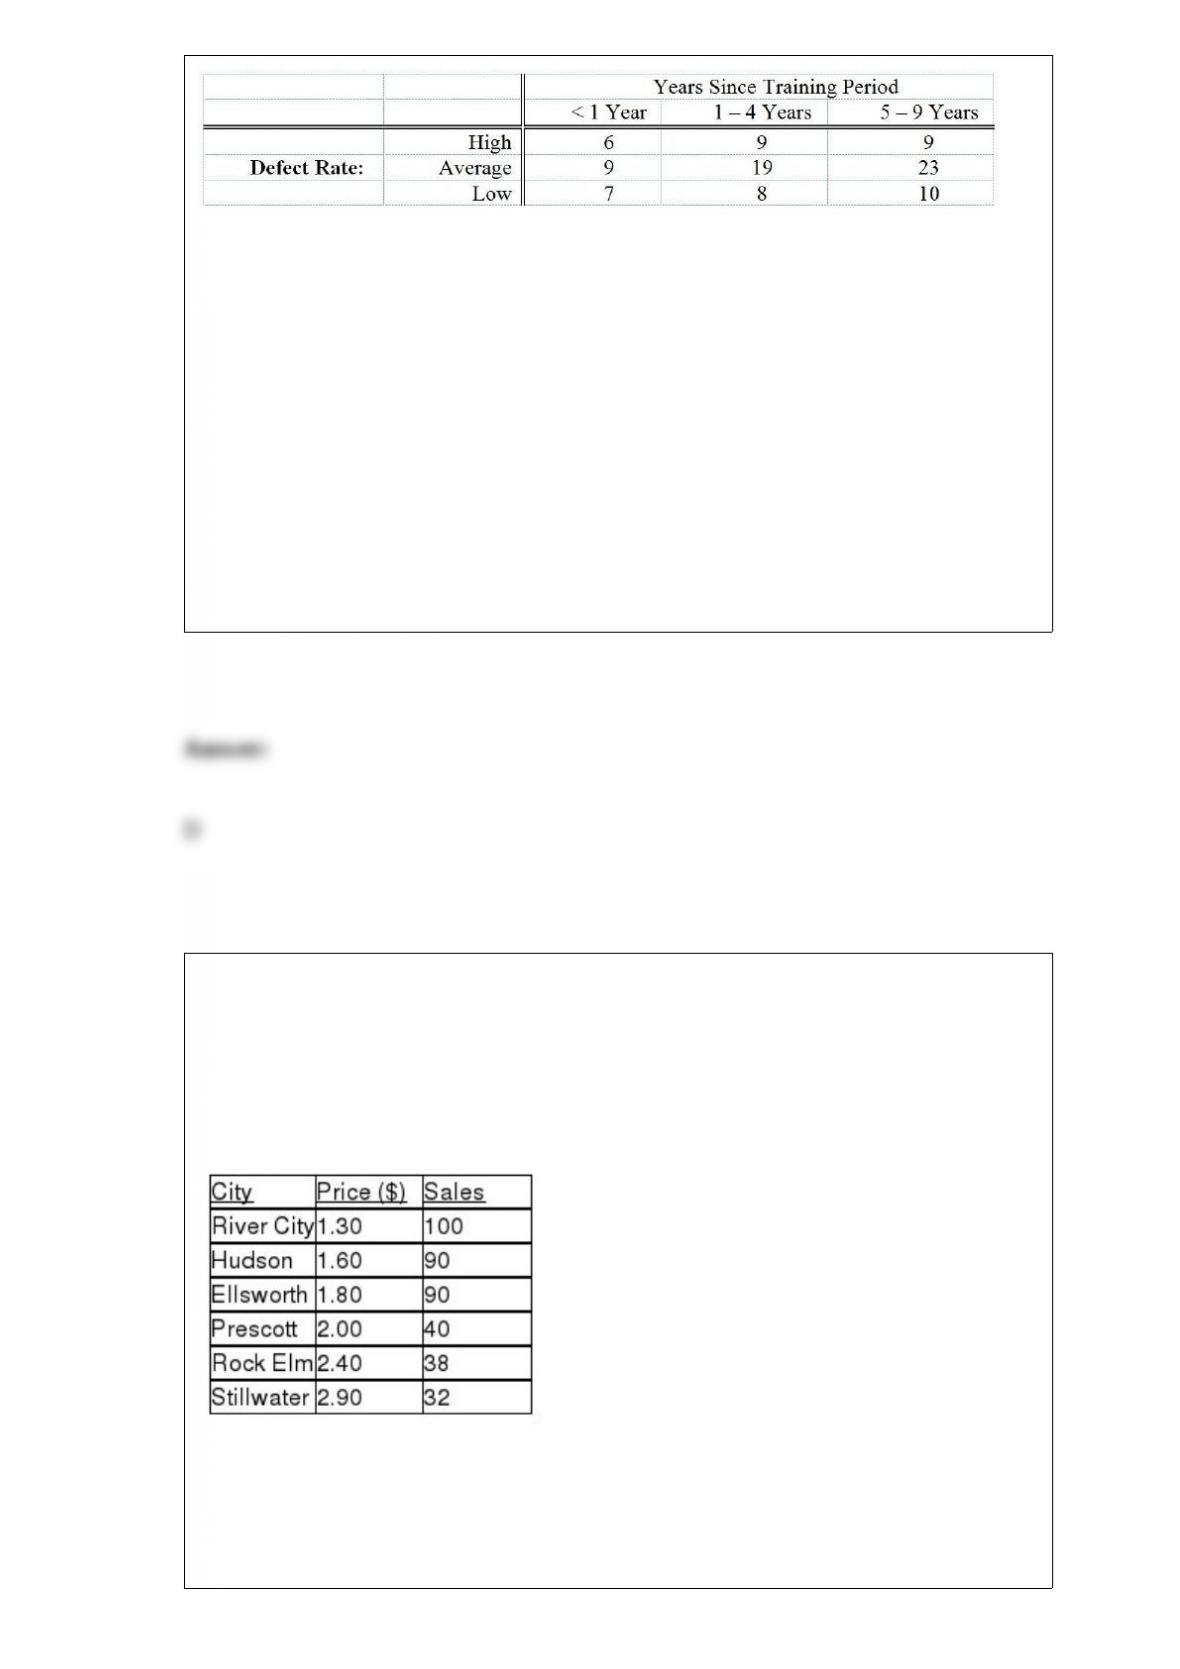
TABLE 12-10
One criterion used to evaluate employees in the assembly section of a large factory is
the number of defective pieces per 1,000 parts produced. The quality control
department wants to find out whether there is a relationship between years of
experience and defect rate. Since the job is repetitious, after the initial training period
any improvement due to a learning effect might be offset by a loss of motivation. A
defect rate is calculated for each worker in a yearly evaluation. The results for 100
workers are given in the table below.
Referring to Table 12-10, find the rejection region necessary for testing at the 0.05 level
of significance whether there is a relationship between defect rate and years of
experience.
A) Reject H0 if X2 > 16.919
B) Reject H0 if X2 > 15.507
C) Reject H0 if X2 > 11.143
D) Reject H0 if X2 > 9.488
TABLE 13-2
A candy bar manufacturer is interested in trying to estimate how sales are influenced by
the price of their product. To do this, the company randomly chooses 6 small cities and
offers the candy bar at different prices. Using candy bar sales as the dependent variable,
the company will conduct a simple linear regression on the data below:
Referring to Table 13-2, what percentage of the total variation in candy bar sales is
explained by prices?
A) 100%

B) 88.54%
C) 78.39%
D) 48.19%
Referring to Table 14-17, which of the following is a correct
statement?
TABLE 14-17
Given below are results from the regression analysis where the
dependent variable is the number of weeks a worker is unemployed
due to a layo3 (Unemploy) and the independent variables are the age
of the worker (Age) and a dummy variable for management position
(Manager: 1 = yes, 0 = no).
The results of the regression analysis are given below:
A) 40.85% of the total variation in the number of weeks a worker is
unemployed due to a layo3 can be explained by the age of the worker
and whether the worker is a manager.

B) 40.85% of the total variation in the number of weeks a worker is
unemployed due to a layo3 can be explained by the age of the worker
and whether the worker is a manager after adjusting for the number
of predictors and sample size.
C) 40.85% of the total variation in the number of weeks a worker is
unemployed due to a layo3 can be explained by the age of the worker
and whether the worker is a manager after adjusting for the level of
signiticance.
D) 40.85% of the total variation in the number of weeks a worker is
unemployed due to a layo3 can be explained by the age of the worker
and whether the worker is a manager holding constant the effect of
all the independent variables.
True or False: When A and B are mutually exclusive, P(A or B) can be found by adding
P(A) and P(B).
TABLE 18-3
A quality control analyst for a light bulb manufacturer is concerned that the time it takes
to produce a batch of light bulbs is too erratic. Accordingly, the analyst randomly
surveys 10 production periods each day for 14 days and records the sample mean and
range for each day.
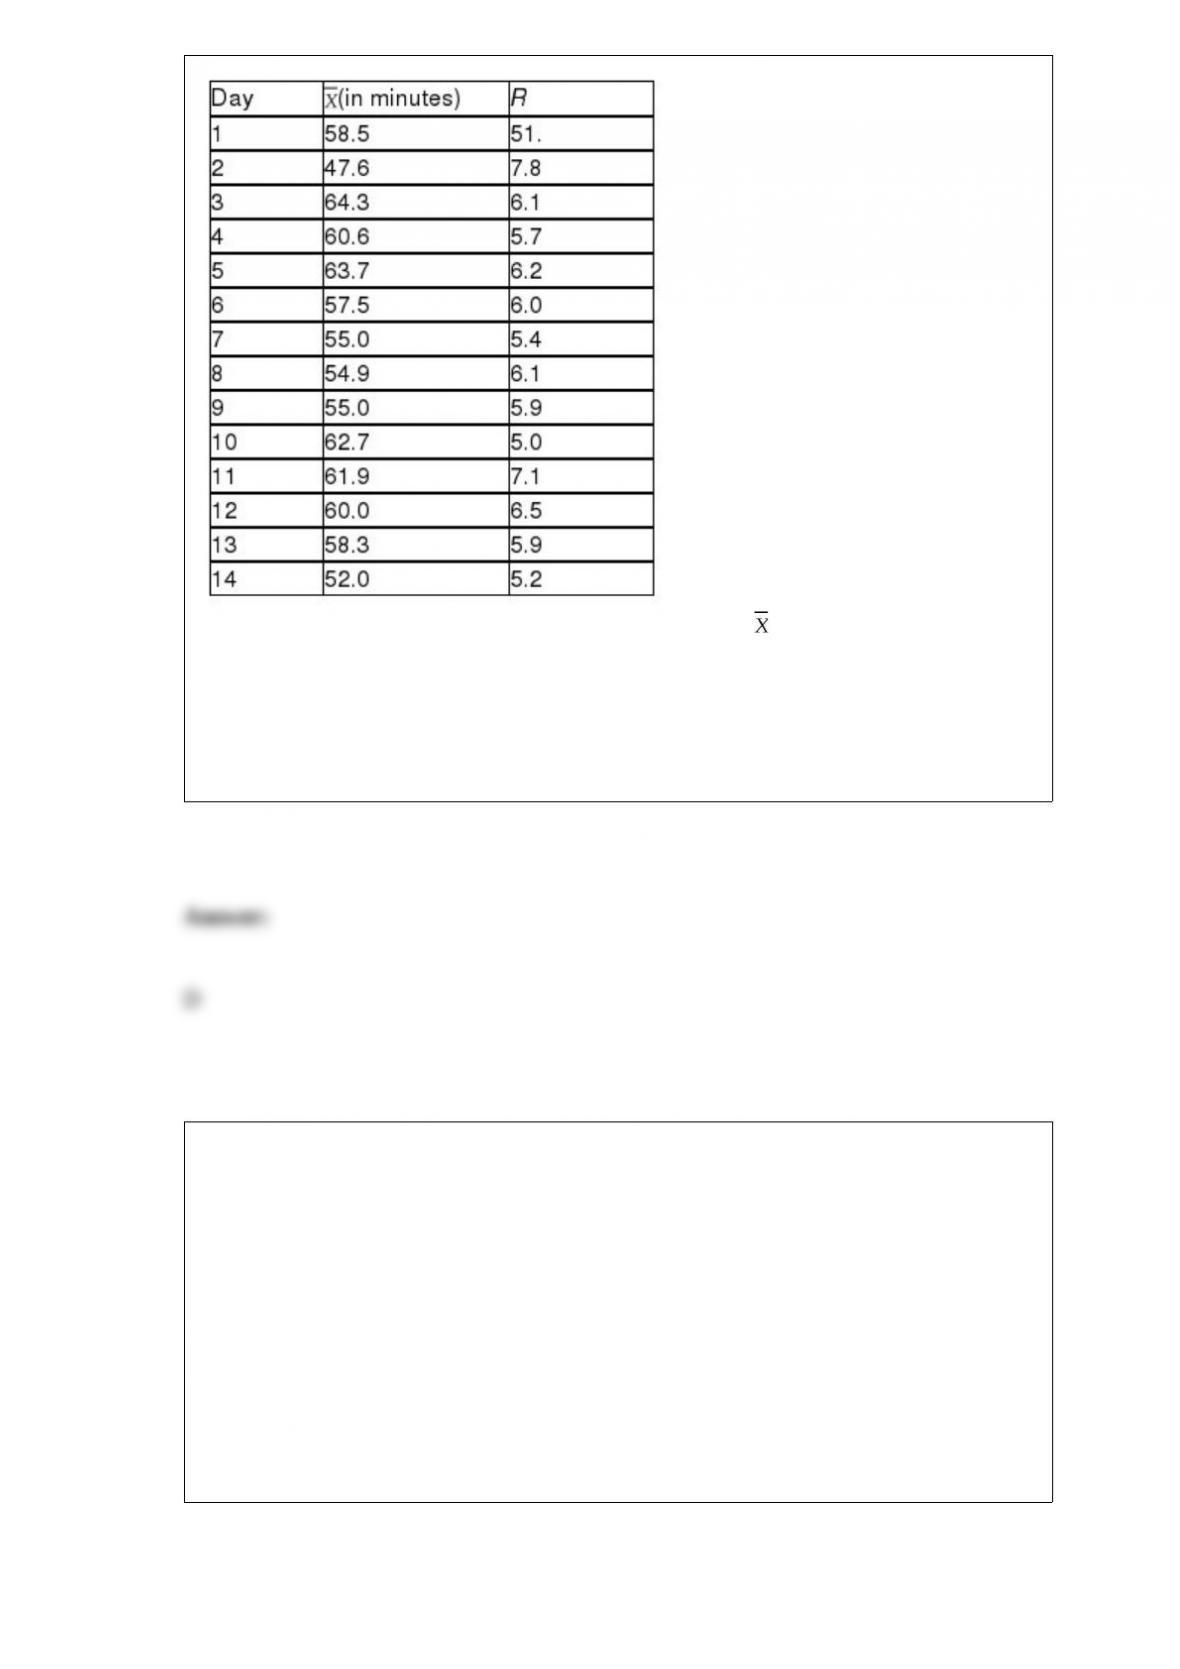
Referring to Table 18-3, suppose the analyst constructs an chart to see if the
production process is in-control. Which expression best describes this chart?
A) In-control
B) Increasing trend
C) Decreasing trend
D) Individual outliers
A certain type of new business succeeds 60% of the time. Suppose that 3 such
businesses open (where they do not compete with each other, so it is reasonable to
believe that their relative successes would be independent). Which of the following
distributions would you use to determine the probability that all of them will fail?
A) Binomial distribution
B) Poisson distribution
C) Normal distribution
D) Hypergeometric distribution

A lab orders 100 rats a week for each of the 52 weeks in the year for experiments that
the lab conducts. Suppose the mean cost of rats used in lab experiments turned out to be
$13.00 per week. Interpret this value.
A) Most of the weeks resulted in rat costs of $13.00.
B) The median cost for the distribution of rat costs is $13.00.
C) The expected or average cost for all weekly rat purchases is $13.00.
D) The rat cost that occurs more often than any other is $13.00.
Blossom’s Flowers purchases roses for sale for Valentine’s Day. The roses are purchased
for $10 a dozen and are sold for $20 a dozen. Any roses not sold on Valentine’s Day can
be sold for $5 per dozen. The owner will purchase 1 of 3 amounts of roses for
Valentine’s Day: 100, 200, or 400 dozen roses. Given 0.2, 0.4, and 0.6 are the
probabilities for the sale of 100, 200, or 400 dozen roses, respectively, then the EVPI
for buying roses is
A) $700.
B) $1,500.
C) $1,900.
D) $2,600.
The probability that house sales will increase in the next 6 months is estimated to be
0.25. The probability that the interest rates on housing loans will go up in the same
period is estimated to be 0.74. The probability that house sales or interest rates will go
up during the next 6 months is estimated to be 0.89. The probability that house sales
will increase but interest rates will not during the next 6 months is
A) 0.065.
B) 0.15.
C) 0.51.
D) 0.89.
TABLE 3-3
The ordered array below represents the number of vitamin supplements sold by a health
food store in a sample of 16 days.
19, 19, 20, 20, 22, 23, 25, 26, 27, 30, 33, 34, 35, 36, 38, 41
Note: For this sample, the sum of the values is 448, and the sum of the squared
differences between each value and the mean is 812.
Referring to Table 3-3, the five-number summary of the data in this sample consists of
________, ________, ________, ________, ________.
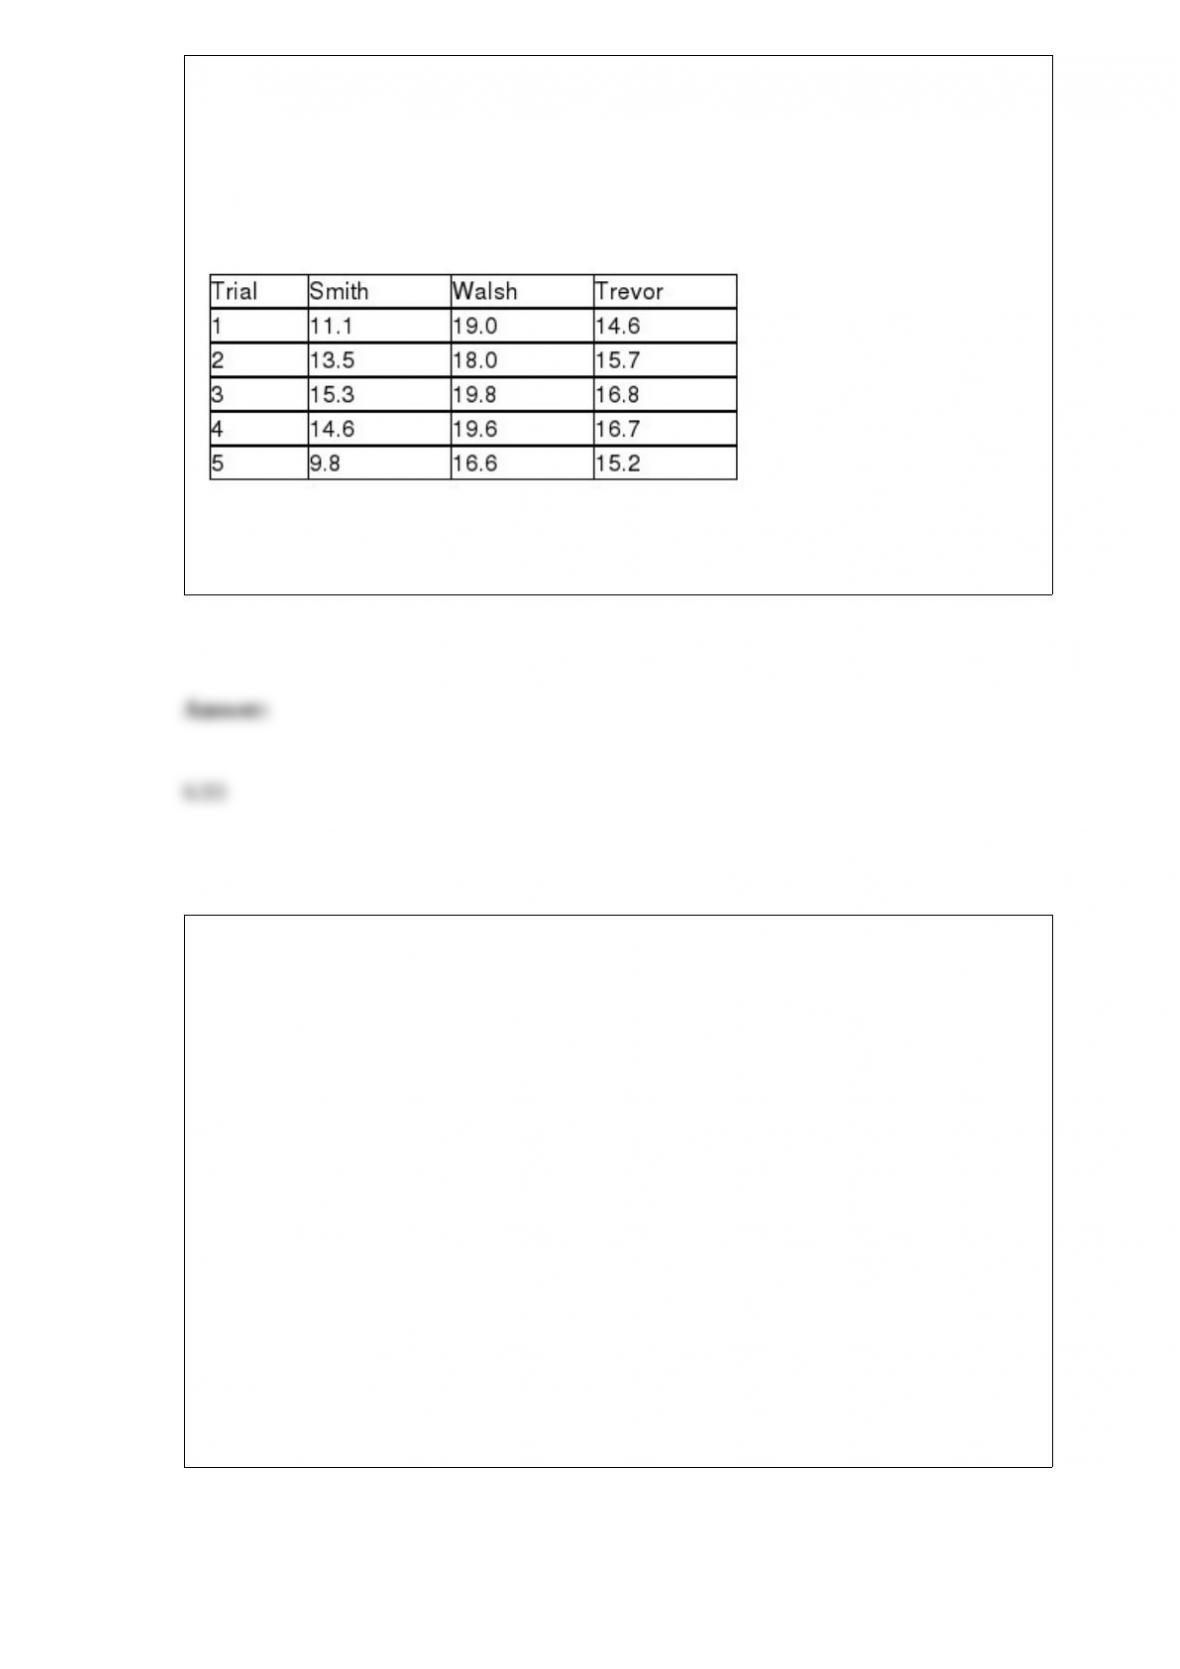
TABLE 11-4
An agronomist wants to compare the crop yield of 3 varieties of chickpea seeds. She
plants 15 fields, 5 with each variety. She then measures the crop yield in bushels per
acre. Treating this as a completely randomized design, the results are presented in the
table that follows.
Referring to Table 11-4, the null hypothesis will be rejected at a level of significance of
0.01 if the value of the test statistic is greater than ________.
Referring to Table 14-16, what is the value of the test statistic to
determine whether being a sedan or not makes a signiticant
contribution to the regression model in the presence of the other
independent variable at a 5% level of signiticance?
TABLE 14-16
What are the factors that determine the acceleration time (in sec.)
from 0 to 60 miles per hour of a car? Data on the following variables
for 30 different vehicle models were collected:
Y (Accel Time): Acceleration time in sec.
X1 (Engine Size): c.c.
X2 (Sedan): 1 if the vehicle model is a sedan and 0 otherwise
The regression results using acceleration time as the dependent
variable and the remaining variables as the independent variables are
presented below.

The various residual plots are as shown below.

The coeAcient of partial determinations and are 0.3301,
and 0.0594, respectively.
The coeAcient of determination for the regression model using each
of the 2 independent variables as the dependent variable and the
other independent variable as independent variables ( ) are,
respectively 0.0077, and 0.0077.

In a game called Taxation and Evasion, a player rolls a pair of dice. If on any turn the
sum is 7, 11, or 12, the player gets audited. Otherwise, she avoids taxes. Suppose a
player takes 5 turns at rolling the dice. The variance of the number of times she will be
audited is ________.
TABLE 4-10
Are whites more likely to claim bias? It was found that 60% of the workers were white,
30% were black and 10% are other races. Given that a worker was white, the
probability that the worker had claimed bias was 30%. Given that a worker was black,
the probability that the worker had claimed bias was 40%. Given that a worker was
other race, the probability that the worker had claimed bias was 0%.
Referring to Table 4-10, what is the probability that a randomly selected worker had not
claimed bias?
The number of power outages at a nuclear power plant has a Poisson distribution with a
mean of 6 outages per year. The probability that there will be exactly 3 power outages
in a year is ________.
The amount of time necessary for assembly line workers to complete a product is a
normal variable with a mean of 15 minutes and a standard deviation of 2 minutes. The
probability is ________ that a product is assembled in more than 19 minutes.
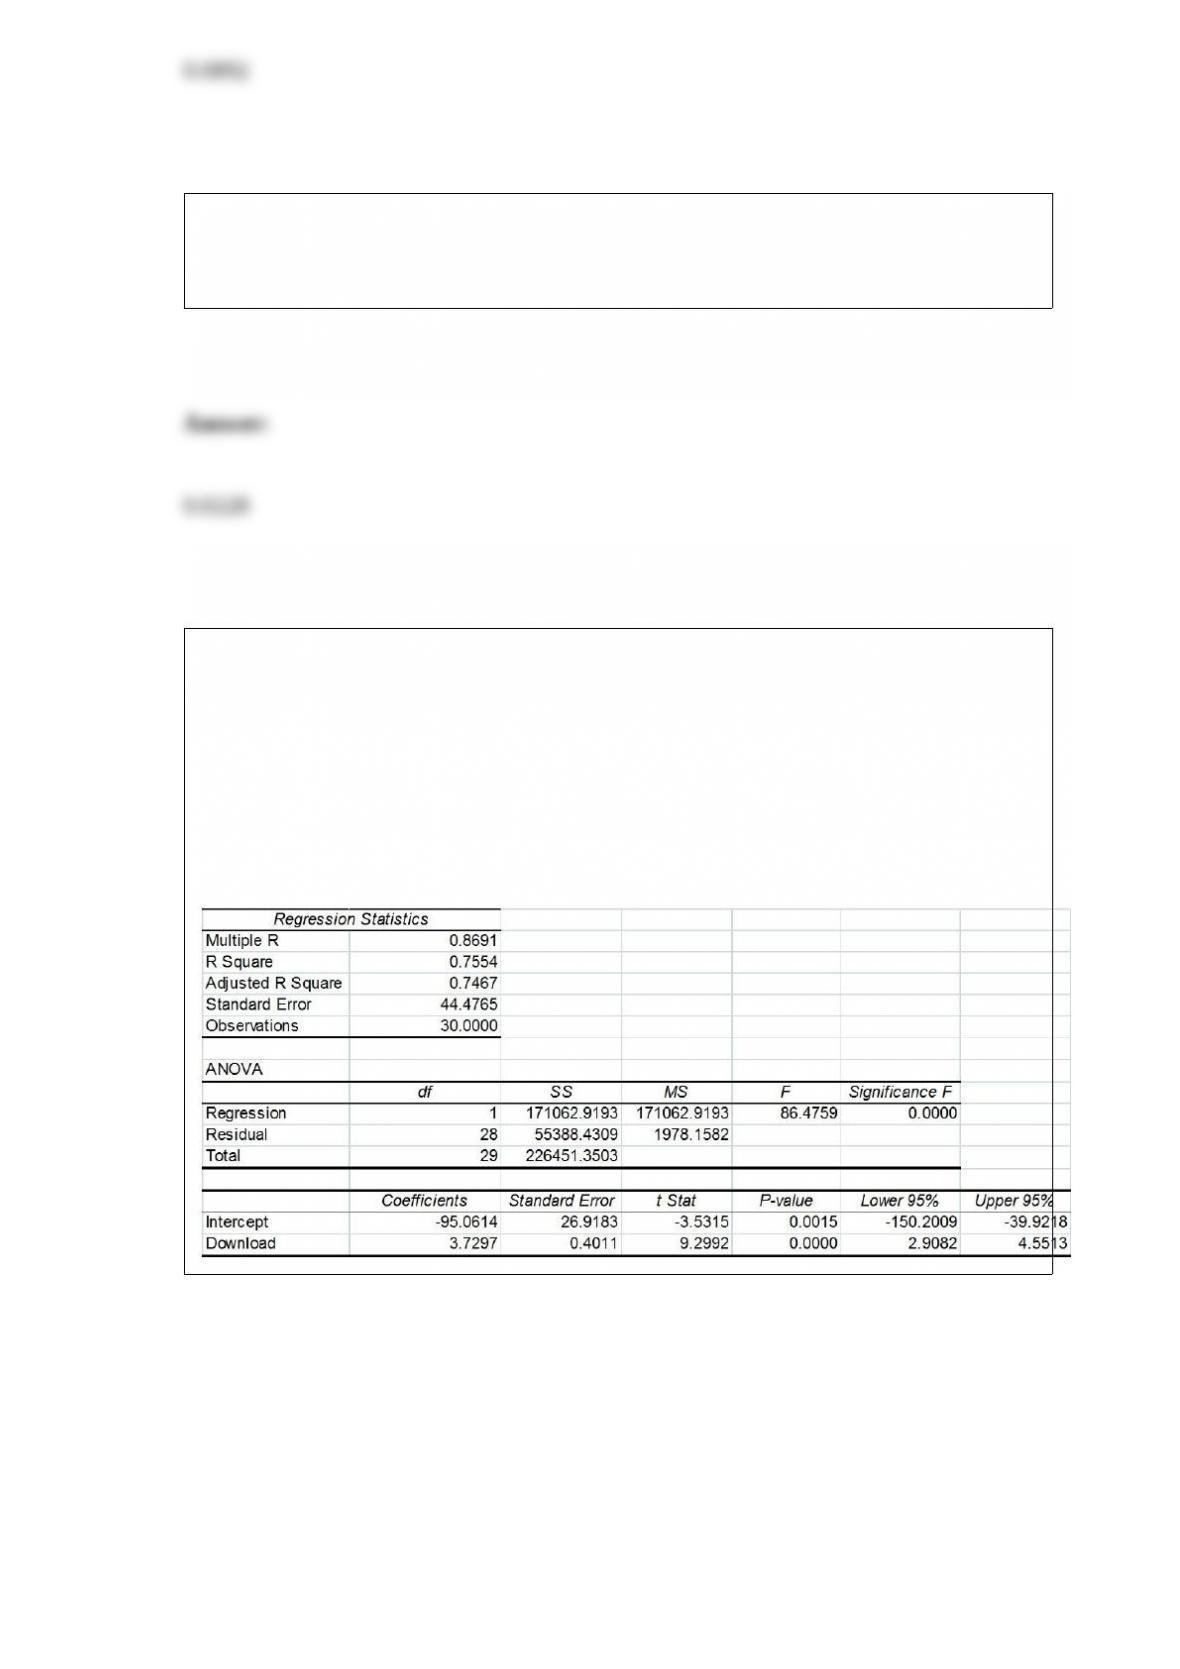
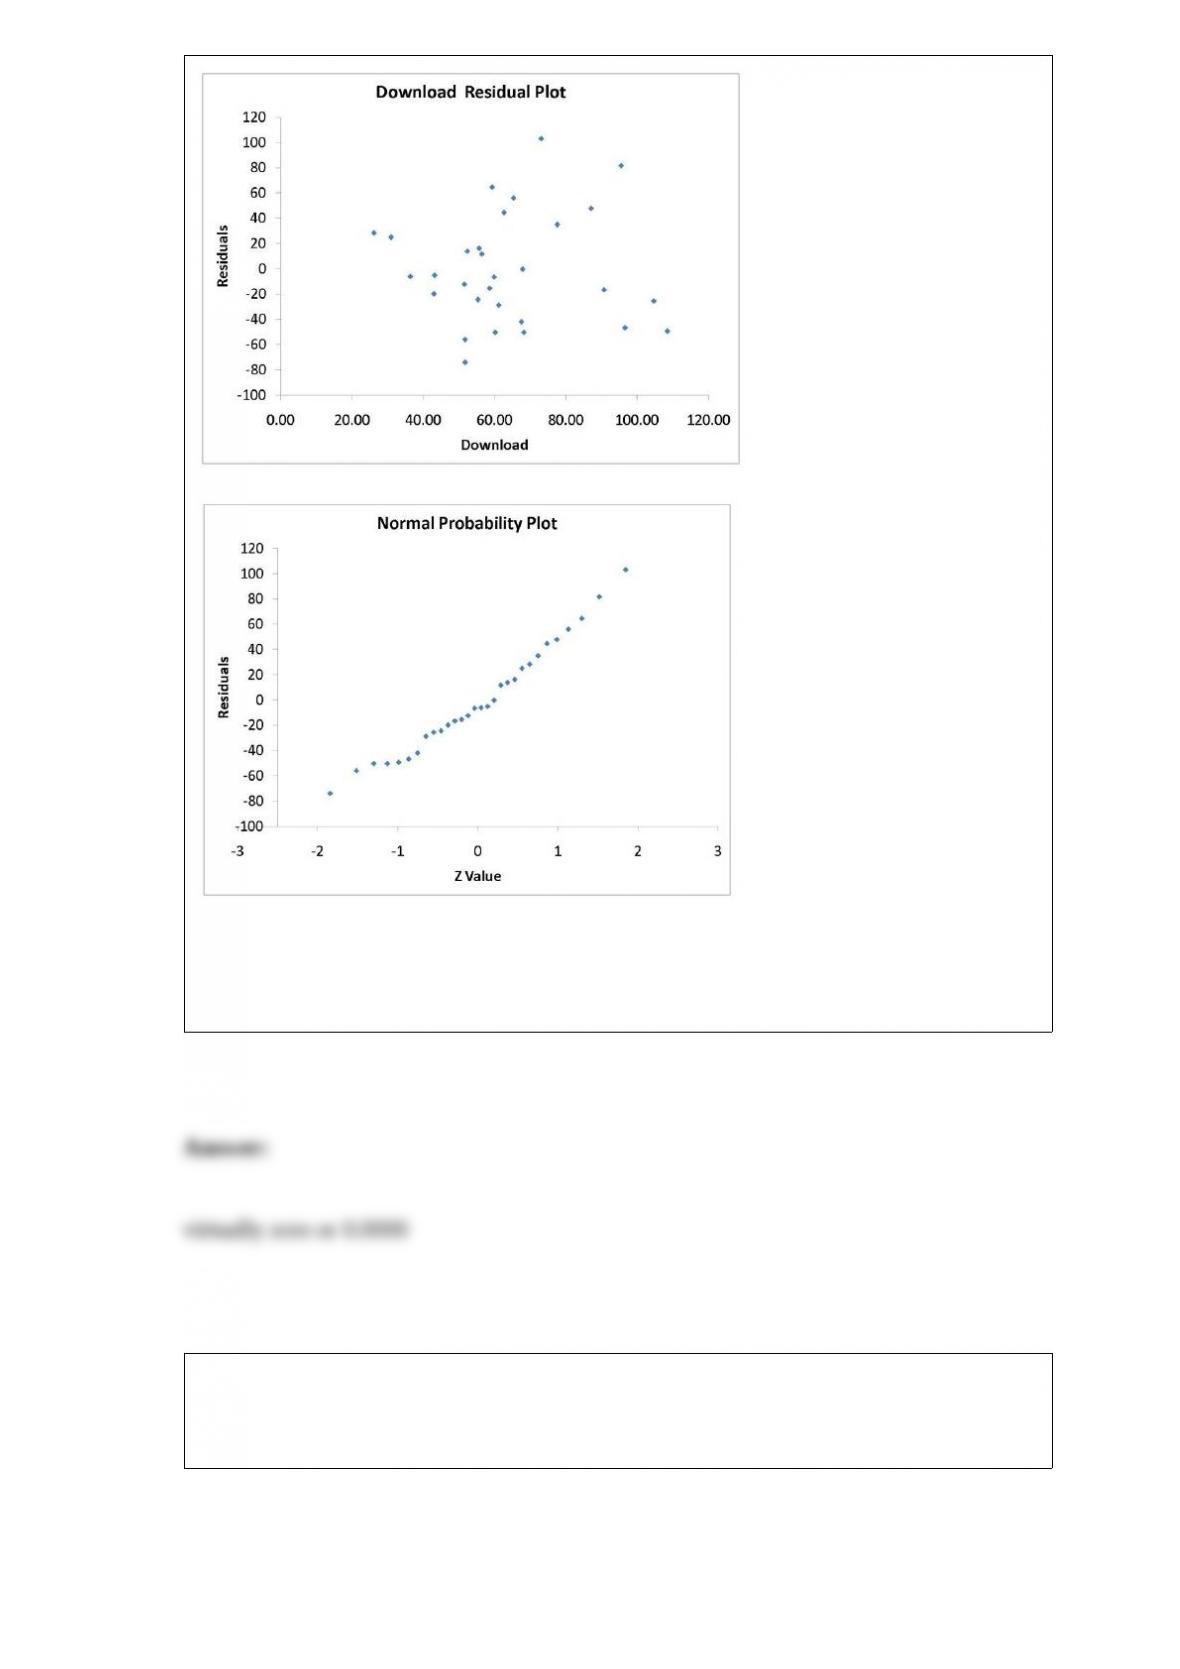
TABLE 13-11
A computer software developer would like to use the number of downloads (in
thousands) for the trial version of his new shareware to predict the amount of revenue
(in thousands of dollars) he can make on the full version of the new shareware.
Following is the output from a simple linear regression along with the residual plot and
normal probability plot obtained from a data set of 30 different sharewares that he has
developed:
Referring to Table 13-11, what is the p-value for testing whether there is a linear
relationship between revenue and the number of downloads at a 5% level of
significance?
TABLE 19-5
The following payoff table shows profits associated with a set of 2 alternatives under 3
possible events.

Suppose that the probability of Event 1 is 0.2, Event 2 is 0.5, and Event 3 is 0.3.
Referring to Table 19-5, what is the return to risk ratio for Action B?
TABLE 10-6
To investigate the efficacy of a diet, a random sample of 16 male patients is selected
from a population of adult males using the diet. The weight of each individual in the
sample is taken at the start of the diet and at a medical follow-up 4 weeks later.
Assuming that the population of differences in weight before versus after the diet
follow a normal distribution, the t-test for related samples can be used to determine if
there was a significant decrease in the mean weight during this period. Suppose the
mean decrease in weights over all 16 subjects in the study is 3.0 pounds with the
standard deviation of differences computed as 6.0 pounds.
Referring to Table 10-6, the computed t statistic is ________.