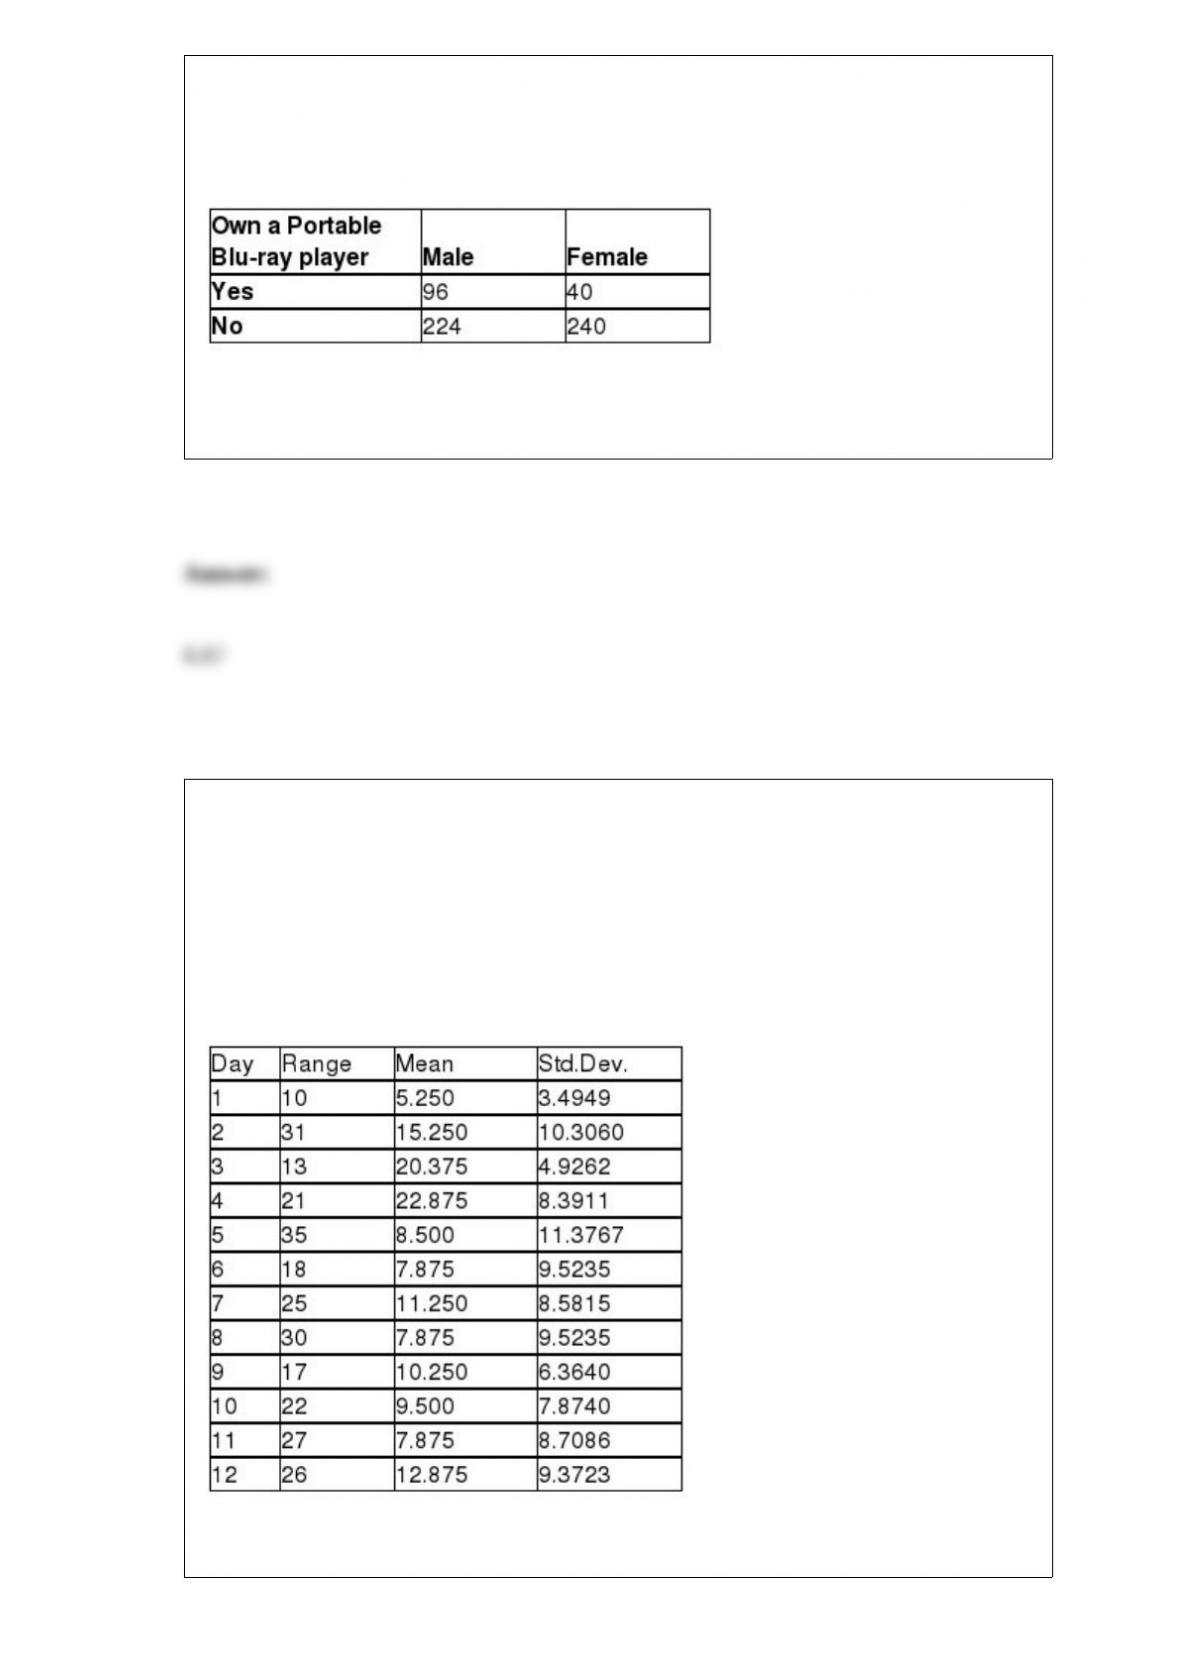
TABLE 2-14
The table below contains the number of people who own a portable Blu-ray player in a
sample of 600 broken down by gender.
Referring to Table 2-14, ________ percent of the 600 were females who owned a
portable Blu-ray player.
TABLE 18-8
Recently, a university switched to a new type of computer-based registration. The
registrar is concerned with the amount of time students are spending on the computer
registering under the new system. She decides to randomly select 8 students on each of
the 12 days of the registration and determine the time each spends on the computer
registering. The range, mean, and standard deviation of the times required to register are
in the table that follows.
Referring to Table 18-8, an R chart is to be constructed for the time required to register.
One way to create the upper control limit involves multiplying the mean of the sample
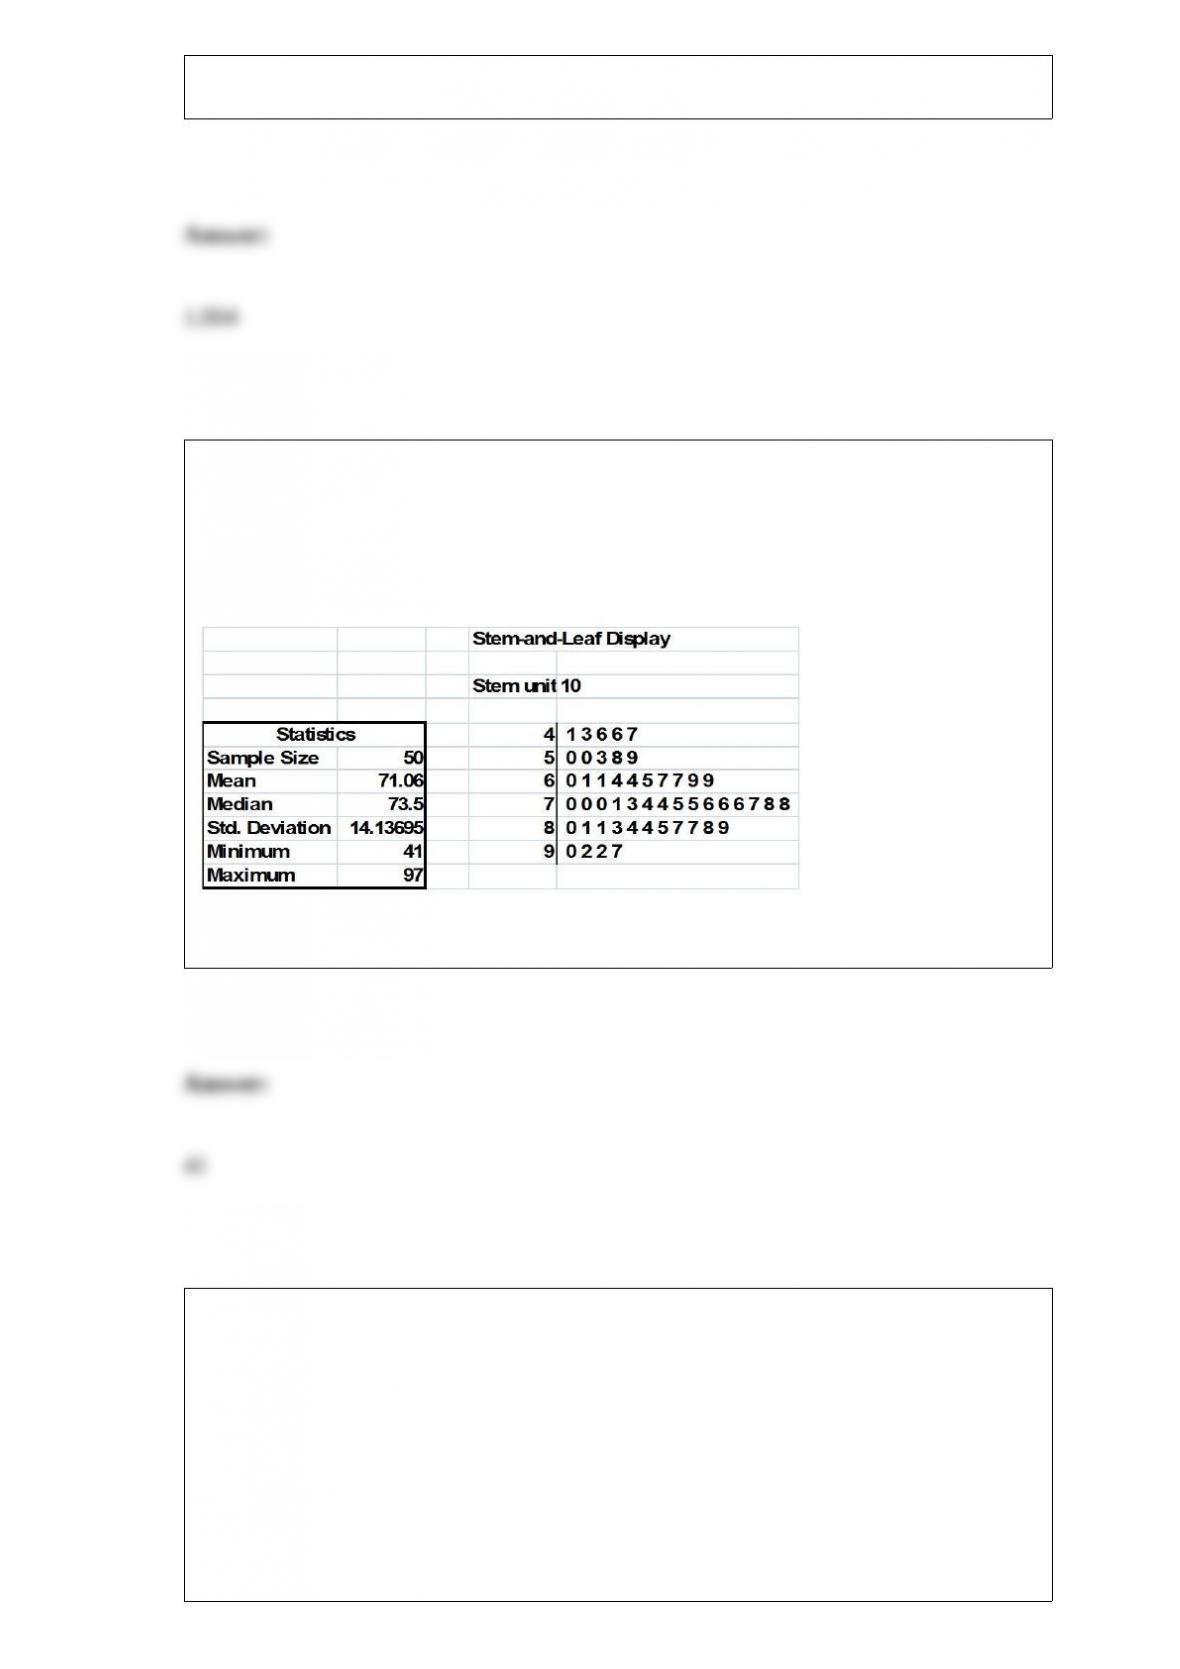
ranges by D4. For this data set, the value of D4 is ________.
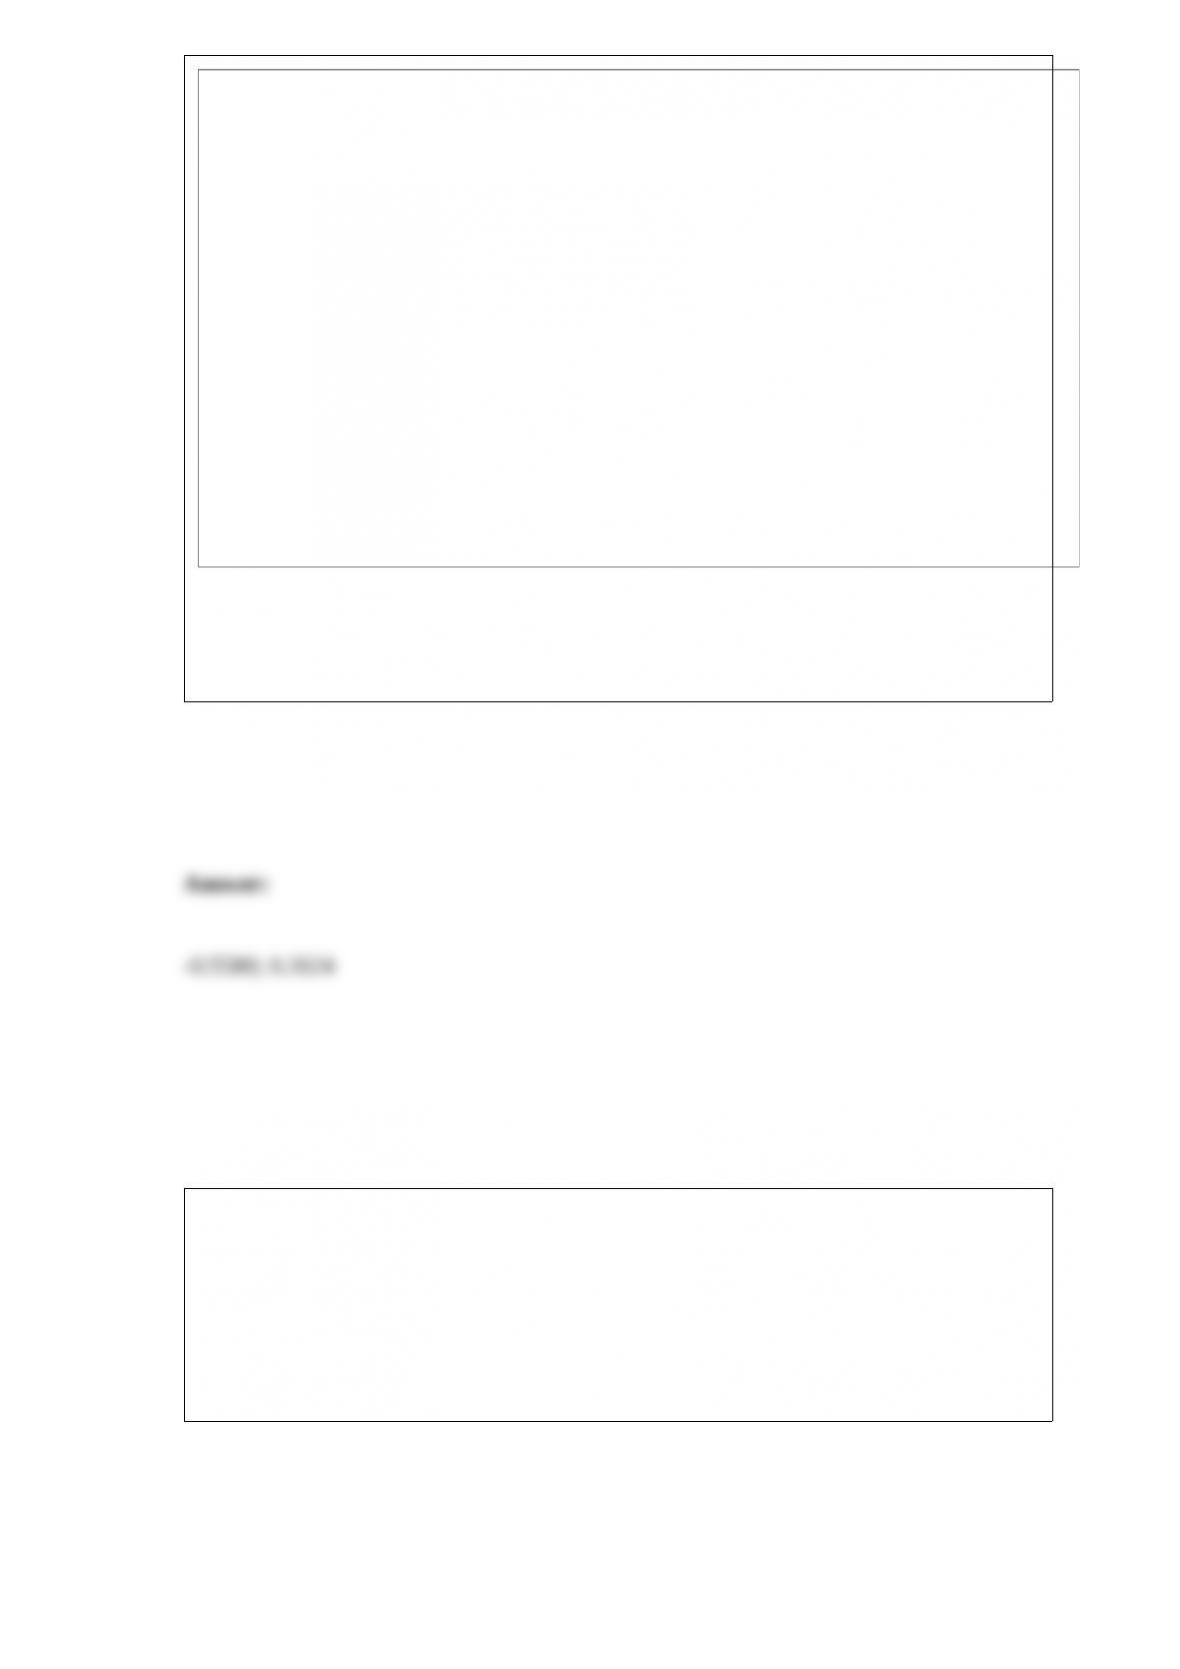
TABLE 2-18
The stem-and-leaf display below shows the result of a survey of 50 students on their
satisfaction with their school, with the higher scores representing a higher level of
satisfaction.
Referring to Table 2-18, what was the lowest level of satisfaction?
Referring to Table 14-8, the analyst decided to construct a 95%
confidence interval for β2. The confidence interval is from ________ to
________.TABLE 14-8
A financial analyst wanted to examine the relationship between salary
(in $1,000) and 2 variables: age
(X1 = Age) and experience in the field (X2 = Exper). He took a sample
of 20 employees and obtained the following Microsoft Excel output:
Also, the sum of squares due to the regression for the model that
includes only Age is 5022.0654 while the sum of squares due to the
regression for the model that includes only Exper is 125.9848.
TABLE 18-8
Recently, a university switched to a new type of computer-based registration. The
registrar is concerned with the amount of time students are spending on the computer
registering under the new system. She decides to randomly select 8 students on each of
the 12 days of the registration and determine the time each spends on the computer
registering. The range, mean, and standard deviation of the times required to register are
in the table that follows.
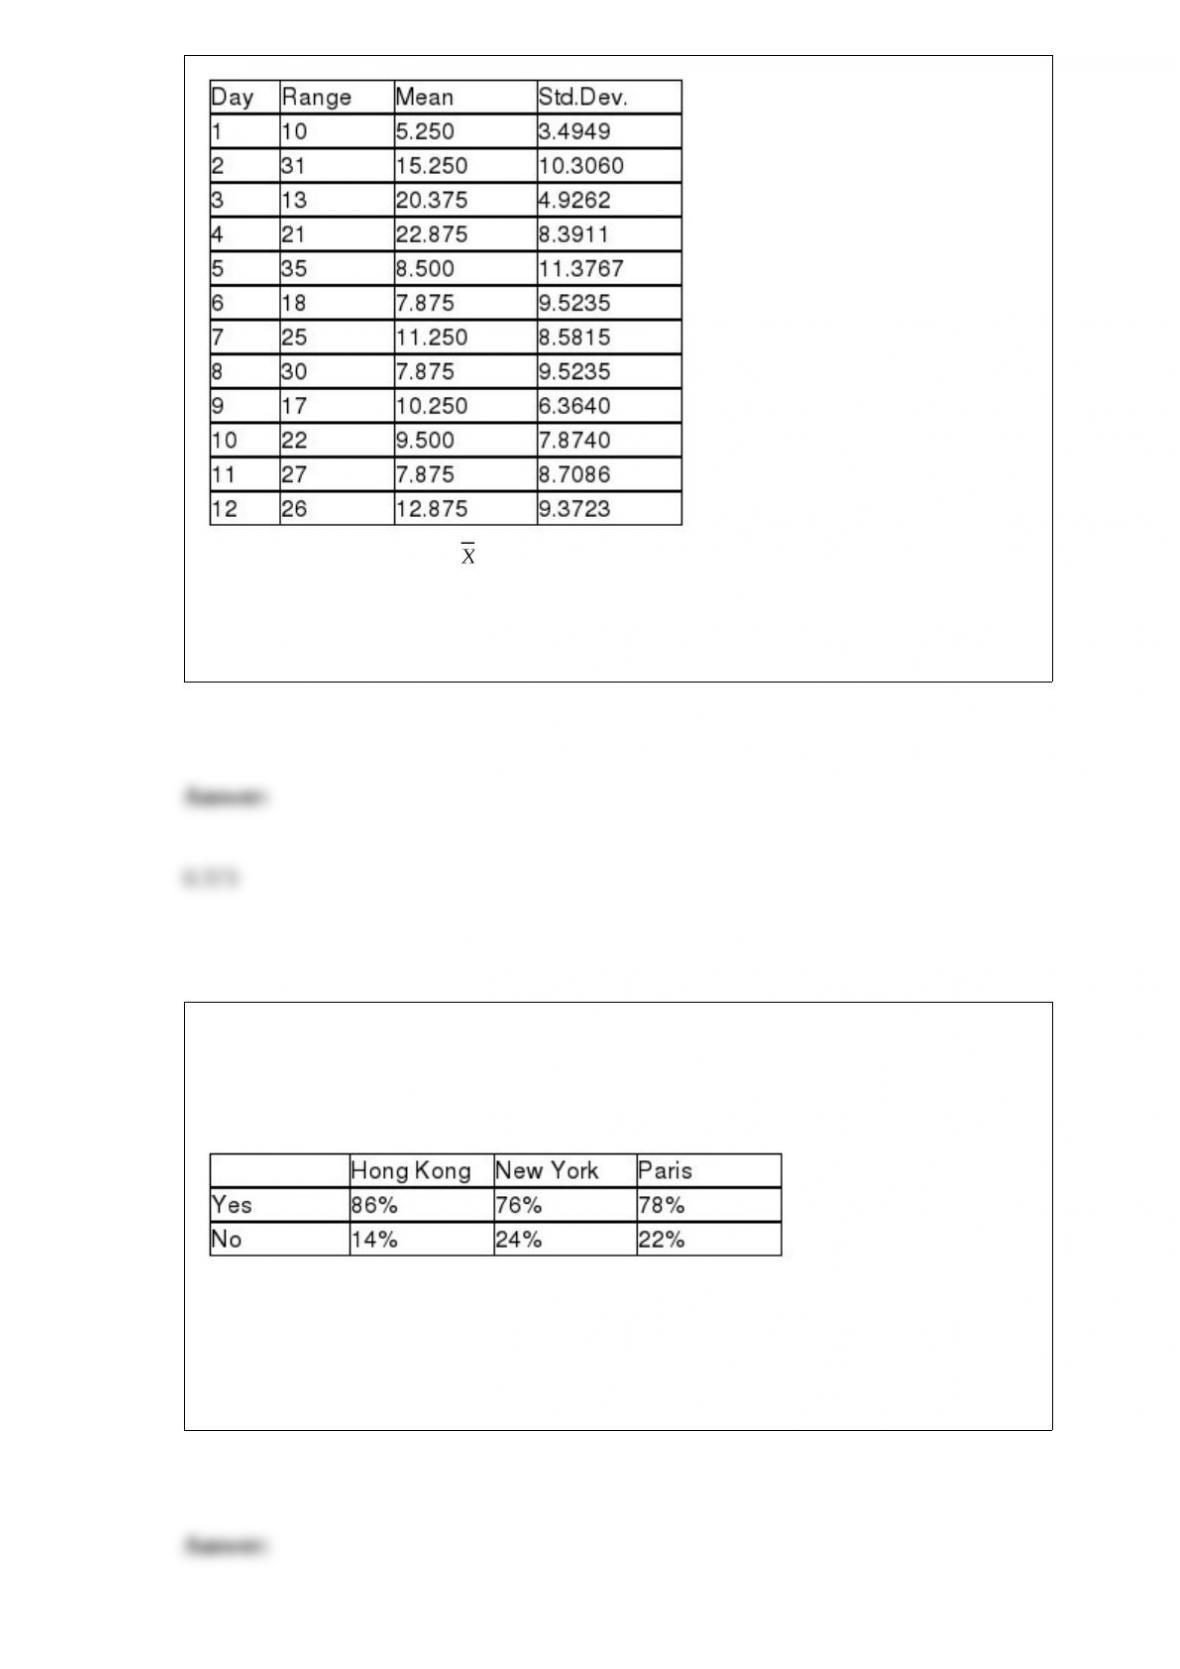
Referring to Table 18-8, an chart is to be used for the time required to register. One
way to obtain the control limits is to take the grand mean and add and subtract the
product of A2 times the mean of the sample ranges. For this data set, the value of A2 is
________.
TABLE 12-7
Data on the percentage of 200 hotels in each of the three large cities across the world on
whether minibar charges are correctly posted at checkout are given below.
At the 0.05 level of significance, you want to know if there is evidence of a difference
in the proportion of hotels that correctly post minibar charges among the three cities.
Referring to Table 12-7, the test will involve ________ degrees of freedom.
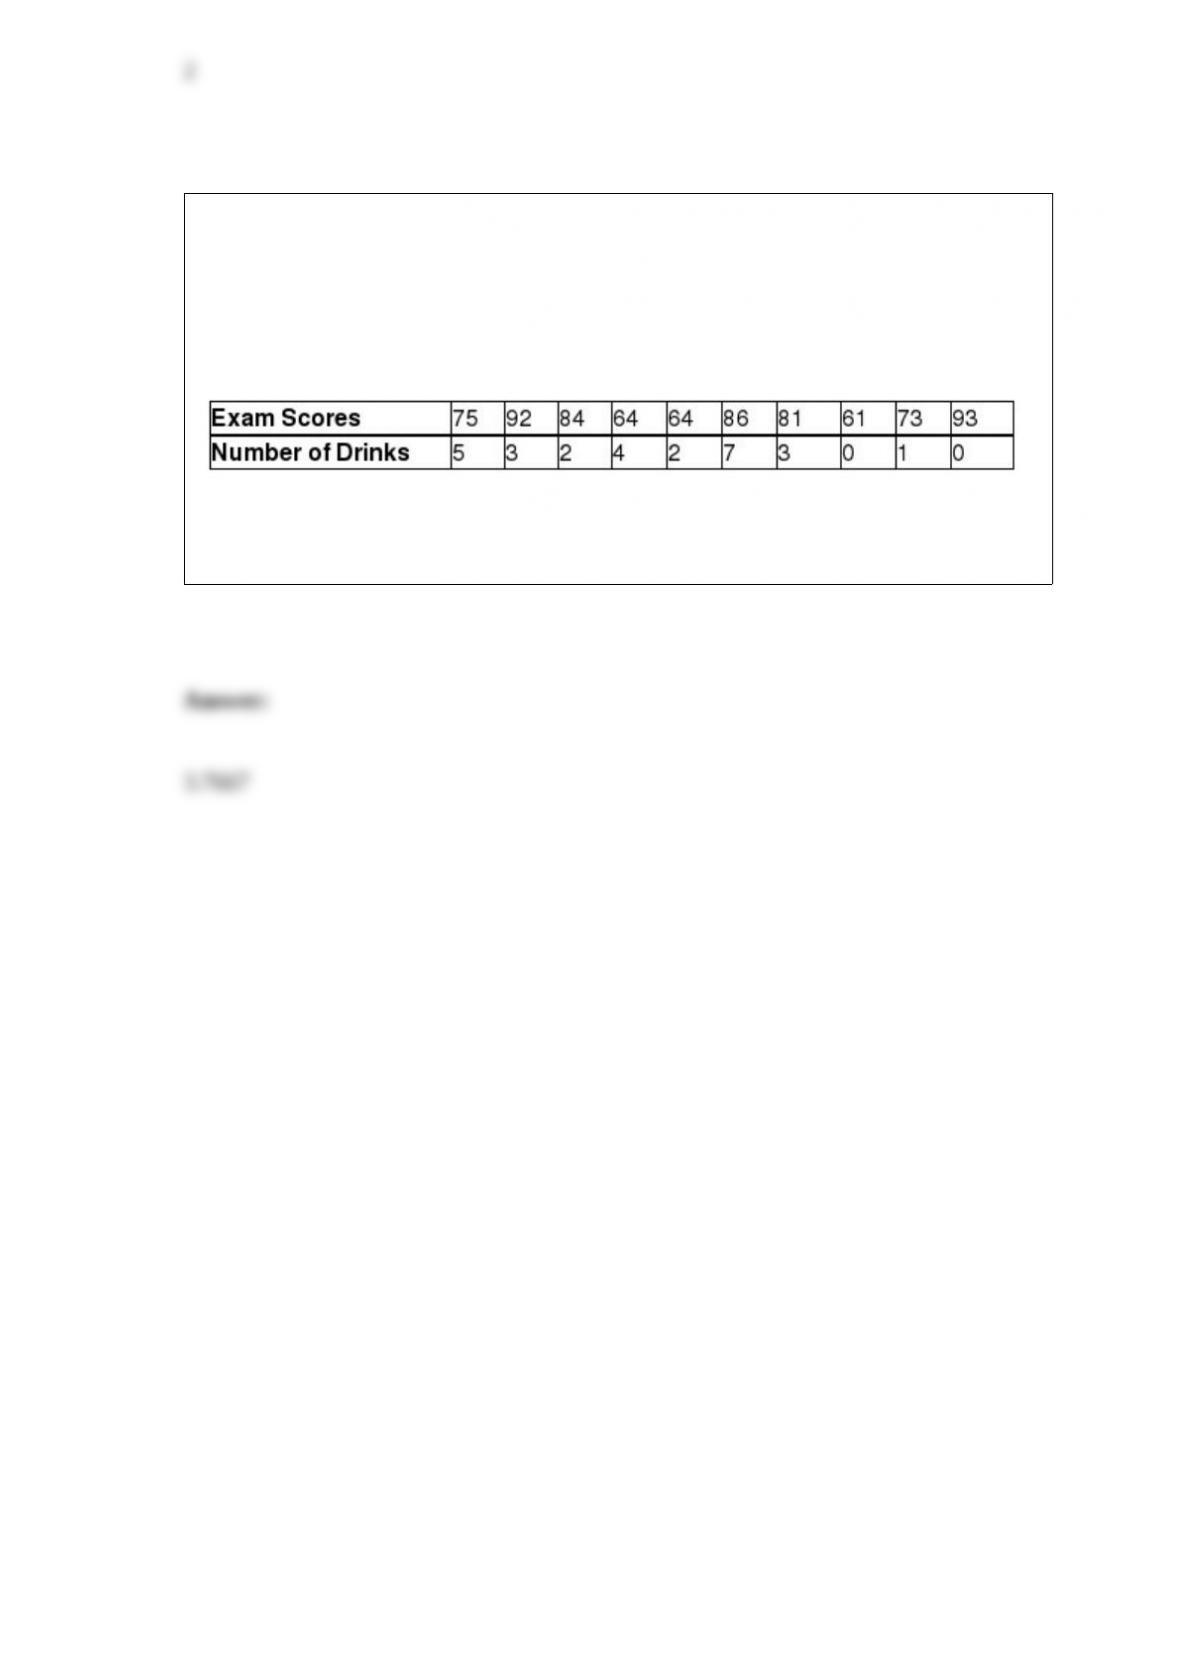
TABLE 3-13
Energy drink consumption has continued to gain in popularity since the 1997 debut of
Red Bull, the current leader in the energy drink market. Given below are the exam
scores and the number of 12-ounce energy drinks consumed within a week prior to the
exam of 10 college students.
Referring to Table 3-13, what is the sample covariance between the exam scores and the
number of energy drinks consumed?