
Referring to Table 14-16, ________ of the variation in Accel Time can be
explained by the dummy variable Sedan while controlling for the
other independent variable.
TABLE 14-16
What are the factors that determine the acceleration time (in sec.)
from 0 to 60 miles per hour of a car? Data on the following variables
for 30 different vehicle models were collected:
Y (Accel Time): Acceleration time in sec.
X1 (Engine Size): c.c.
X2 (Sedan): 1 if the vehicle model is a sedan and 0 otherwise
The regression results using acceleration time as the dependent
variable and the remaining variables as the independent variables are
presented below.
The various residual plots are as shown below.

The coefficient of partial determinations and are 0.3301,
and 0.0594, respectively.
The coefficient of determination for the regression model using each
of the 2 independent variables as the dependent variable and the
other independent variable as independent variables ( ) are,
respectively 0.0077, and 0.0077.
Suppose Z has a standard normal distribution with a mean of 0 and standard deviation
of 1. The probability that Z is between -0.88 and 2.29 is ________.
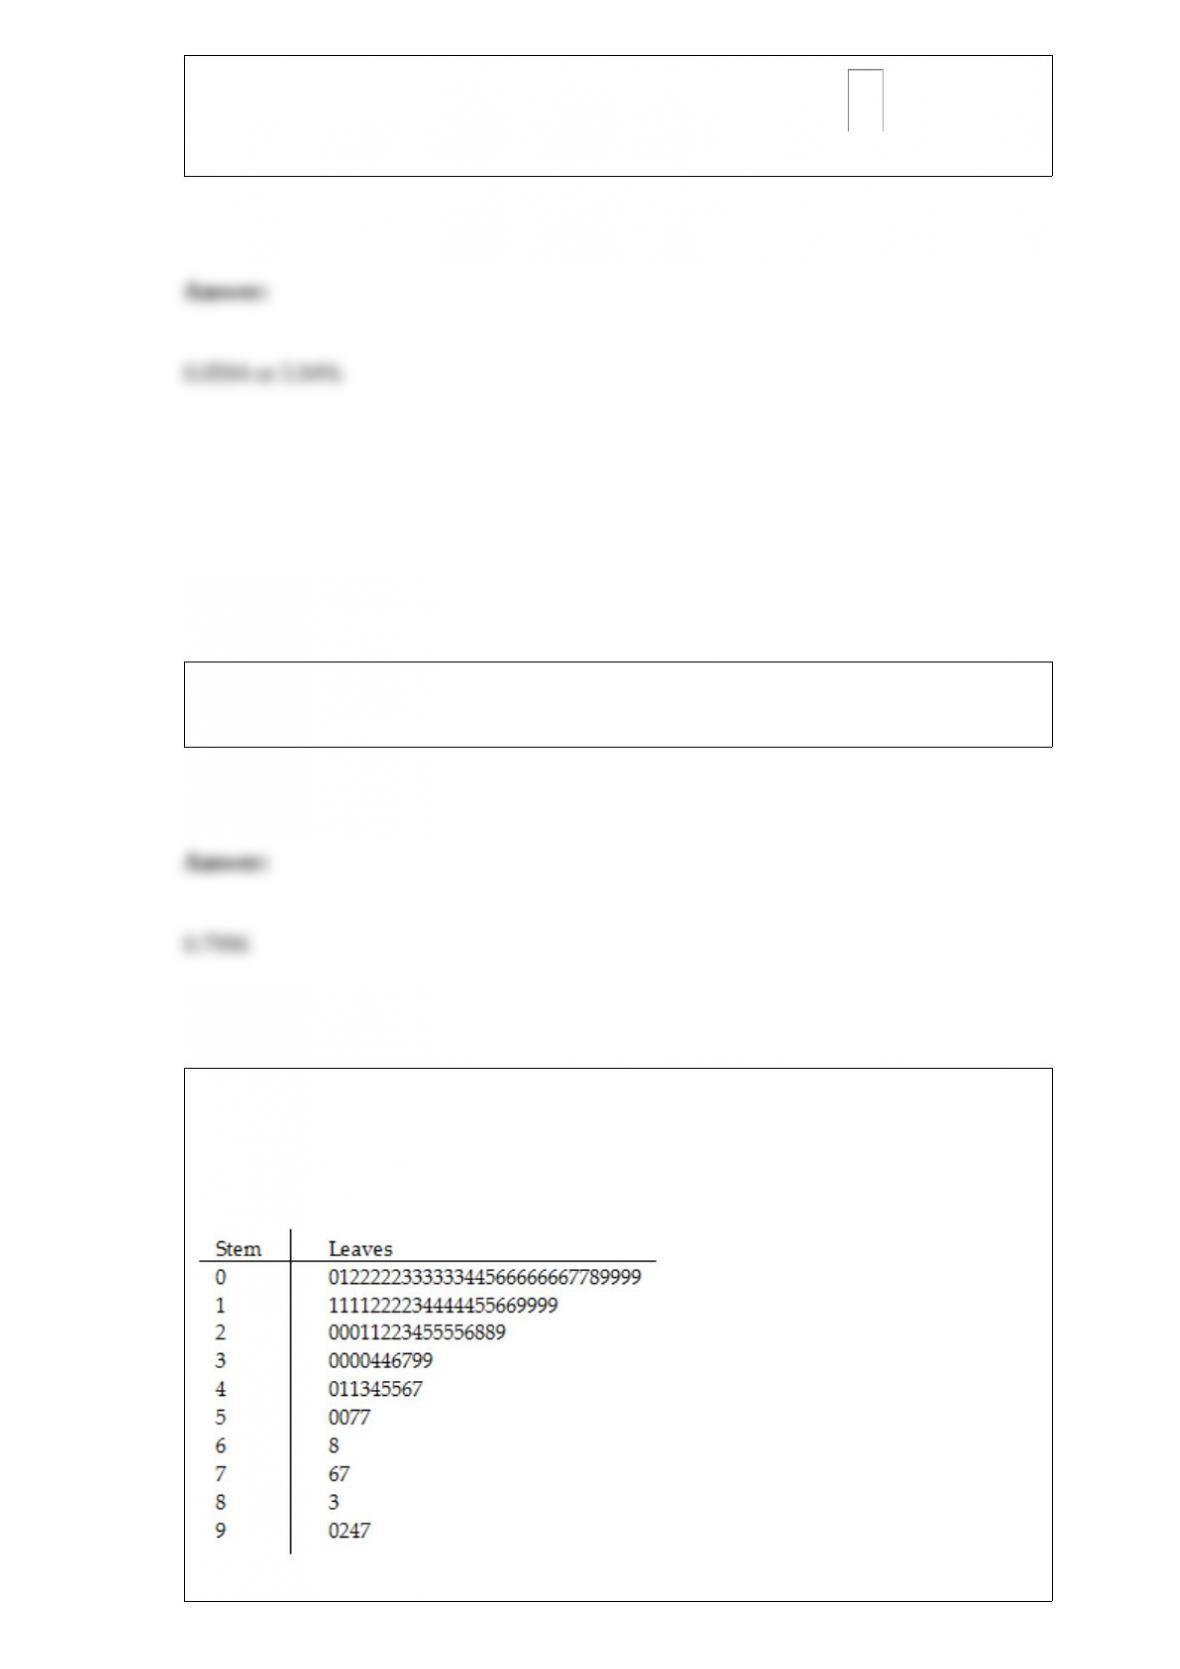
TABLE 2-8
The Stem-and-Leaf display represents the number of times in a year that a random
sample of 100 “lifetime” members of a health club actually visited the facility.
Referring to Table 2-8, the person who has the largest leaf associated with the smallest
stem visited the facility ________ times.
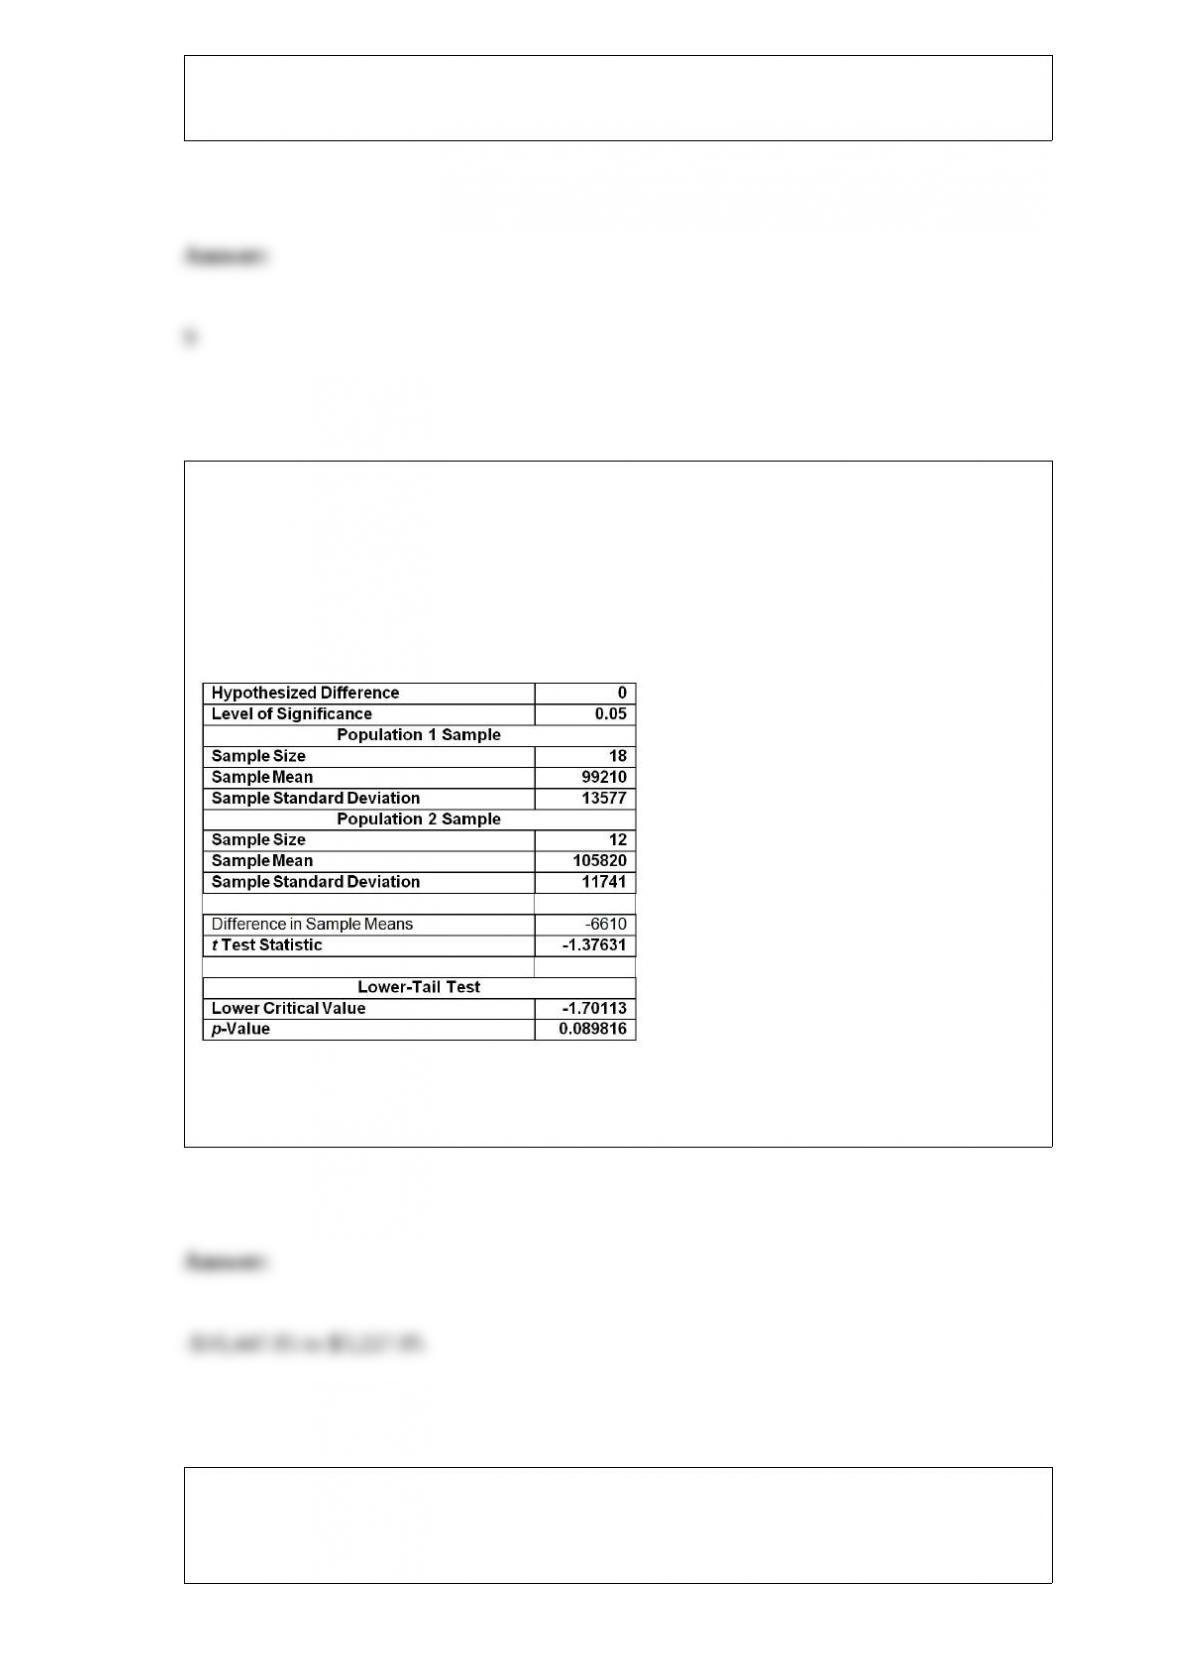
TABLE 10-2
A researcher randomly sampled 30 graduates of an MBA program and recorded data
concerning their starting salaries. Of primary interest to the researcher was the effect of
gender on starting salaries. The result of the pooled-variance t-test of the mean salaries
of the females (Population 1) and males (Population 2) in the sample is given below.
Referring to Table 10-2, what is the 95% confidence interval estimate for the difference
between two means?
TABLE 14-15
The superintendent of a school district wanted to predict the

percentage of students passing a sixth-grade proficiency test. She
obtained the data on percentage of students passing the proficiency
test (% Passing), mean teacher salary in thousands of dollars
(Salaries), and instructional spending per pupil in thousands of dollars
(Spending) of 47 schools in the state.
Following is the multiple regression output with Y = % Passing as the
dependent variable, X1 = Salaries and X2 = Spending:
Referring to Table 14-15, what are the lower and upper limits of the
95% confidence interval estimate for the effect of a one thousand
dollar increase in instructional spending per pupil on the mean
percentage of students passing the proficiency test?
As an aid to the establishment of personnel requirements, the director of a hospital
wishes to estimate the mean number of people who are admitted to the emergency room
during a 24-hour period. The director randomly selects 64 different 24-hour periods and
determines the number of admissions for each. For this sample, = 396 and S = 100.
Estimate the mean number of admissions per 24-hour period with a 95% confidence

interval.
TABLE 17-9
What are the factors that determine the acceleration time (in sec.) from 0 to 60 miles per
hour of a car? Data on the following variables for 171 different vehicle models were
collected:
Accel Time: Acceleration time in sec.
Cargo Vol: Cargo volume in cu. ft.
HP: Horsepower
MPG: Miles per gallon
SUV: 1 if the vehicle model is an SUV with Coupe as the base when SUV and Sedan
are both 0
Sedan: 1 if the vehicle model is a sedan with Coupe as the base when SUV and Sedan
are both 0
The regression results using acceleration time as the dependent variable and the
remaining variables as the independent variables are presented below.
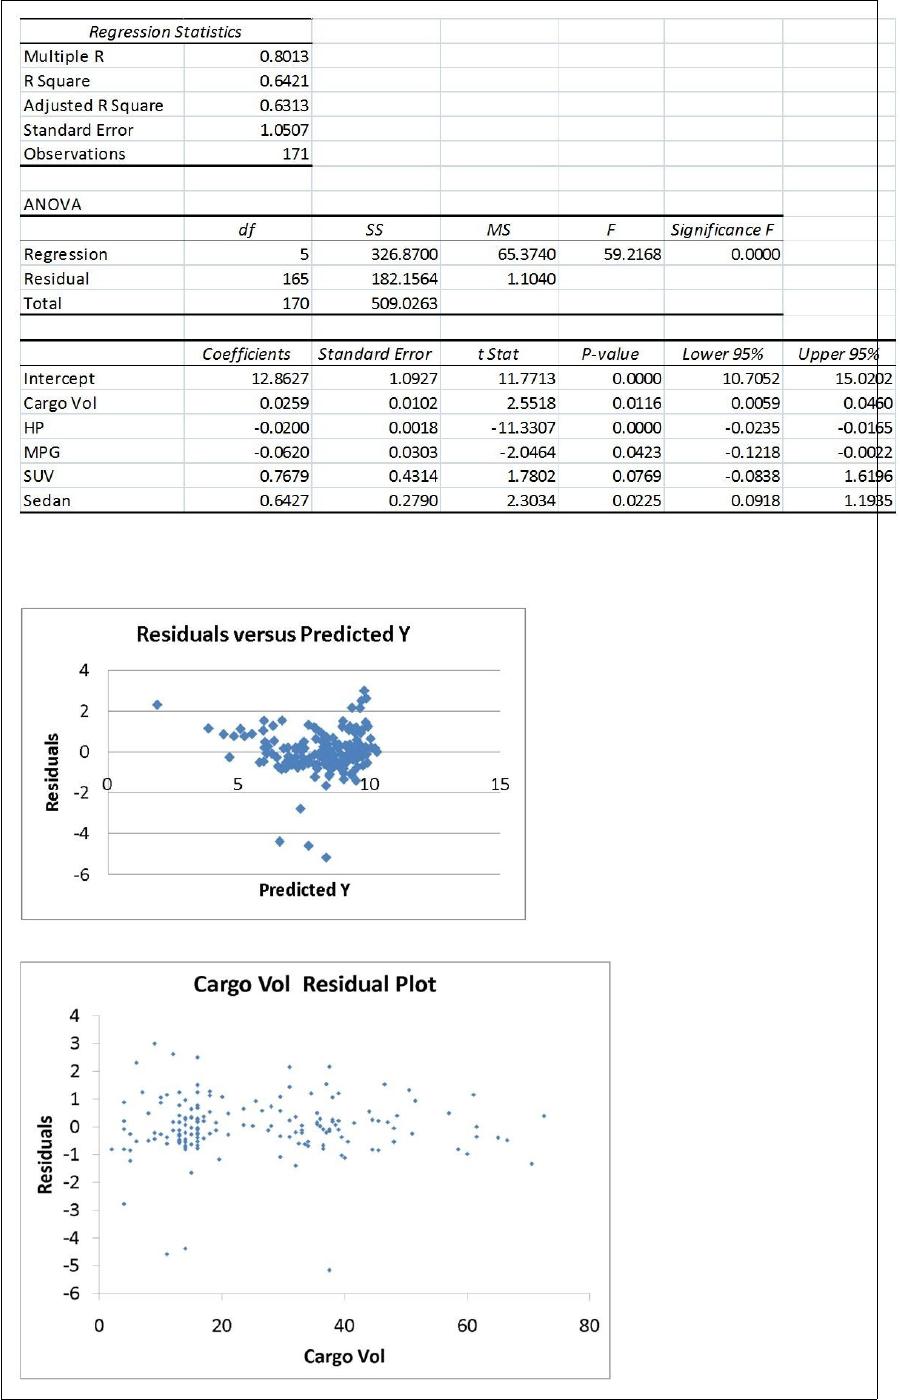
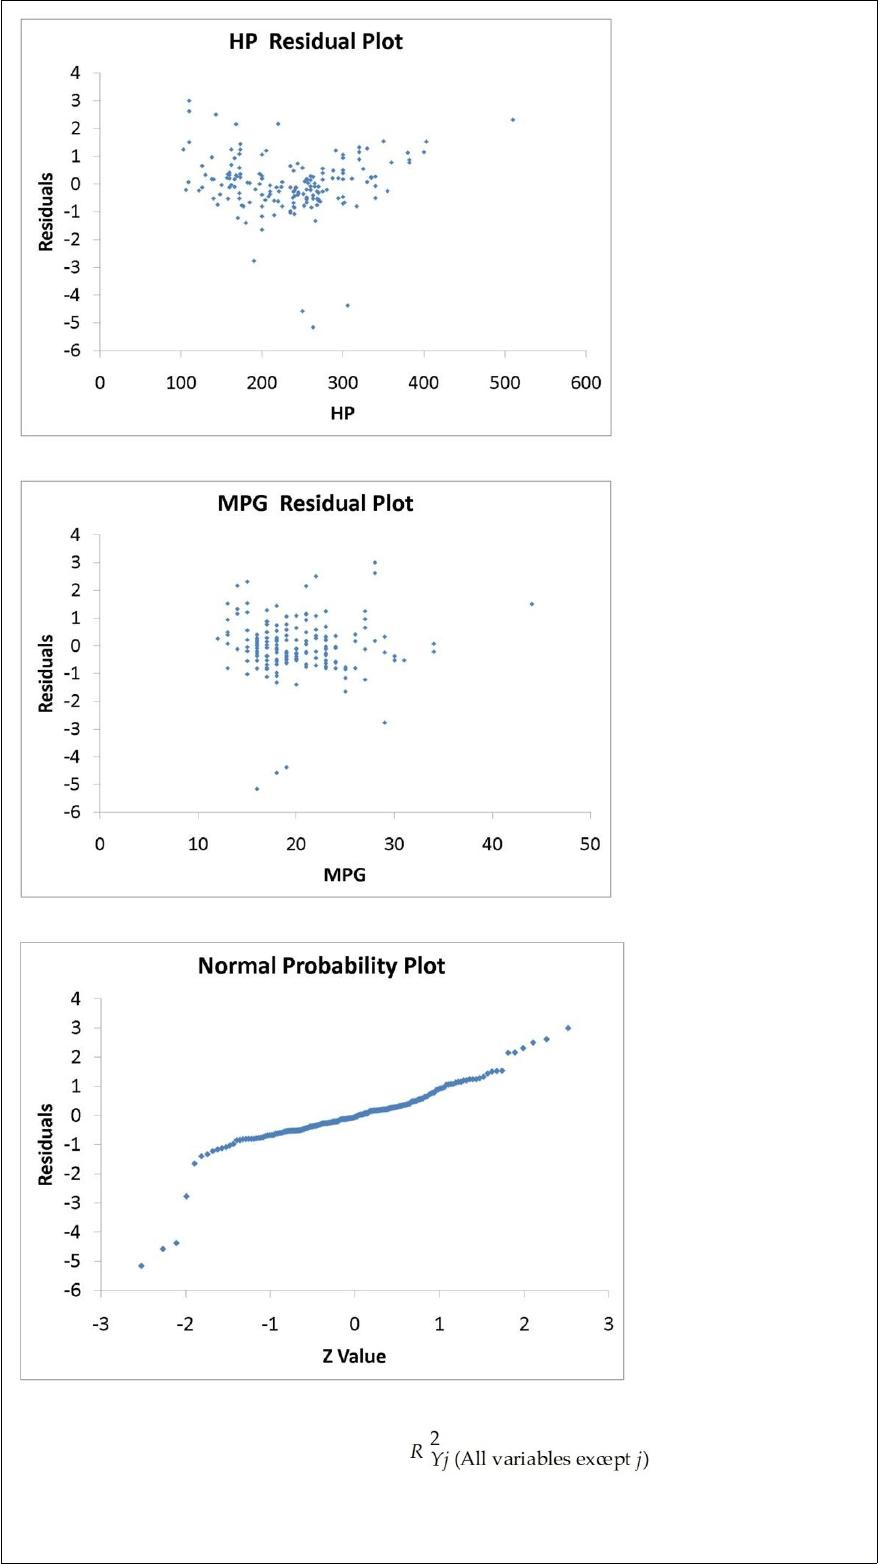
The various residual plots are as shown below.
The coefficient of partial determination ( ) of each of the 5
predictors are, respectively, 0.0380, 0.4376, 0.0248, 0.0188, and 0.0312.

The coefficient of multiple determination for the regression model using each of the 5
variables Xj as the dependent variable and all other X variables as independent variables
( ) are, respectively, 0.7461, 0.5676, 0.6764, 0.8582, 0.6632.
Referring to Table 17-9, what is the p-value of the test statistic to determine whether
MPG makes a significant contribution to the regression model in the presence of the
other independent variables at a 5% level of significance?
TABLE 6-2
John has two jobs. For daytime work at a jewelry store he is paid $15,000 per month,
plus a commission. His monthly commission is normally distributed with a mean of
$10,000 and a standard deviation of $2,000. At night he works occasionally as a waiter,
for which his monthly income is normally distributed with a mean of $1,000 and a
standard deviation of $300. John’s income levels from these two sources are
independent of each other.
Referring to Table 6-2, John’s commission from the jewelry store will be between what
two values, symmetrically distributed around the population mean 80% of the time?
The amount of time necessary for assembly line workers to complete a product is a
normal variable with a mean of 15 minutes and a standard deviation of 2 minutes. So,
60% of the products would be assembled within ________ and ________ minutes
(symmetrically distributed about the mean).