TABLE 17-12
The marketing manager for a nationally franchised lawn service company would like to
study the characteristics that differentiate home owners who do and do not have a lawn
service. A random sample of 30 home owners located in a suburban area near a large
city was selected; 15 did not have a lawn service (code 0) and 15 had a lawn service
(code 1). Additional information available concerning these 30 home owners includes
family income (Income, in thousands of dollars), lawn size (Lawn Size, in thousands of
square feet), attitude toward outdoor recreational activities (Attitude 0 = unfavorable, 1
= favorable), number of teenagers in the household (Teenager), and age of the head of
the household (Age).
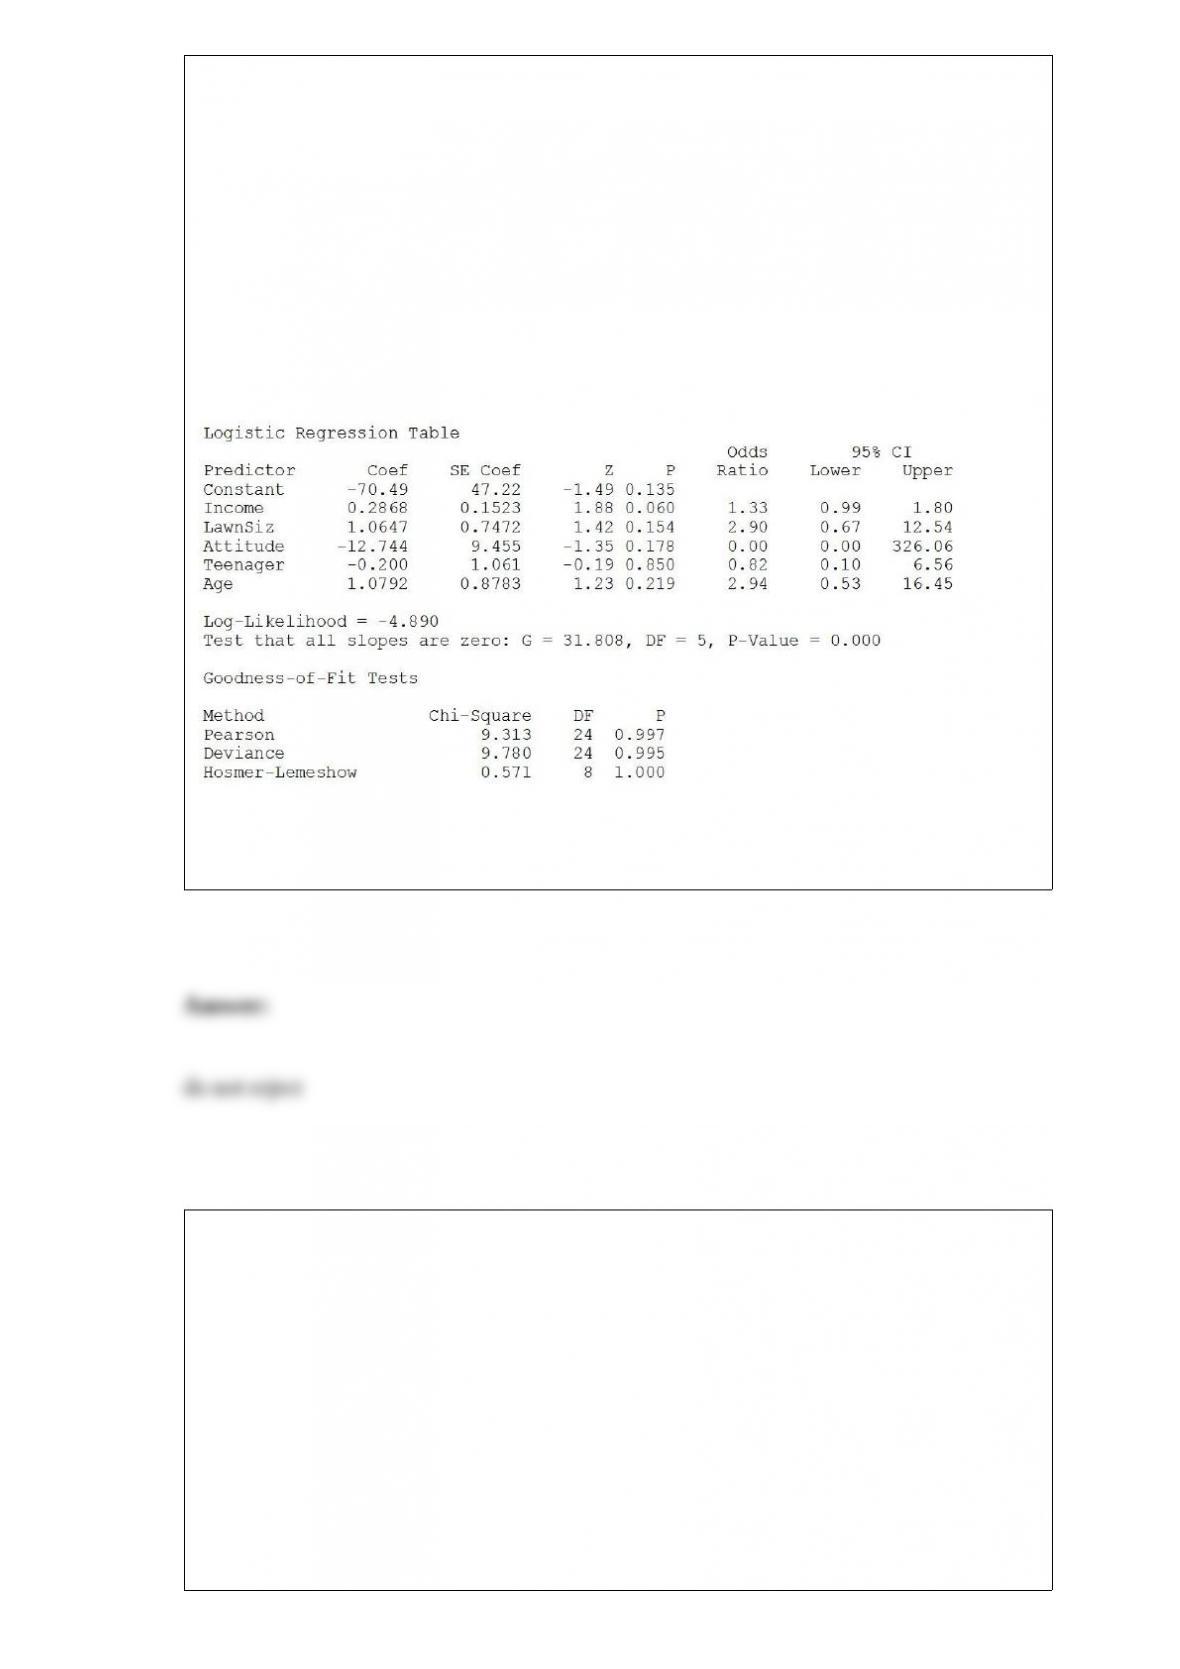
The Minitab output is given below:
Referring to Table 17-12, what should be the decision (‘reject’ or ‘do not reject’) on the
null hypothesis when testing whether LawnSize makes a significant contribution to the
model in the presence of the other independent variables at a 0.05 level of significance?
TABLE 10-6
To investigate the efficacy of a diet, a random sample of 16 male patients is selected
from a population of adult males using the diet. The weight of each individual in the
sample is taken at the start of the diet and at a medical follow-up 4 weeks later.
Assuming that the population of differences in weight before versus after the diet
follow a normal distribution, the t-test for related samples can be used to determine if
there was a significant decrease in the mean weight during this period. Suppose the
mean decrease in weights over all 16 subjects in the study is 3.0 pounds with the
standard deviation of differences computed as 6.0 pounds.
Referring to Table 10-6, the t test should be ________-tail.
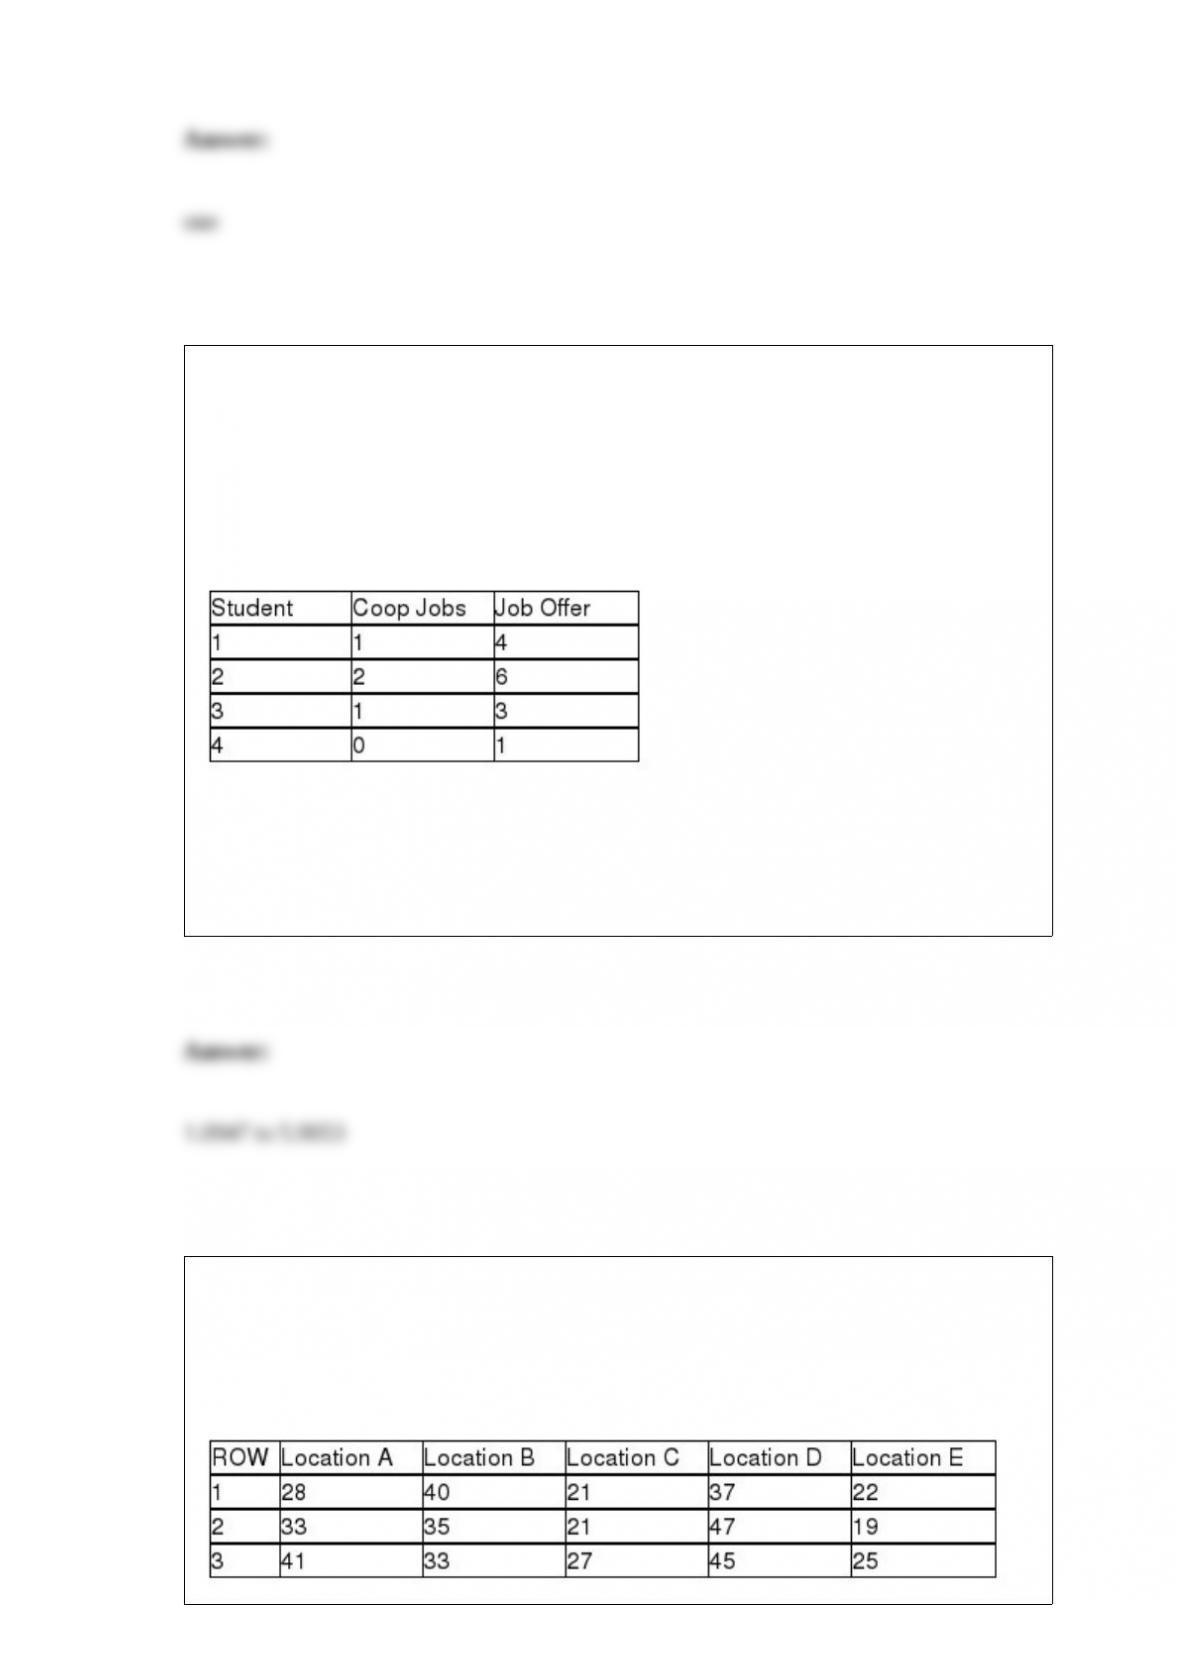
TABLE 13-3
The director of cooperative education at a state college wants to examine the effect of
cooperative education job experience on marketability in the work place. She takes a
random sample of 4 students. For these 4, she finds out how many times each had a
cooperative education job and how many job offers they received upon graduation.
These data are presented in the table below.
Referring to Table 13-3, suppose the director of cooperative education wants to
construct a 95% prediction interval estimate for the number of job offers received by
students who have had exactly one cooperative education job. The prediction interval is
from ________ to ________.
TABLE 11-5
A hotel chain has identically small sized resorts in 5 locations in different small islands.
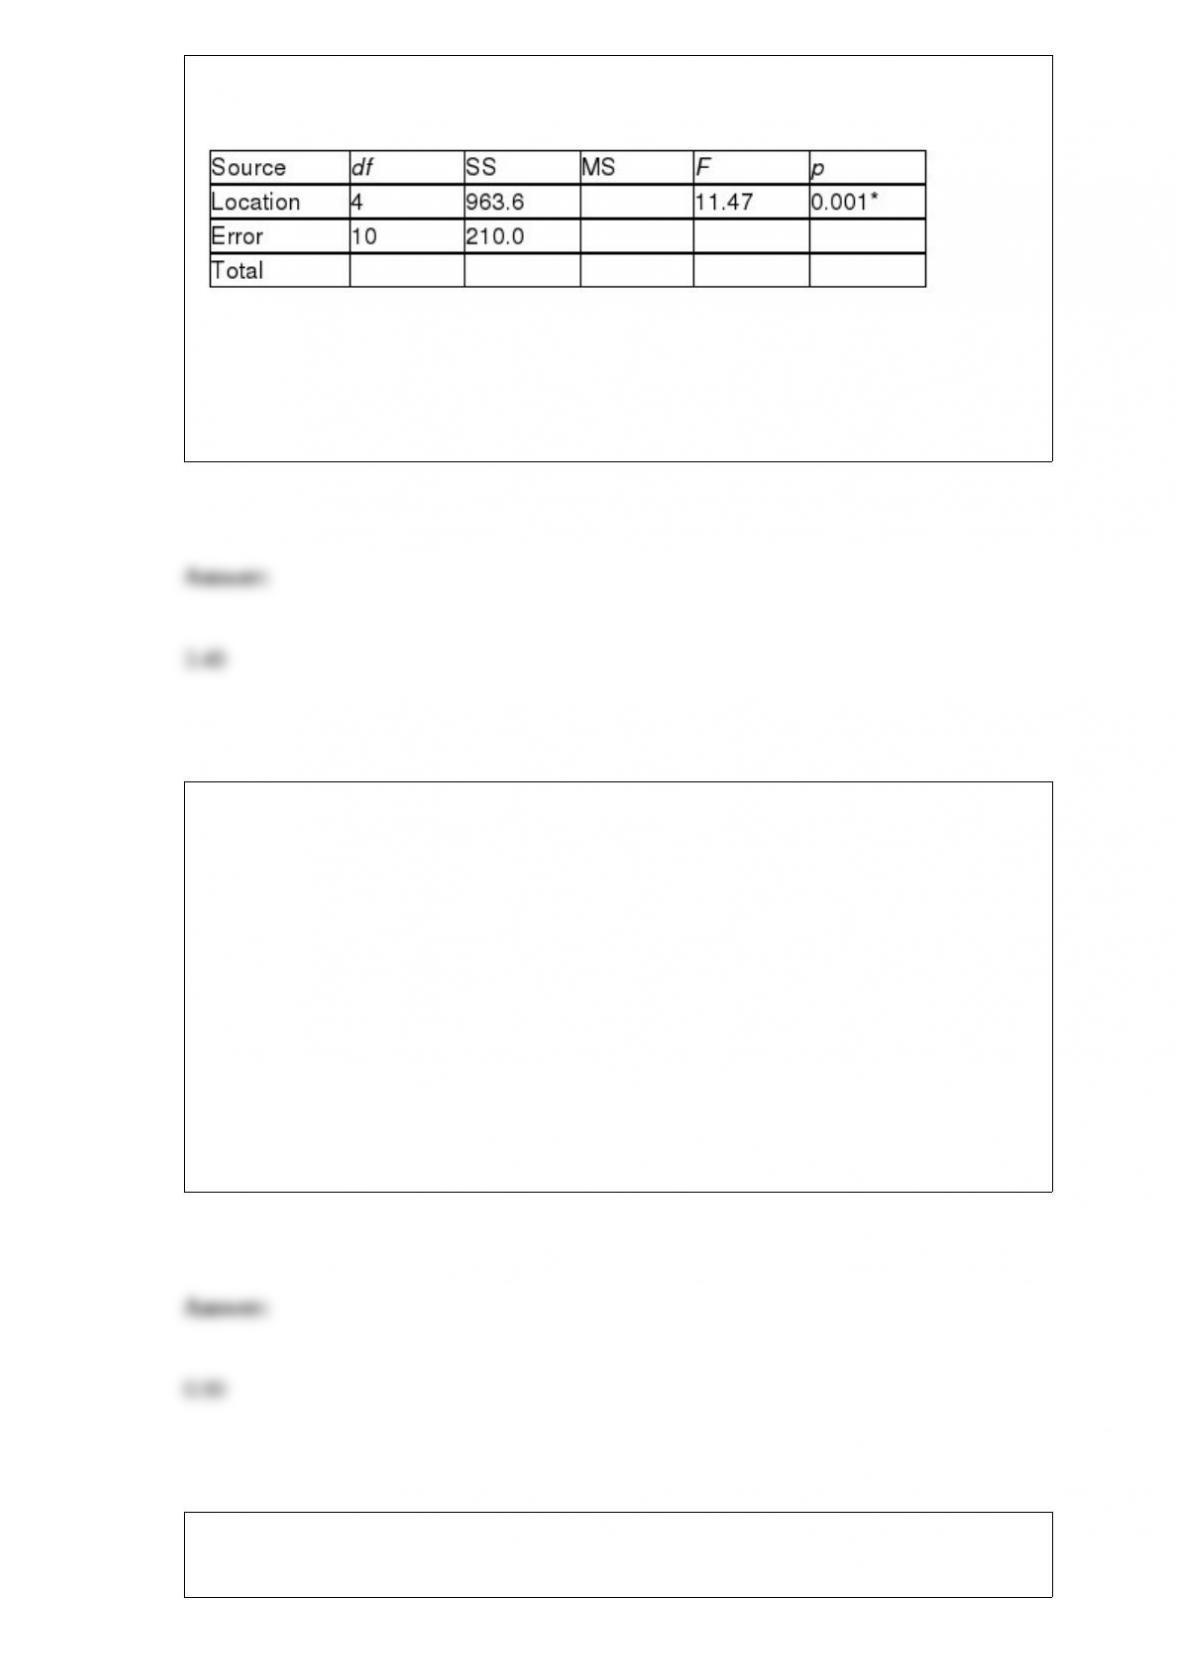
The data that follow resulted from analyzing the hotel occupancies on randomly
selected days in the 5 locations.
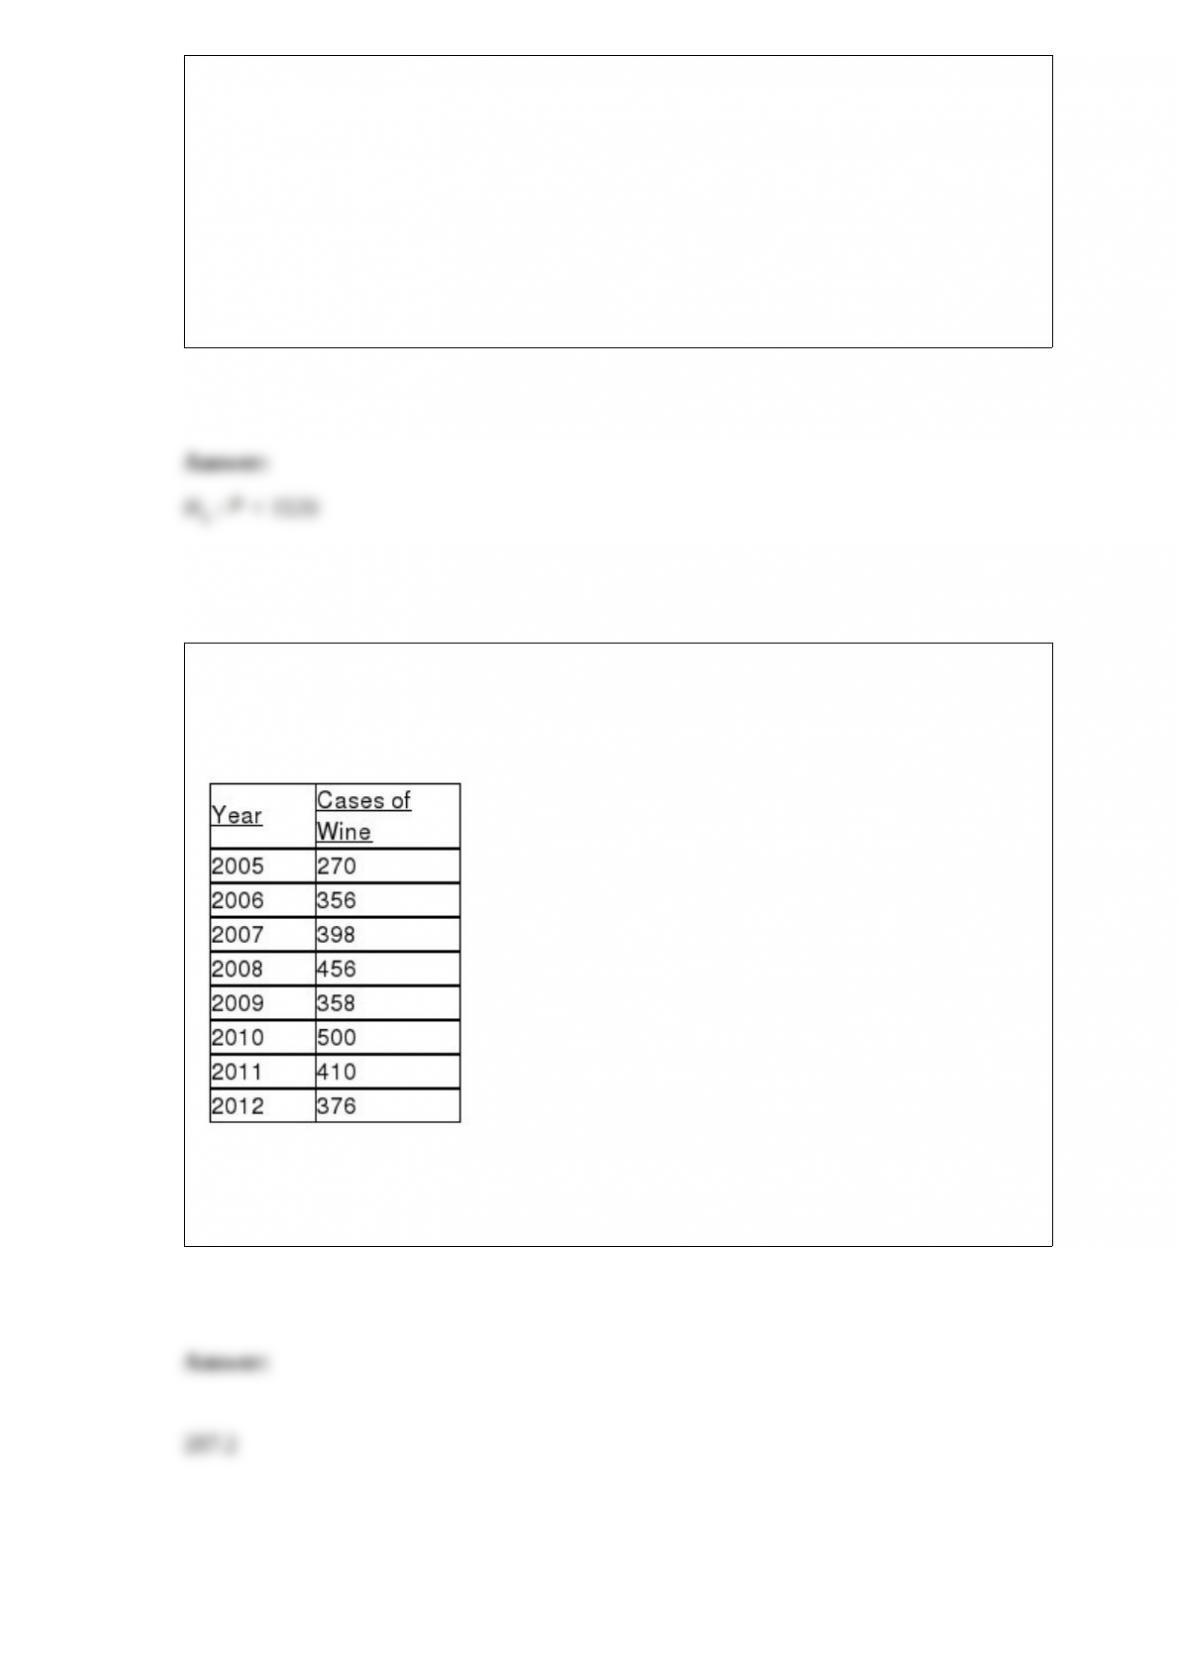
Analysis of Variance
* or p < 0.005, tabular value
Referring to Table 11-5, what is the critical value of Levene’s test for homogeneity of
variances at a 5% level of significance?
TABLE 9-12
A drug company is considering marketing a new local anesthetic. The effective time of
the anesthetic the drug company is currently producing has a normal distribution with a
mean of 7.4 minutes with a standard deviation of 1.2 minutes. The chemistry of the new
anesthetic is such that the effective time should be normally distributed with the same
standard deviation. The company will market the new local anesthetic as being better if
there is evidence that the population mean effective time is greater than the 7.4 minutes
of the current local anesthetic.
Referring to Table 9-12, if you select a sample of 25 new local anesthetics and are
willing to have a level of significance of 0.1, the confidence coefficient of the test is
________ if the population mean effective time is 8 minutes.
TABLE 9-9
The president of a university claimed that the entering class this year appeared to be
larger than the entering class from previous years but their mean SAT score is lower
than previous years. He took a sample of 20 of this year’s entering students and found
that their mean SAT score is 1,501 with a standard deviation of 53. The university’s
record indicates that the mean SAT score for entering students from previous years is
1,520. He wants to find out if his claim is supported by the evidence at a 5% level of
significance.
Referring to Table 9-9, state the alternative hypothesis for this study.
TABLE 16-4
The number of cases of merlot wine sold by a Paso Robles winery in an 8-year period
follows.
Referring to Table 16-4, exponential smoothing with a weight or smoothing constant of
0.2 will be used to smooth the wine sales. The value of E2, the smoothed value for 2006
is ________.
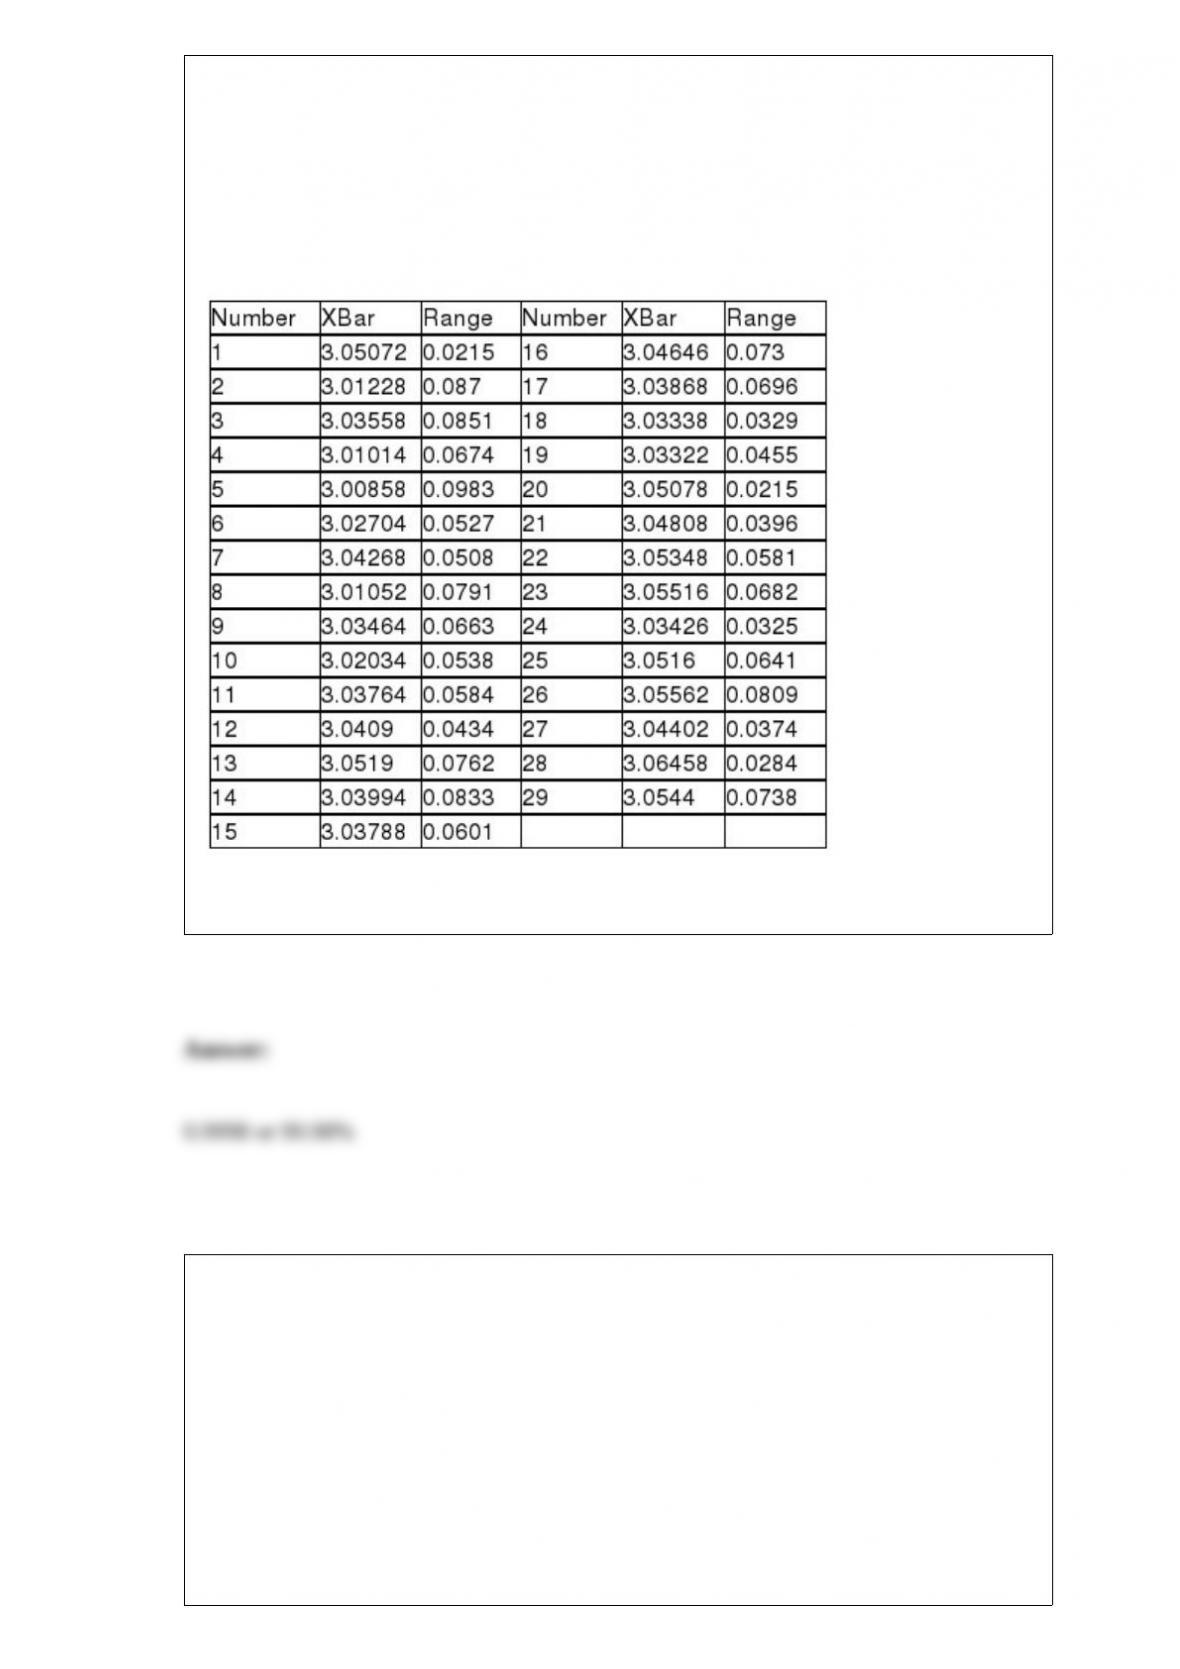
TABLE 18-9
The manufacturer of canned food constructed control charts and analyzed several
quality characteristics. One characteristic of interest is the weight of the filled cans. The
lower specification limit for weight is 2.95 pounds. The table below provides the range
and mean of the weights of five cans tested every fifteen minutes during a day’s
production.
Referring to Table 18-9, estimate the percentage of the cans whose weight is inside the
specification limit.
TABLE 6-2
John has two jobs. For daytime work at a jewelry store he is paid $15,000 per month,
plus a commission. His monthly commission is normally distributed with a mean of
$10,000 and a standard deviation of $2,000. At night he works occasionally as a waiter,
for which his monthly income is normally distributed with a mean of $1,000 and a
standard deviation of $300. John’s income levels from these two sources are
independent of each other.
Referring to Table 6-2, the probability is 0.35 that John’s income as a waiter is no less
than how much in a given month?