TABLE 17-10
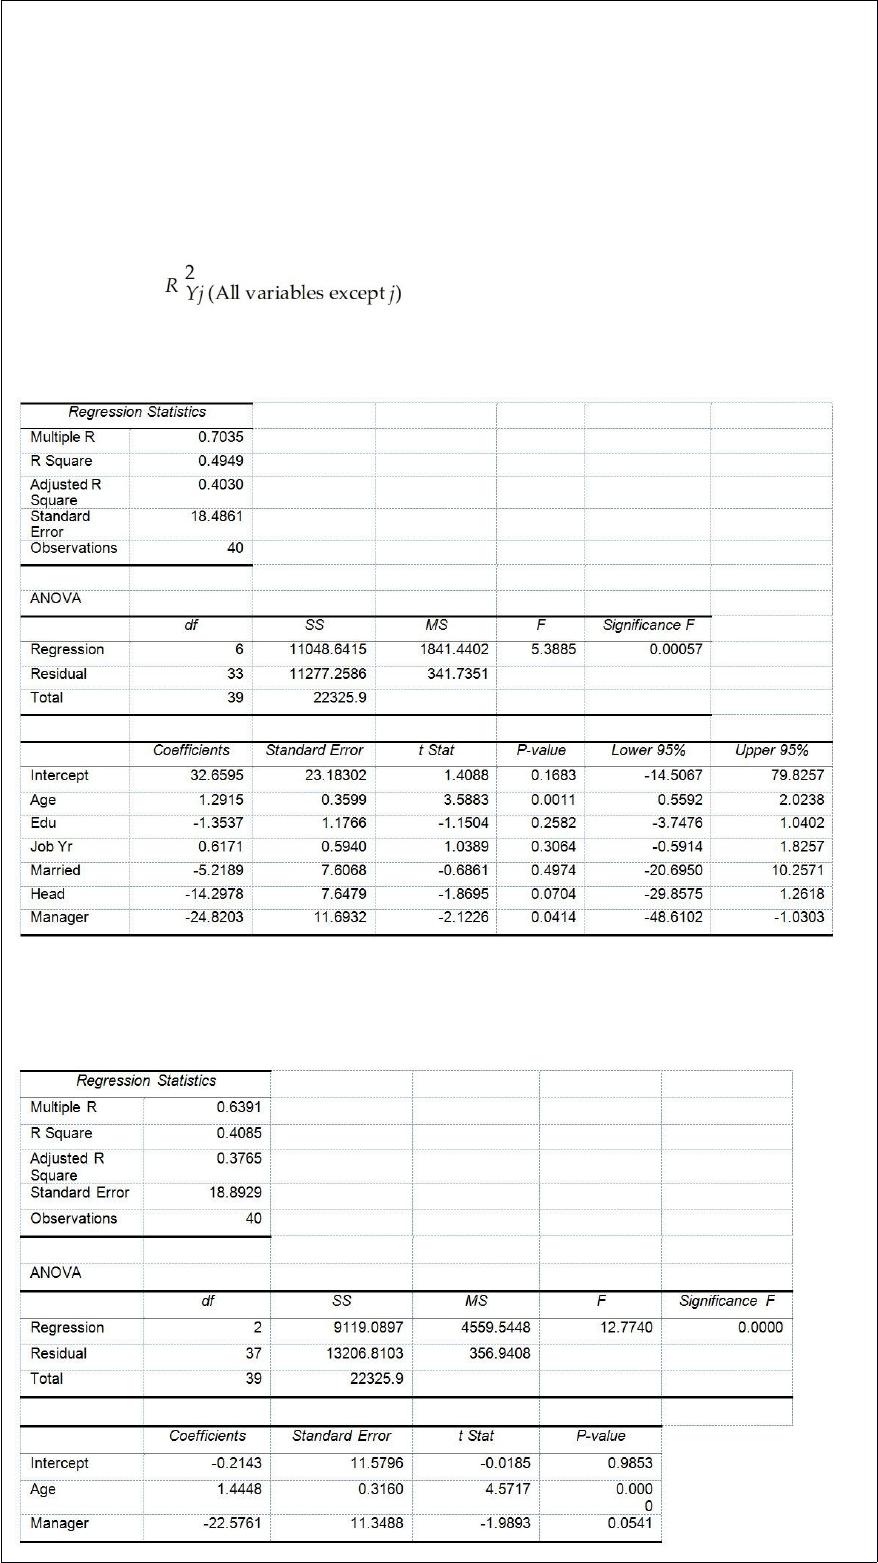
Given below are results from the regression analysis where the dependent variable is
the number of weeks a worker is unemployed due to a layoff (Unemploy) and the
independent variables are the age of the worker (Age), the number of years of education
received (Edu), the number of years at the previous job (Job Yr), a dummy variable for
marital status (Married: 1 = married, 0 = otherwise), a dummy variable for head of
household (Head: 1 = yes, 0 = no) and a dummy variable for management position
(Manager: 1 = yes, 0 = no). We shall call this Model 1. The coefficient of partial
determination ( ) of each of the 6 predictors are, respectively,
0.2807, 0.0386, 0.0317, 0.0141, 0.0958, and 0.1201.
Model 2 is the regression analysis where the dependent variable is Unemploy and the
independent variables are Age and Manager. The results of the regression analysis are
given below:
Referring to Table 17-10, Model 1, what is the p-value of the test statistic to determine
whether there is a significant relationship between the number of weeks a worker is
unemployed due to a layoff and the entire set of explanatory variables?
TABLE 3-10
The population of eight analysts at a software firm were asked to estimate the reuse rate
when developing a new software system. The following data are given as a percentage
of the total code written for a software system that is part of the reuse database.
50, 62.5, 37.5, 75.0, 45.0, 47.5, 15.0, 25.0
Referring to Table 3-10, what is the mean percentage of the total code that is part of the
reuse database?
The amount of time between successive TV watching by first graders follows an
exponential distribution with a mean of 10 hours. The probability that a given first
grader spends more than 5 hours between successive TV watching is ________.
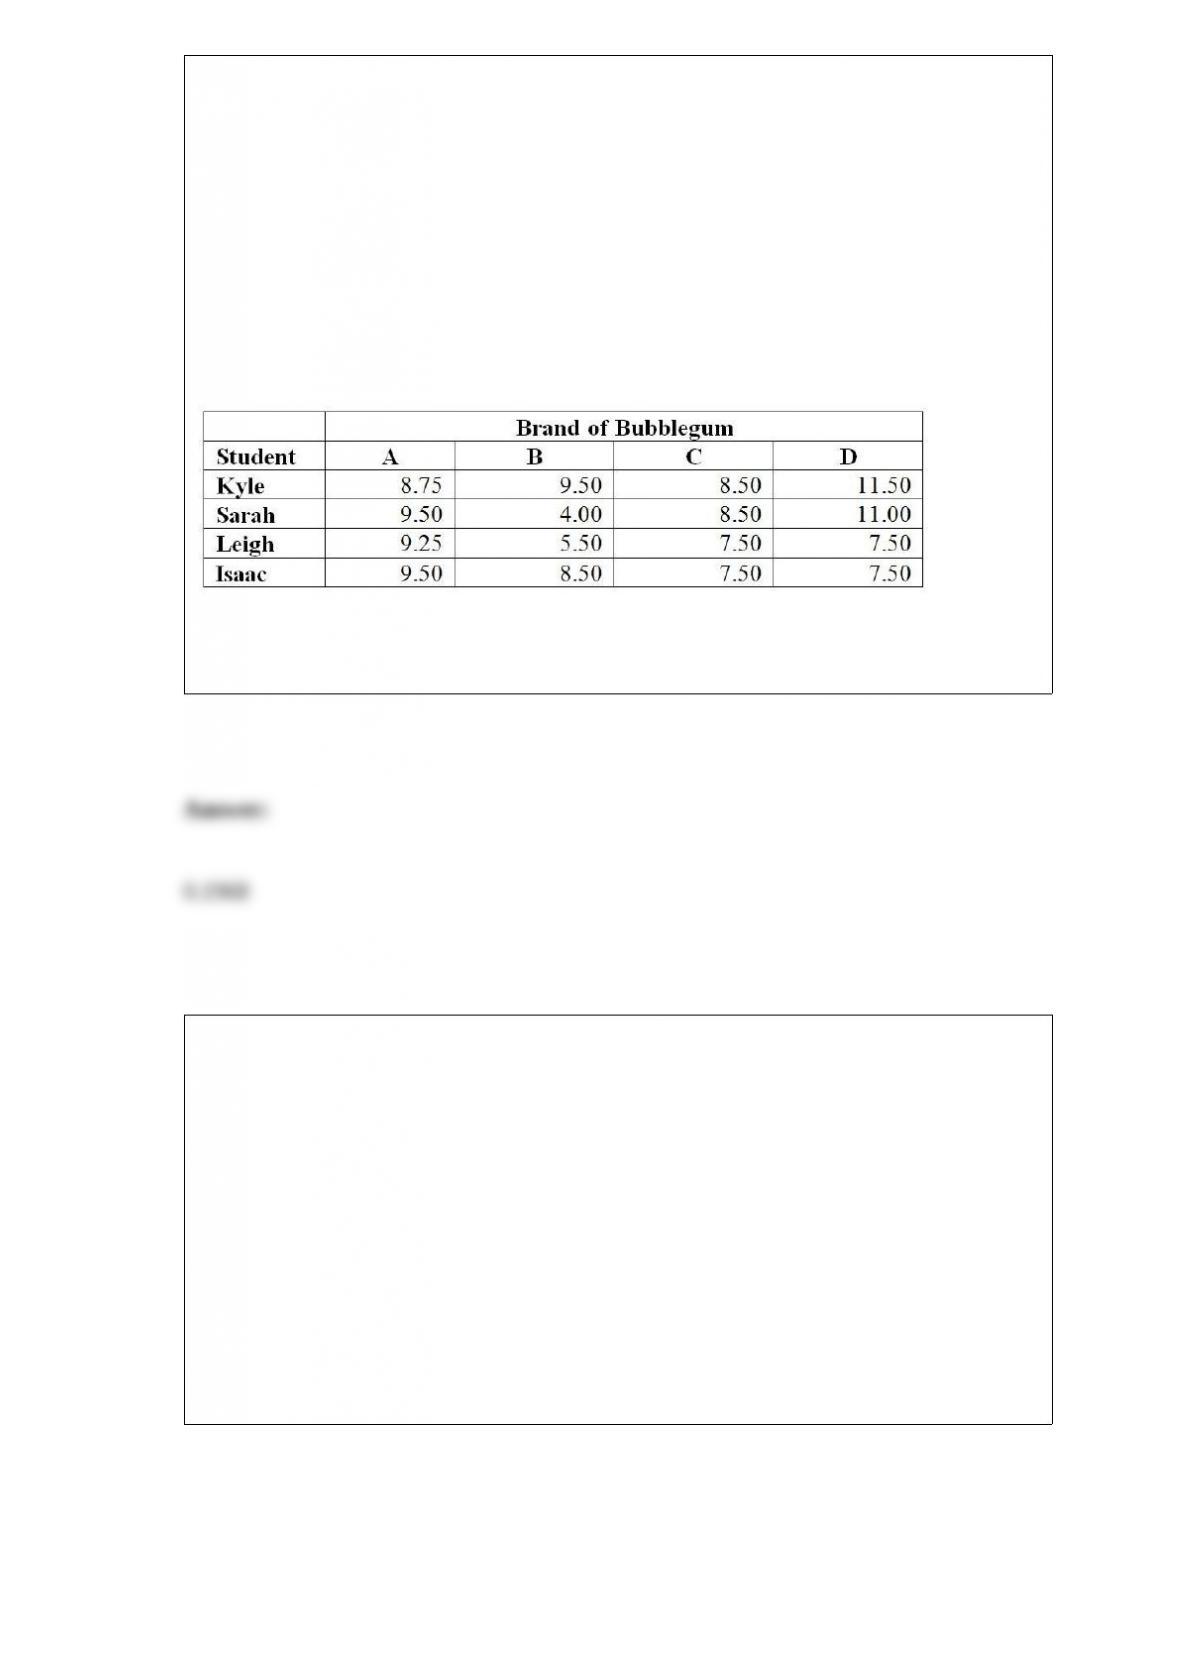
TABLE 11-11
A student team in a business statistics course designed an experiment to investigate
whether the brand of bubblegum used affected the size of bubbles they could blow. To
reduce the person-to-person variability, the students decided to use a randomized block
design using themselves as blocks.
Four brands of bubblegum were tested. A student chewed two pieces of a brand of gum
and then blew a bubble, attempting to make it as big as possible. Another student
measured the diameter of the bubble at its biggest point. The following table gives the
diameters of the bubbles (in inches) for the 16 observations.
Referring to Table 11-11, what is the p-value of the test statistic for the randomized
block F test for the difference in the means?
TABLE 17-12
The marketing manager for a nationally franchised lawn service company would like to
study the characteristics that differentiate home owners who do and do not have a lawn
service. A random sample of 30 home owners located in a suburban area near a large
city was selected; 15 did not have a lawn service (code 0) and 15 had a lawn service
(code 1). Additional information available concerning these 30 home owners includes
family income (Income, in thousands of dollars), lawn size (Lawn Size, in thousands of
square feet), attitude toward outdoor recreational activities (Attitude 0 = unfavorable, 1
= favorable), number of teenagers in the household (Teenager), and age of the head of
the household (Age).
The Minitab output is given below:
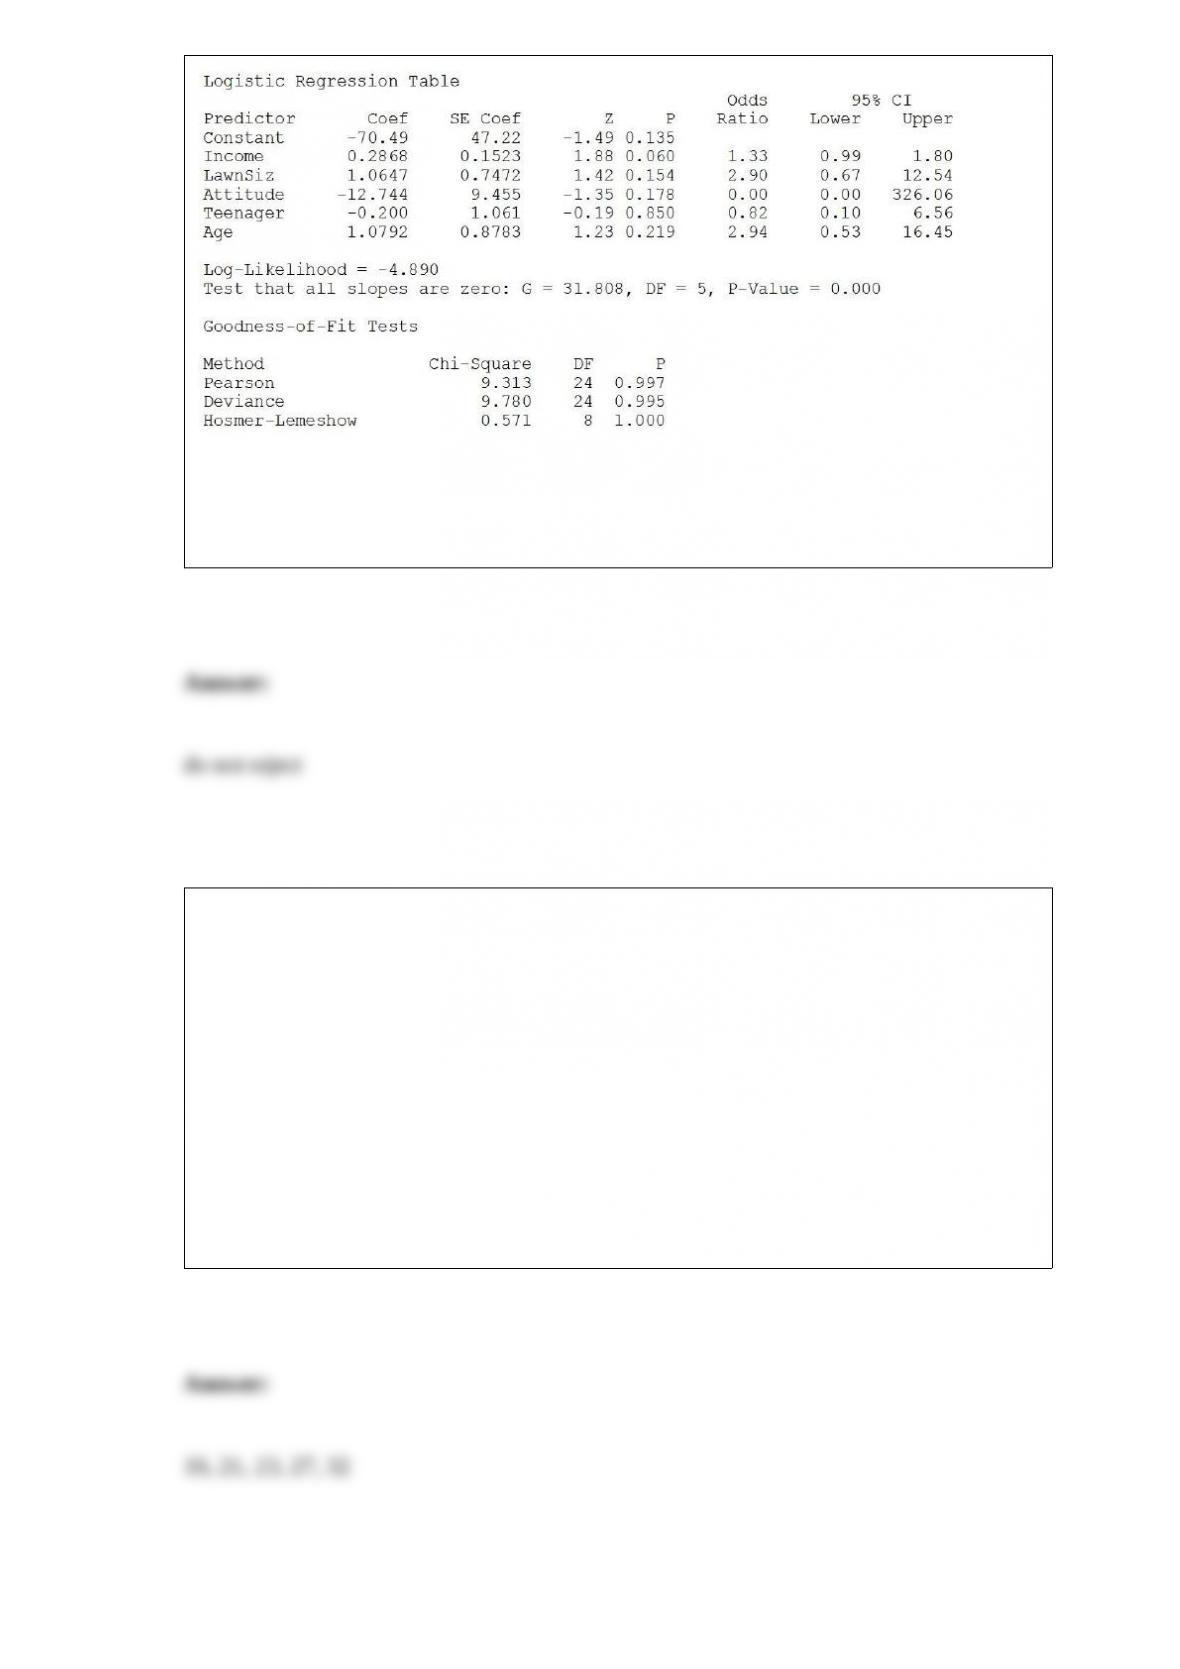
Referring to Table 17-12, what should be the decision (‘reject’ or ‘do not reject’) on the
null hypothesis when testing whether LawnSize makes a significant contribution to the
model in the presence of the other independent variables at a 0.05 level of significance?
TABLE 3-4
The ordered array below represents the number of cargo manifests approved by customs
inspectors of the Port of New York in a sample of 35 days:
16, 17, 18, 18, 19, 20, 20, 21, 21, 21, 22, 22, 22, 22, 23, 23, 23, 23, 24, 24, 24, 25, 25,
26, 26, 26, 27, 28, 28, 29, 29, 31, 31, 32, 32
Note: For this sample, the sum of the values is 838, and the sum of the squared
differences between each value and the mean is 619.89.
Referring to Table 3-4, the five-number summary for the data in the customs sample
consists of ________, ________, ________, ________, ________.
TABLE 4-8
According to the record of the registrar’s office at a state university, 35% of the students
are freshman, 25% are sophomore, 16% are junior and the rest are senior. Among the
freshmen, sophomores, juniors and seniors, the portion of students who live in the
dormitory are, respectively, 80%, 60%, 30% and 20%.
Referring to Table 4-8, if a randomly selected student does not live in the dormitory,
what is the probability that the student is a junior or a senior?