Eleven freshmen are to be assigned to eleven empty rooms in a student dormitory. Each
room is considered unique so that it matters who is being assigned to which room. How
many different ways can those eleven freshmen be allocated?
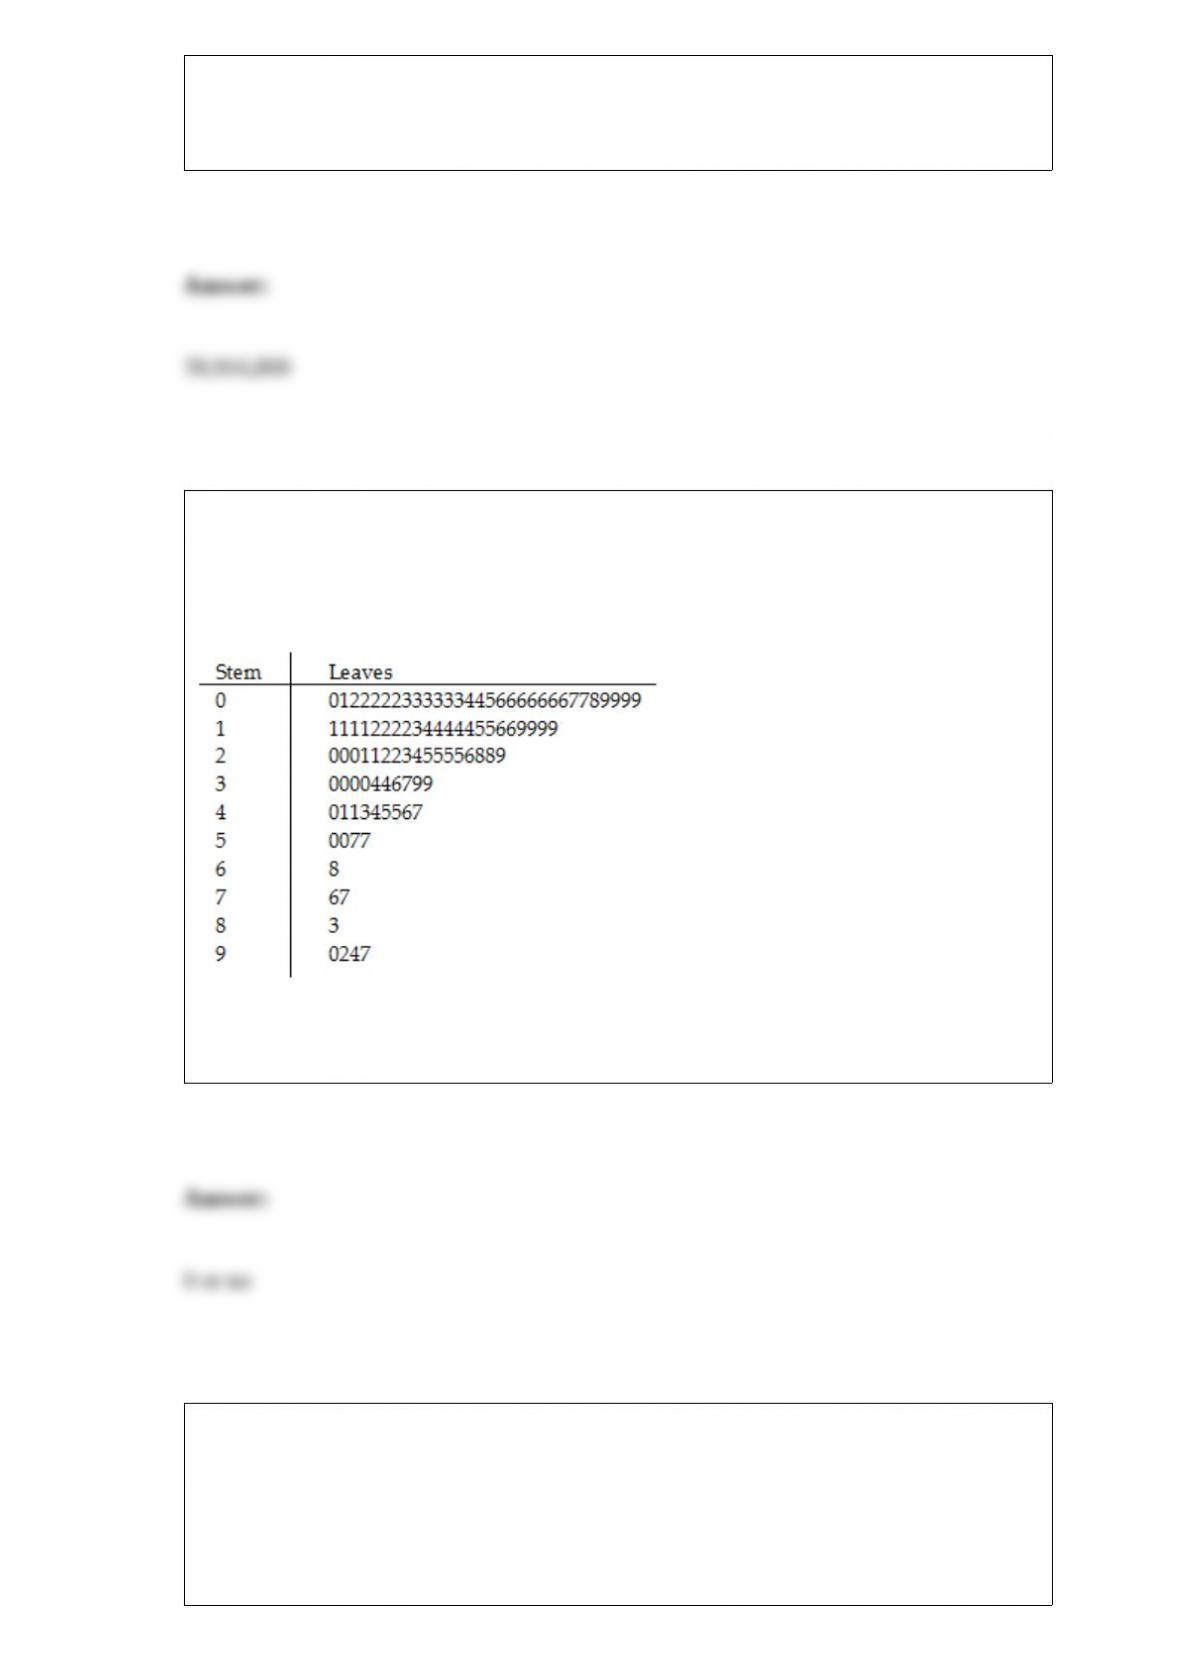
TABLE 2-8
The Stem-and-Leaf display represents the number of times in a year that a random
sample of 100 “lifetime” members of a health club actually visited the facility.
Referring to Table 2-8, the person who visited the health club less than anyone else in
the sample visited the facility ________ times.
Referring to Table 14-8, the value of the partial F test statistic is
________ for
H0 : Variable X1 does not significantly improve the model after
variable X2 has been included
H1 : Variable X1 significantly improves the model after variable X2 has
been includedTABLE 14-8
A financial analyst wanted to examine the relationship between salary
(in $1,000) and 2 variables: age
(X1 = Age) and experience in the field (X2 = Exper). He took a sample
of 20 employees and obtained the following Microsoft Excel output:
Also, the sum of squares due to the regression for the model that
includes only Age is 5022.0654 while the sum of squares due to the
regression for the model that includes only Exper is 125.9848.
TABLE 5-6
The quality control manager of Green Bulbs Inc. is inspecting a batch of energy saving
compact fluorescent light bulbs. When the production process is in control, the average
number of bad bulbs per shift is 6.0.
Referring to Table 5-6, what is the probability that any particular shift being inspected
has produced 4.0 bad bulbs?
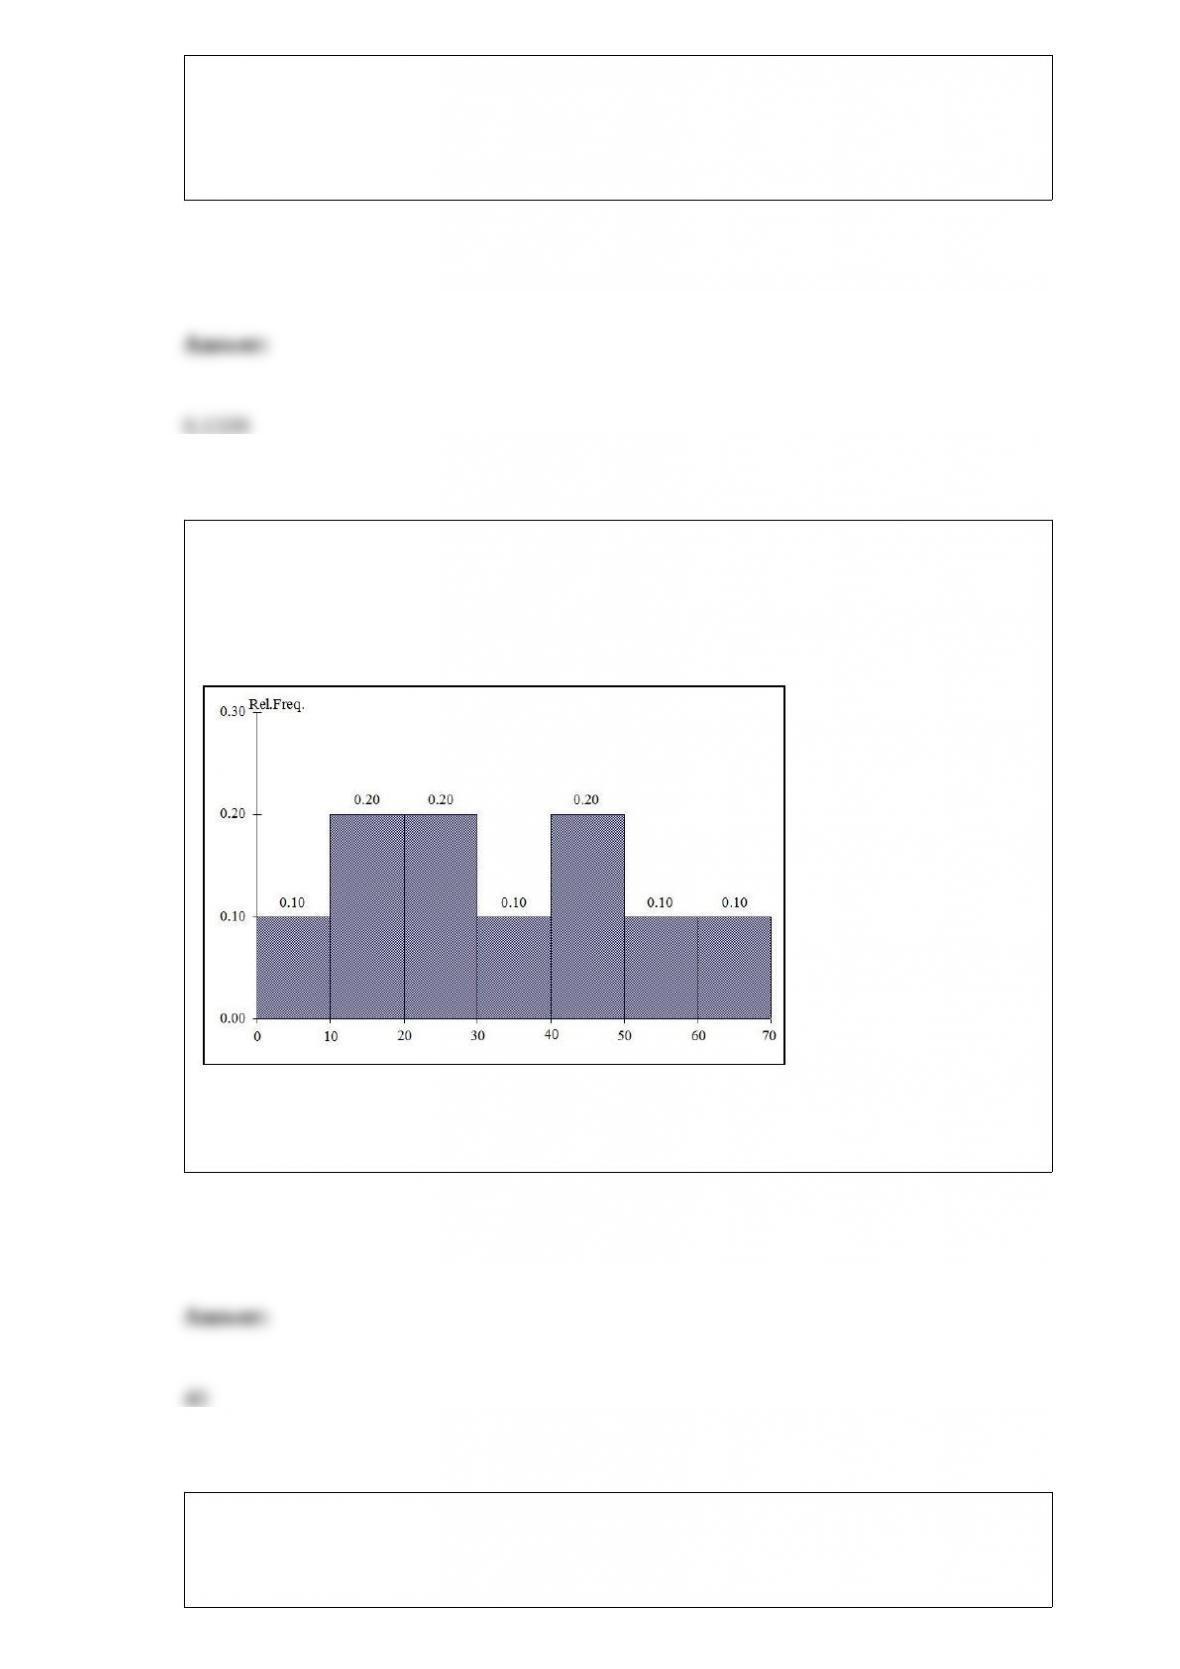
TABLE 2-10
The histogram below represents scores achieved by 200 job applicants on a personality
profile.
Referring to the histogram from Table 2-10, the number of job applicants who scored
50 or above is ________.
TABLE 2-11
The ordered array below resulted from selecting a sample of 25 batches of 500
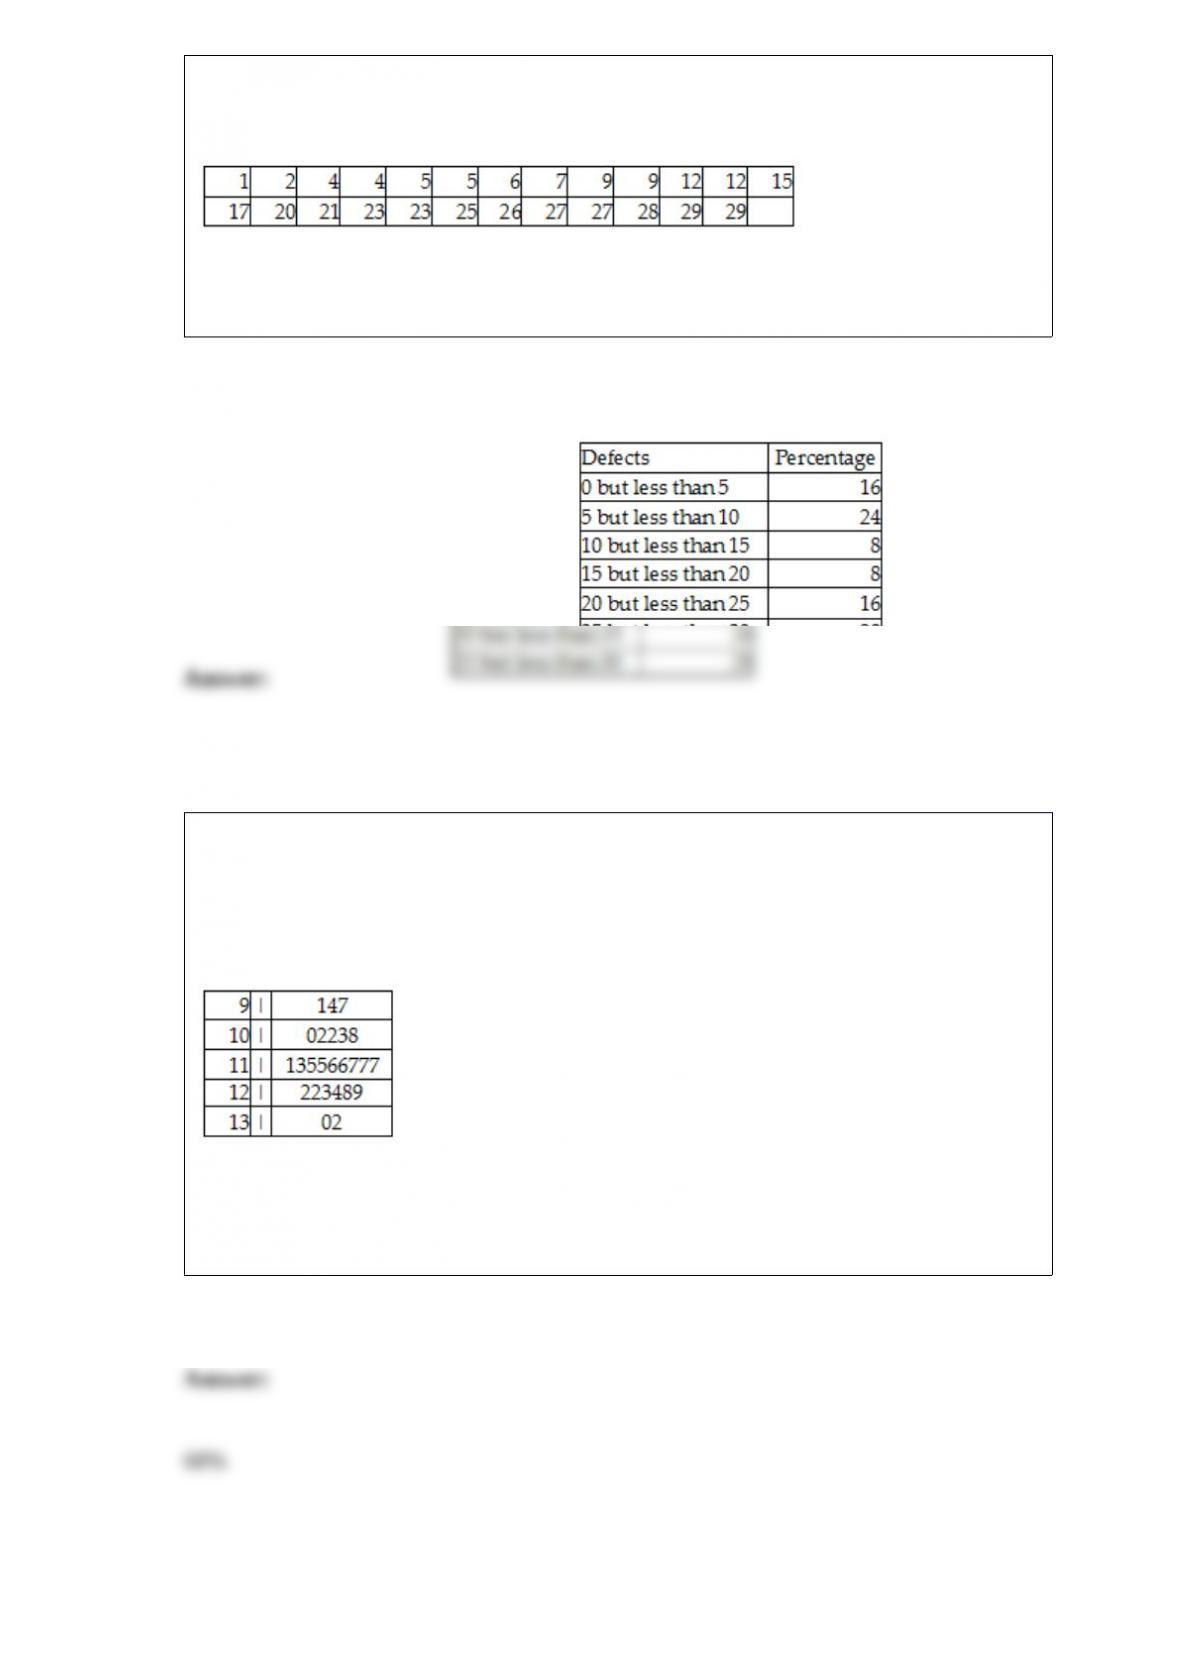
computer chips and determining how many in each batch were defective.
Defects
Referring to Table 2-11, construct a relative frequency or percentage distribution for the
defects data, using “0 but less than 5” as the first class.
TABLE 2-13
Given below is the stem-and-leaf display representing the amount of detergent used in
gallons (with leaves in 10ths of gallons) in a day by 25 drive-through car wash
operations in Phoenix.
Referring to Table 2-13, if a percentage histogram for the detergent data is constructed,
using “9.0 but less than 10.0 gallons” as the first class, what percentage of
drive-through car wash operations use less than 12 gallons of detergent in a day?
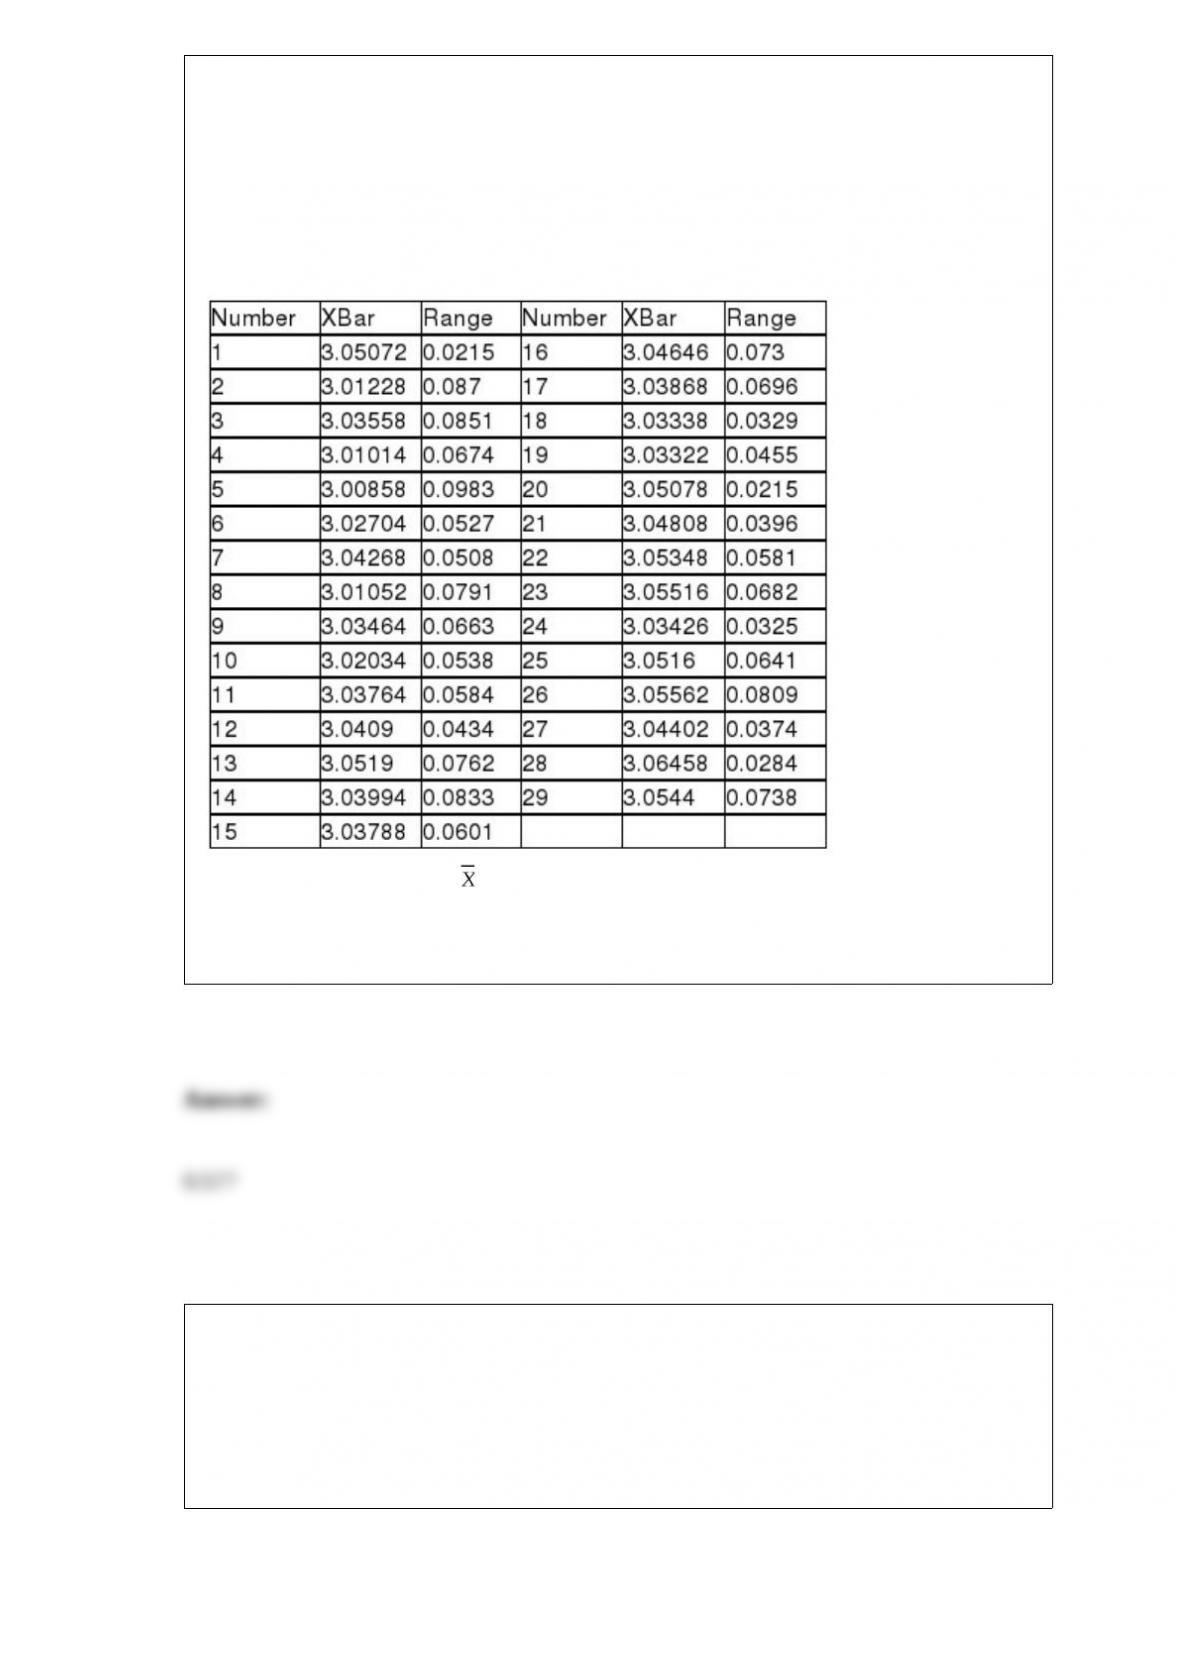
TABLE 18-9
The manufacturer of canned food constructed control charts and analyzed several
quality characteristics. One characteristic of interest is the weight of the filled cans. The
lower specification limit for weight is 2.95 pounds. The table below provides the range
and mean of the weights of five cans tested every fifteen minutes during a day’s
production.
Referring to Table 18-9, an chart is to be used for the weight. One way to obtain the
control limits is to take the grand mean and add and subtract the product of A2 times the
mean of the sample ranges. For this data set, the value of A2 is ________.
TABLE 13-10
The management of a chain electronic store would like to develop a model for
predicting the weekly sales (in thousands of dollars) for individual stores based on the
number of customers who made purchases. A random sample of 12 stores yields the
following results:
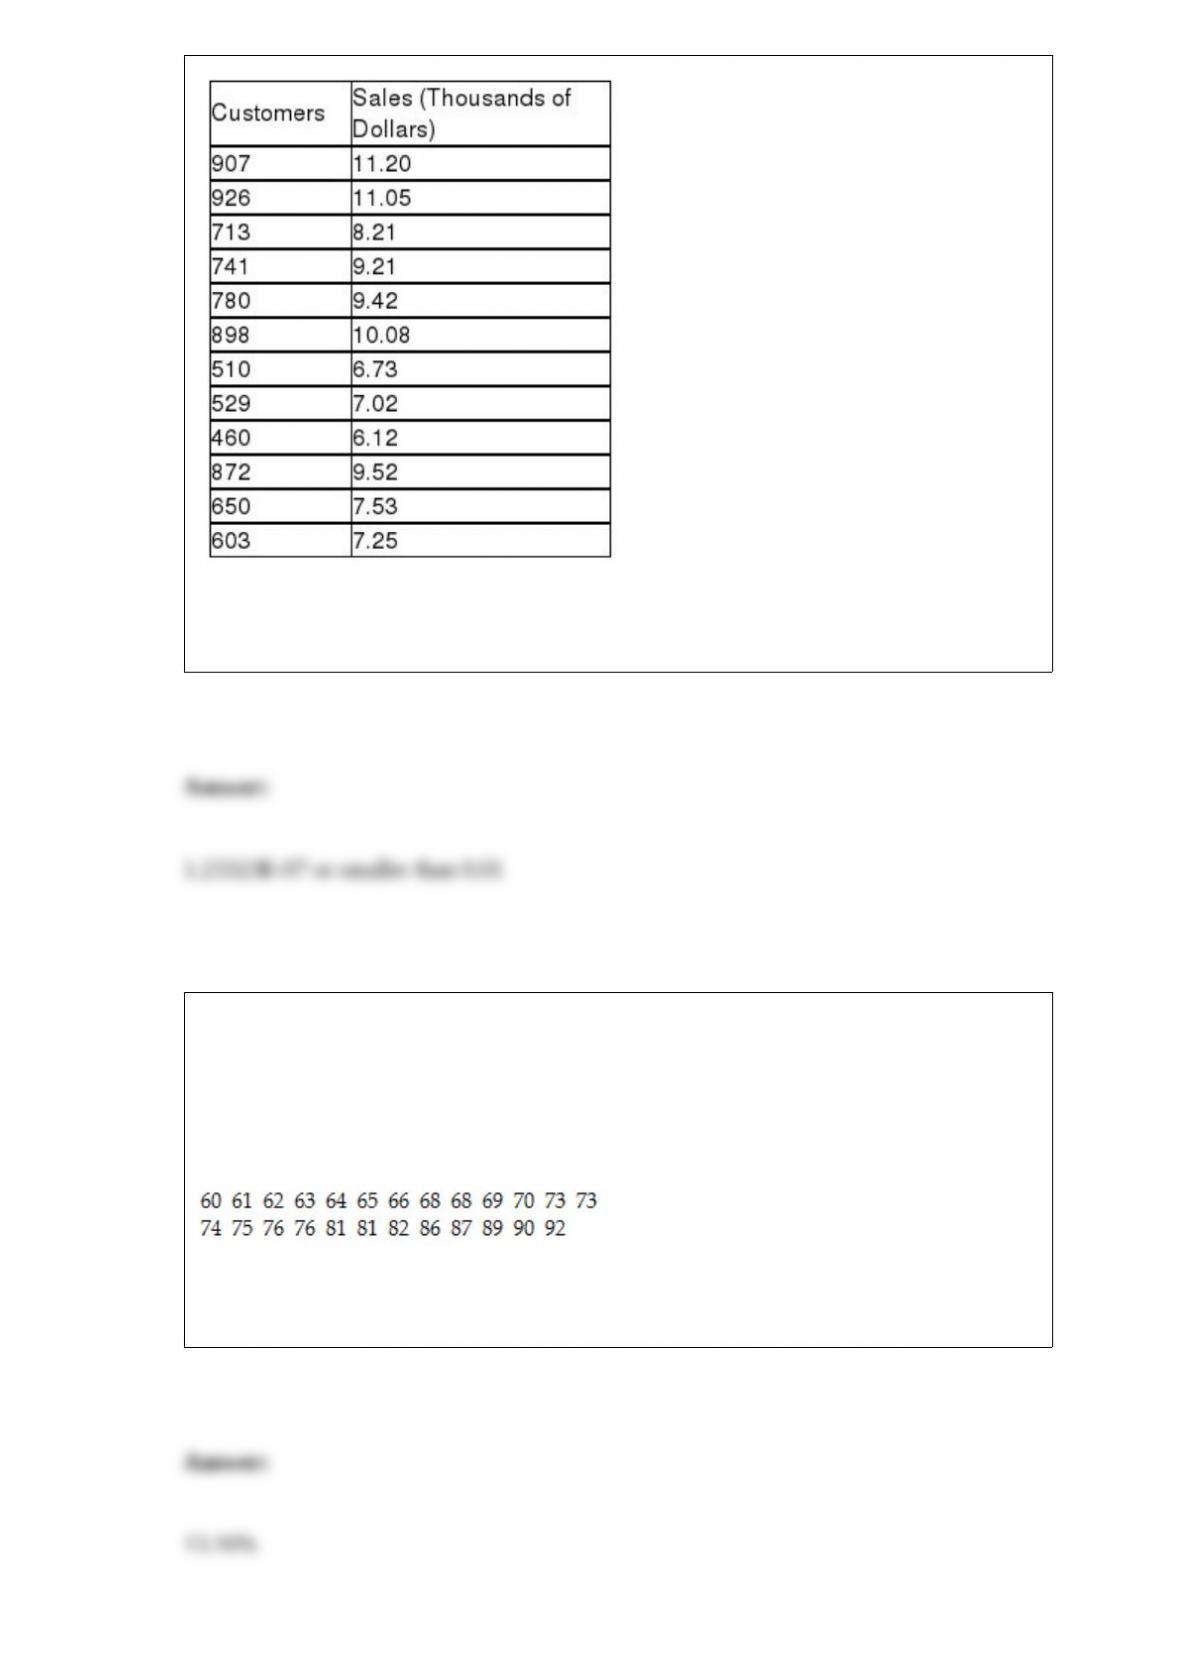
Referring to Table 13-10, what is the p-value of the t test statistic when testing whether
the number of customers who make a purchase affects weekly sales?
TABLE 3-1
Health care issues are receiving much attention in both academic and political arenas. A
sociologist recently conducted a survey of citizens over 60 years of age whose net
worth is too high to qualify for Medicaid. The ages of 25 senior citizens were as
follows:
Referring to Table 3-1, calculate the coefficient of variation of the ages of the senior
citizens.