
Referring to Table 14-8, the critical value of an F test on the entire
regression for a level of significance of 0.01 is ________.TABLE 14-8
A financial analyst wanted to examine the relationship between salary
(in $1,000) and 2 variables: age
(X1 = Age) and experience in the field (X2 = Exper). He took a sample
of 20 employees and obtained the following Microsoft Excel output:
Also, the sum of squares due to the regression for the model that
includes only Age is 5022.0654 while the sum of squares due to the
regression for the model that includes only Exper is 125.9848.
TABLE 3-12
Given below are the rating and performance scores of 15 laptop computers.
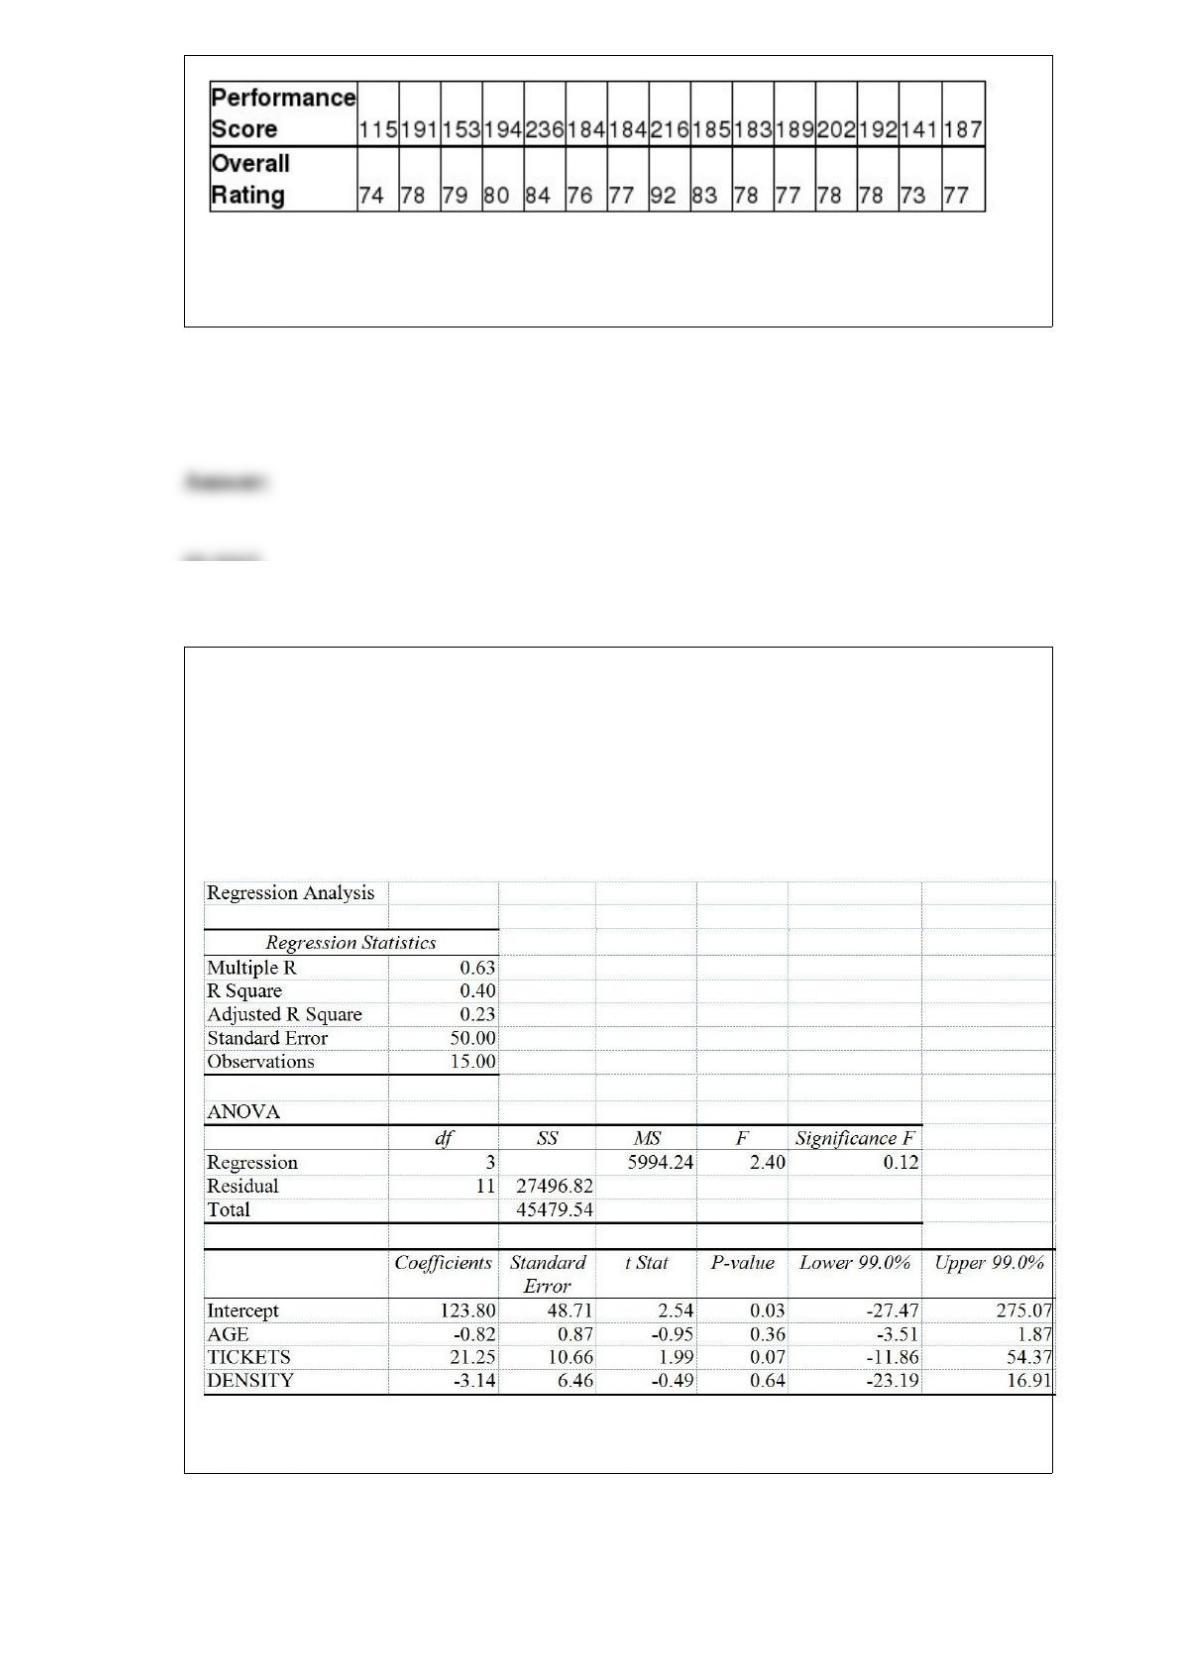
Referring to Table 3-12, what is the sample covariance between the performance scores
and the rating?
TABLE 17-5
You worked as an intern at We Always Win Car Insurance Company last summer. You
notice that individual car insurance premiums depend very much on the age of the
individual, the number of traffic tickets received by the individual, and the population
density of the city in which the individual lives. You performed a regression analysis in
EXCEL and obtained the following information:
Referring to Table 17-5, the estimated mean change in insurance premiums for every 2
additional tickets received is ________.
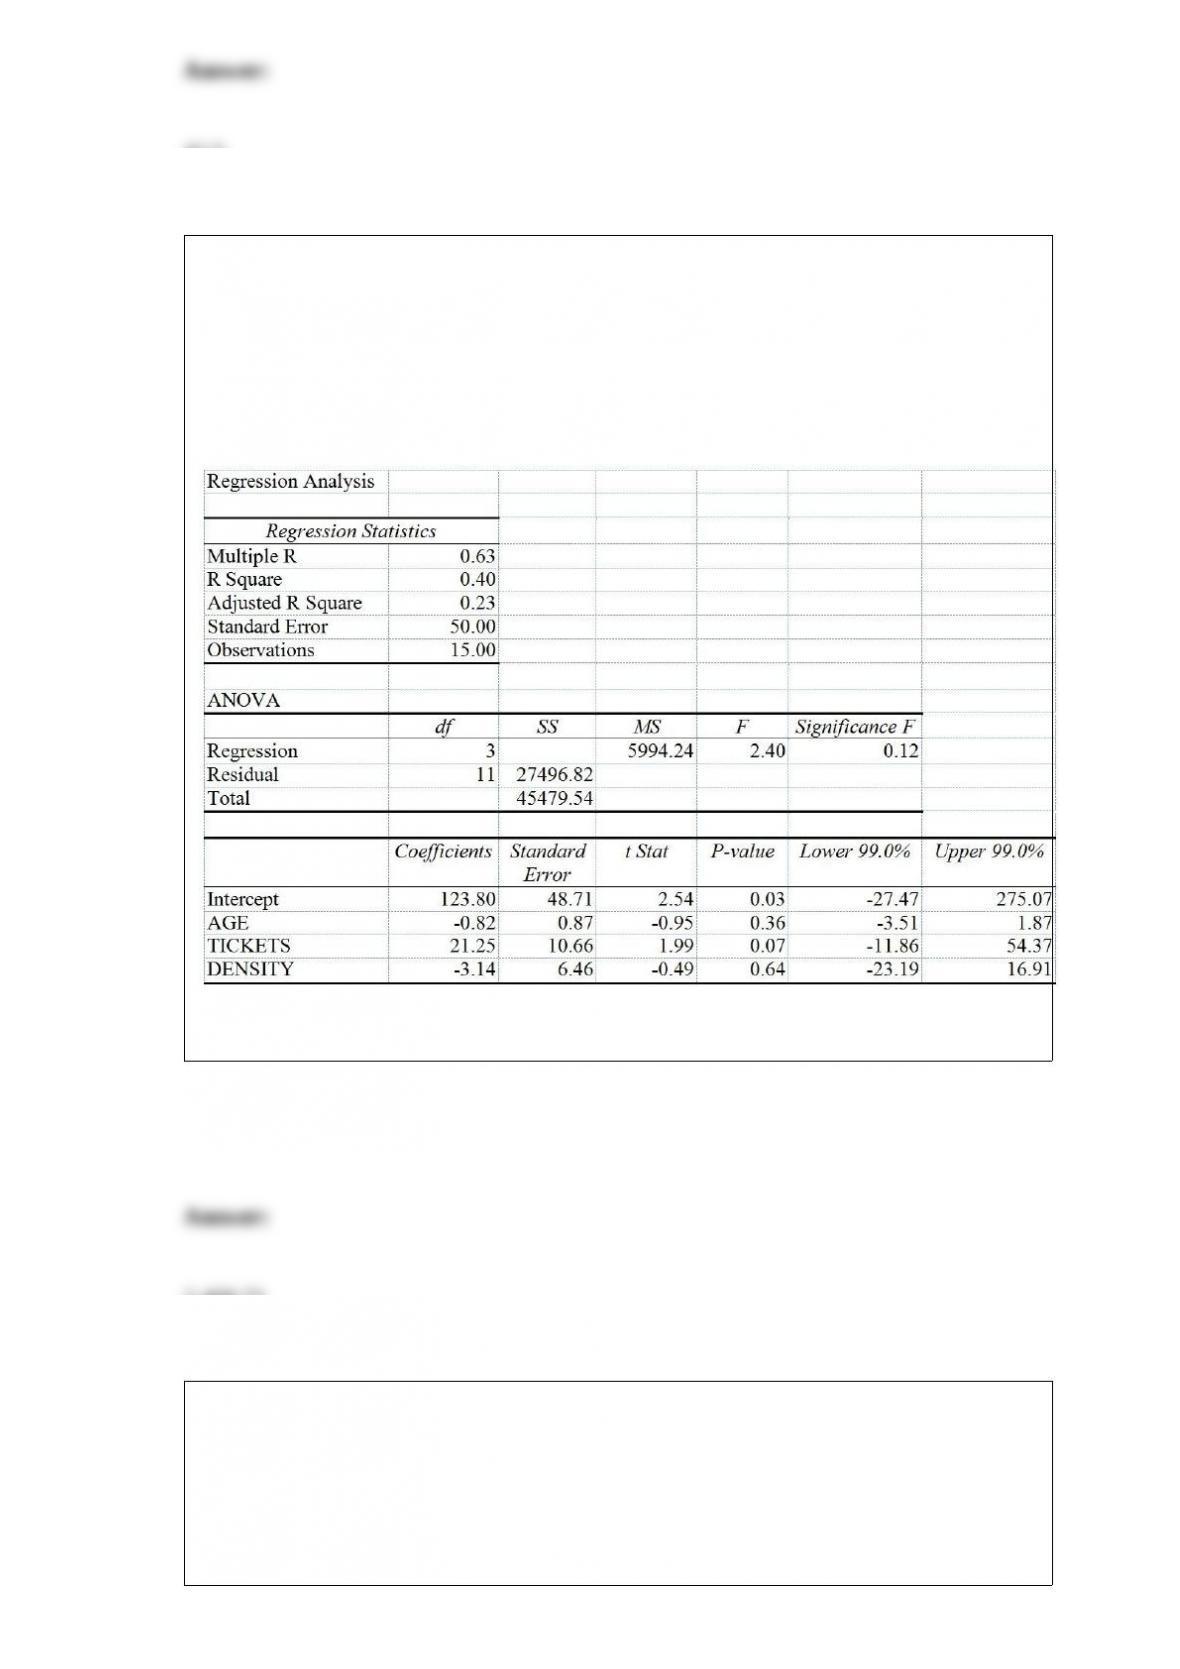
TABLE 17-5
You worked as an intern at We Always Win Car Insurance Company last summer. You
notice that individual car insurance premiums depend very much on the age of the
individual, the number of traffic tickets received by the individual, and the population
density of the city in which the individual lives. You performed a regression analysis in
EXCEL and obtained the following information:
Referring to Table 17-5, the residual mean squares (MSE) that are missing in the
ANOVA table should be ________.
TABLE 16-6
The president of a chain of department stores believes that her stores’ total sales have
been showing a linear trend since 1993. She uses Microsoft Excel to obtain the partial
output below. The dependent variable is sales (in millions of dollars), while the
independent variable is coded years, where 1993 is coded as 0, 1994 is coded as 1, etc.
SUMMARY OUTPUT
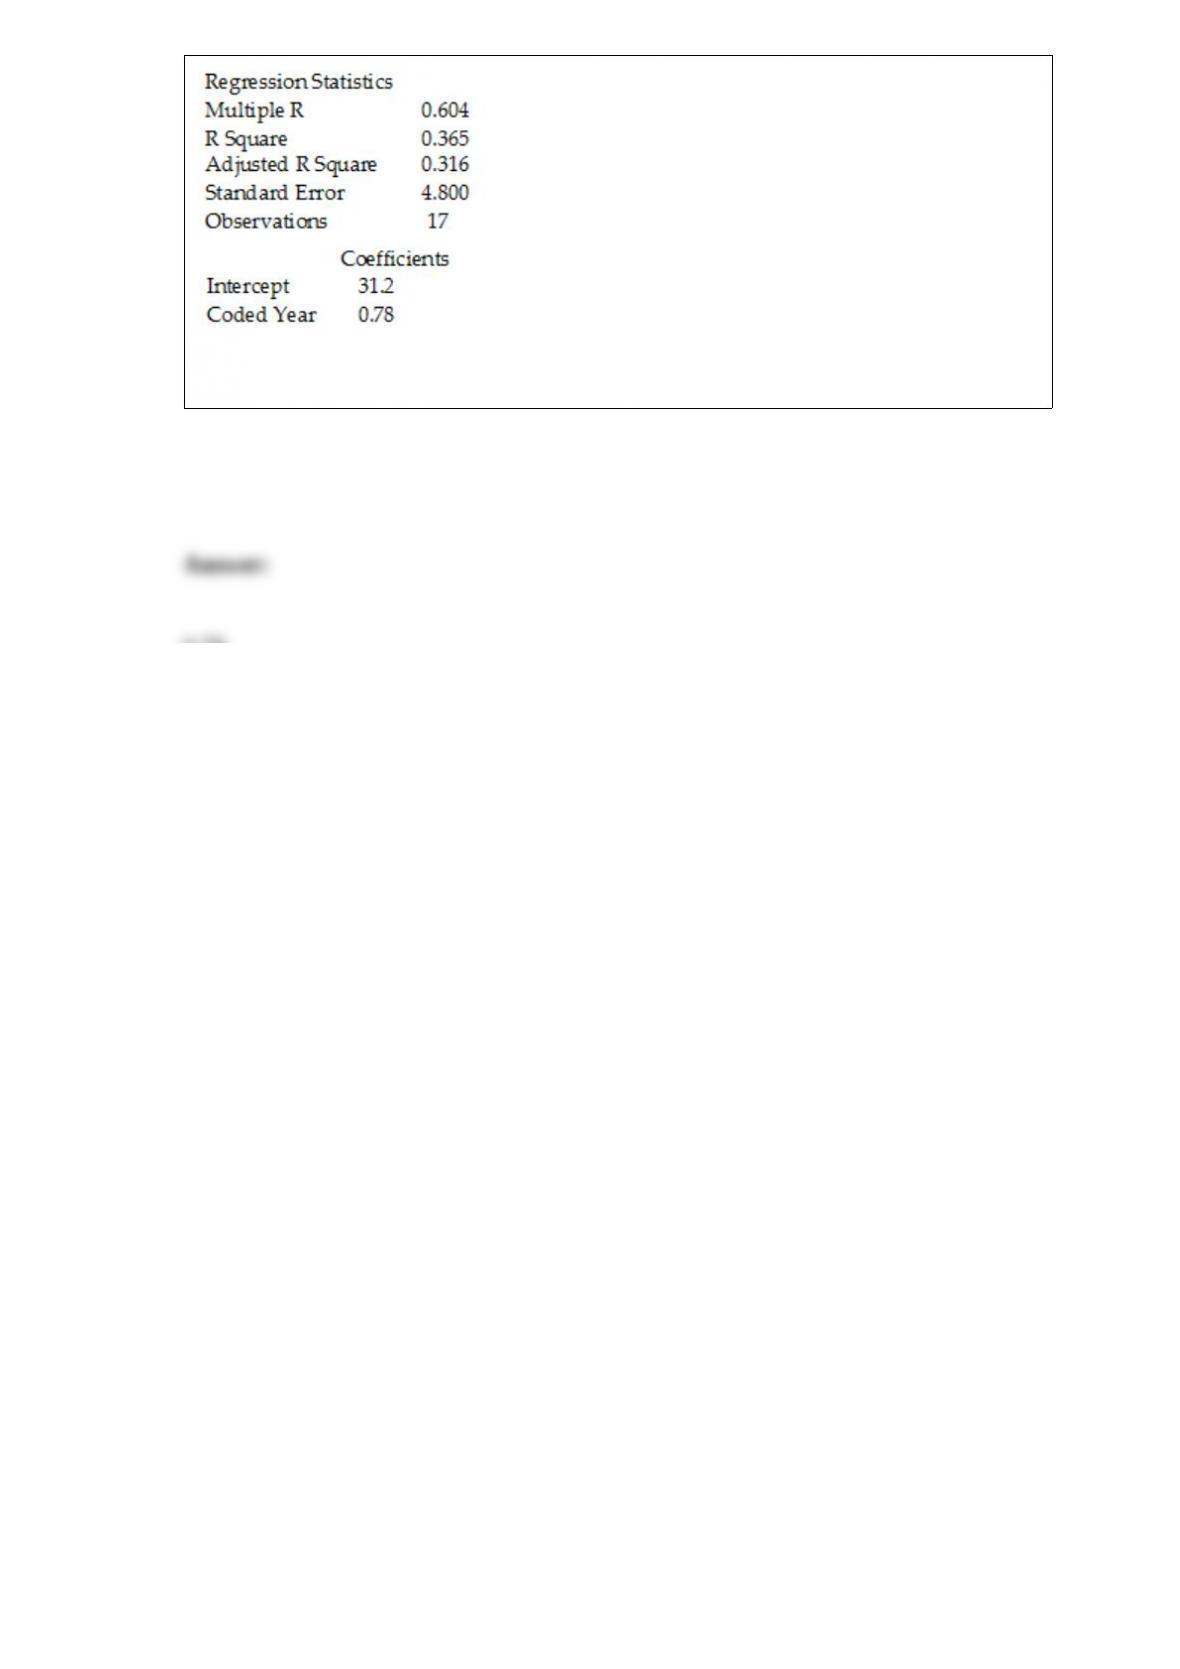
Referring to Table 16-6, the estimate of the amount by which sales (in millions of
dollars) is increasing each year is ________.