TABLE 5-5
From an inventory of 48 new cars being shipped to local dealerships, corporate reports
indicate that 12 have defective radios installed.
Referring to Table 5-5, what is the probability out of the 8 new cars it just received that,
when each is tested, at most three of the cars have non-defective radios?
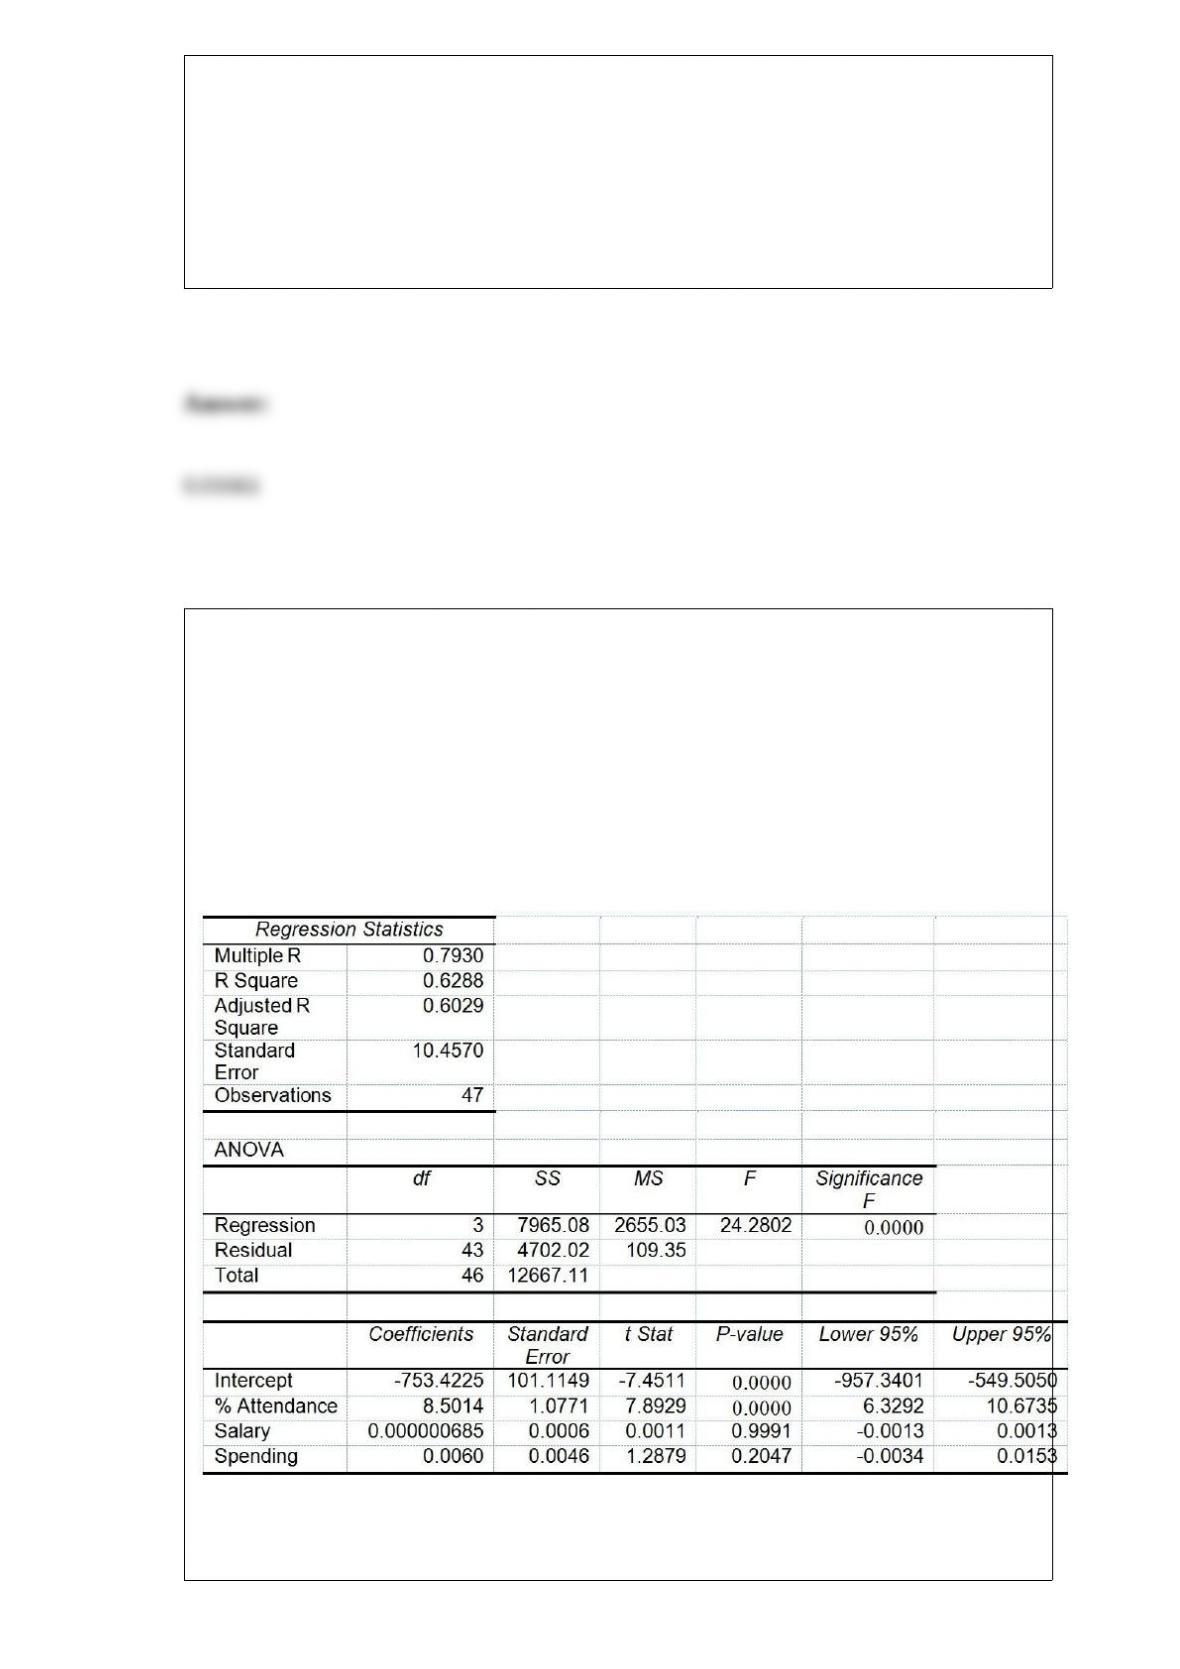
TABLE 17-8
The superintendent of a school district wanted to predict the percentage of students
passing a sixth-grade proficiency test. She obtained the data on percentage of students
passing the proficiency test (% Passing), daily mean of the percentage of students
attending class (% Attendance), mean teacher salary in dollars (Salaries), and
instructional spending per pupil in dollars (Spending) of 47 schools in the state.
Following is the multiple regression output with Y = % Passing as the dependent
variable, X1 = % Attendance, X2 = Salaries and X3 = Spending:
Referring to Table 17-8, what is the p-value of the test statistic when testing whether
instructional spending per pupil has any effect on the percentage of students passing the
proficiency test, taking into account the effect of all the other independent variables?
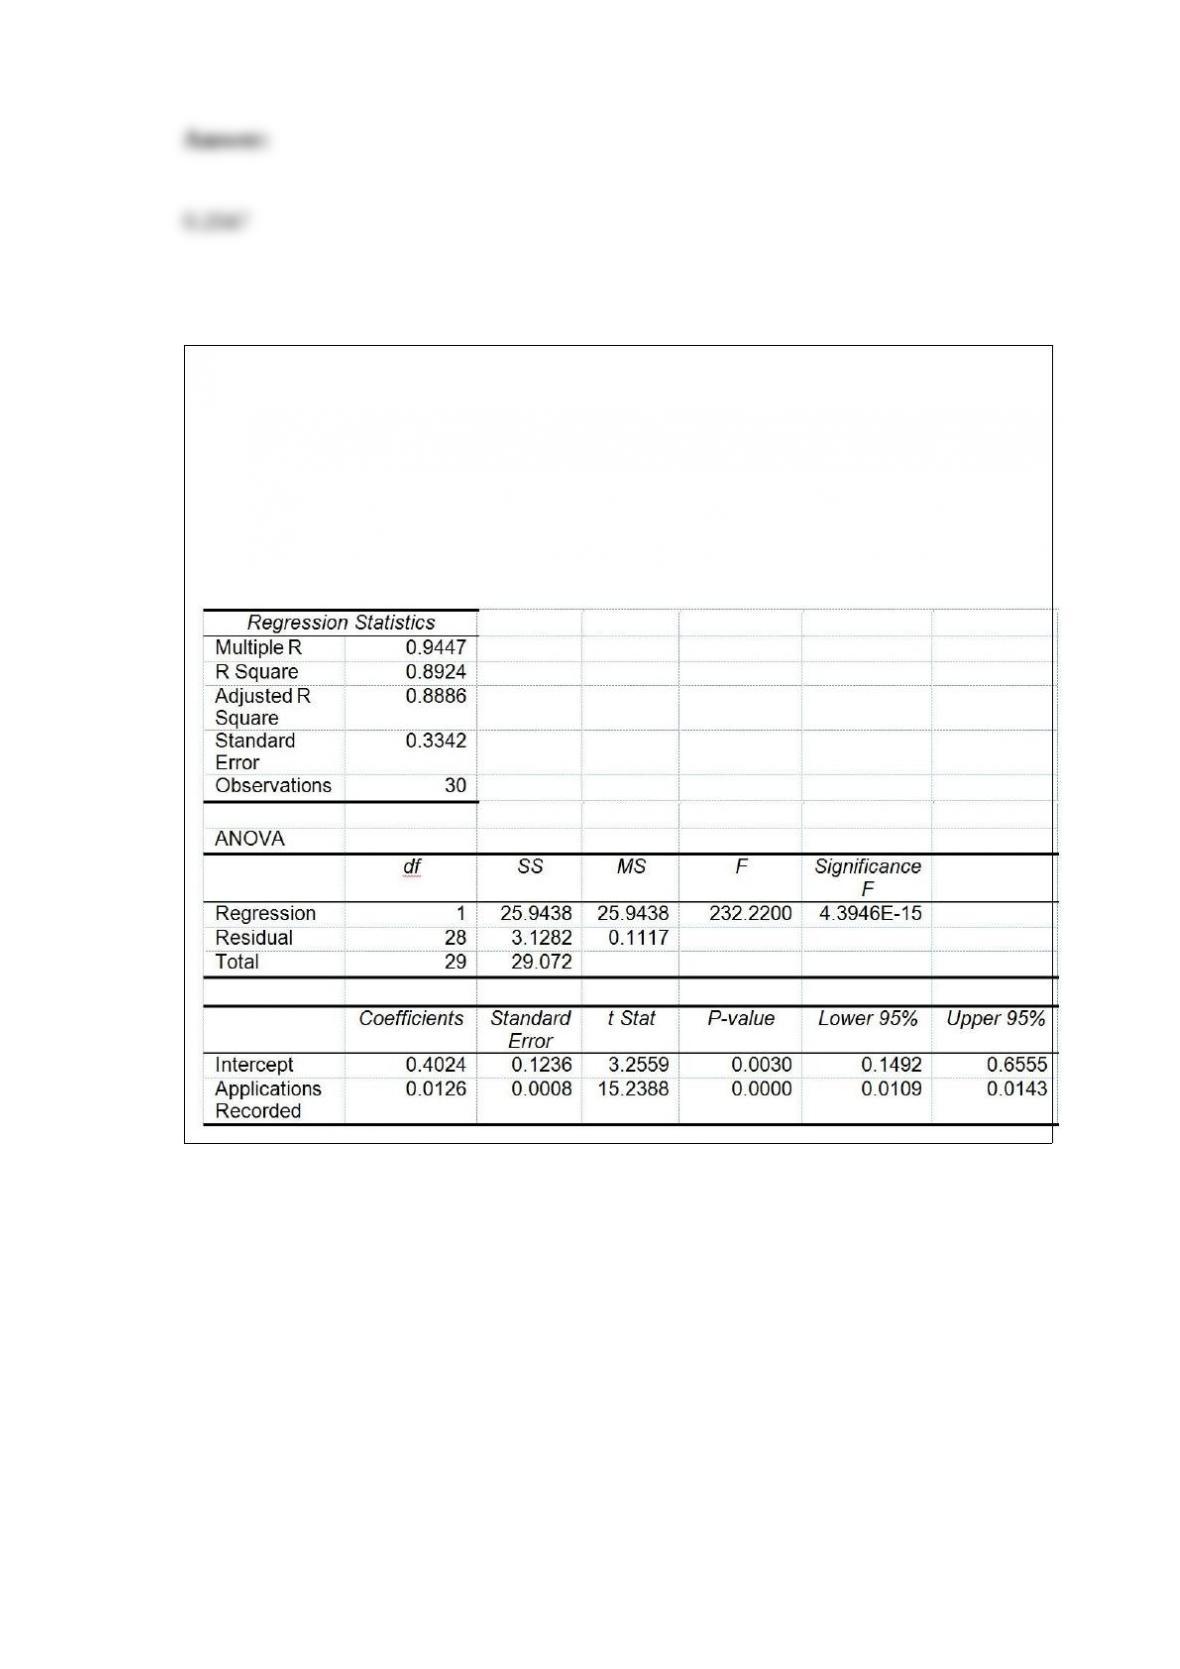
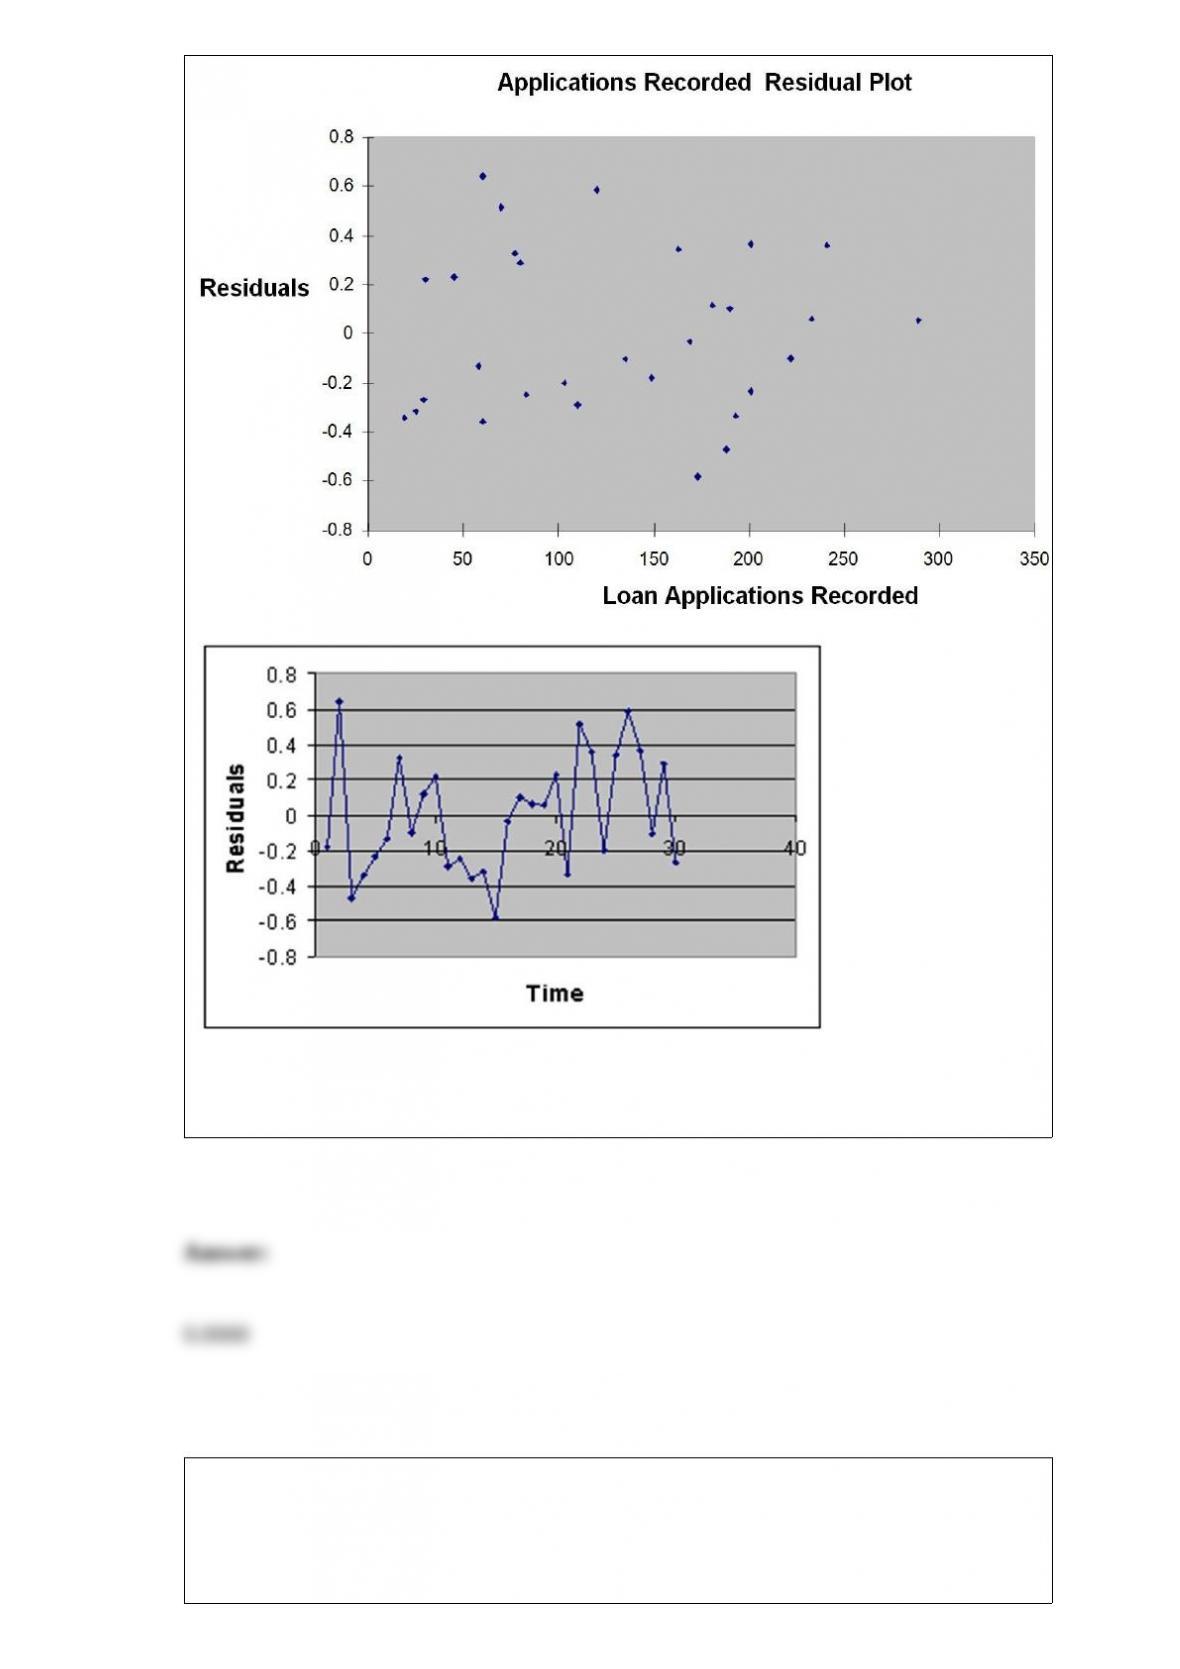
TABLE 13-12
The manager of the purchasing department of a large saving and loan organization
would like to develop a model to predict the amount of time (measured in hours) it
takes to record a loan application. Data are collected from a sample of 30 days, and the
number of applications recorded and completion time in hours is recorded. Below is the
regression output:
Referring to Table 13-12, the p-value of the measured F test statistic to test whether the
number of loan applications recorded affects the amount of time is ________.
Referring to Table 14-19, what is the estimated probability that a
home owner with a family income of $50,000 and a lawn size of 5,000
square feet will purchase a lawn service?
TABLE 14-19
The marketing manager for a nationally franchised lawn service
company would like to study the characteristics that differentiate
home owners who do and do not have a lawn service. A random
sample of 30 home owners located in a suburban area near a large
city was selected; 11 did not have a lawn service (code 0) and 19 had
a lawn service (code 1). Additional information available concerning
these 30 home owners includes family income (Income, in thousands
of dollars) and lawn size (Lawn Size, in thousands of square feet).
The PHStat output is given below:
Referring to Table 14-4, the partial F test for
H0 : Variable X2 does not significantly improve the model after variable X1 has been
included
H1 : Variable X2 significantly improves the model after variable X1 has been included
has ________ and ________ degrees of freedom.
TABLE 14-4
A real estate builder wishes to determine how house size (House) is influenced by
family income (Income) and family size (Size). House size is measured in hundreds of
square feet and income is measured in thousands of dollars. The builder randomly
selected 50 families and ran the multiple regression. Partial Microsoft Excel output is
provided below:
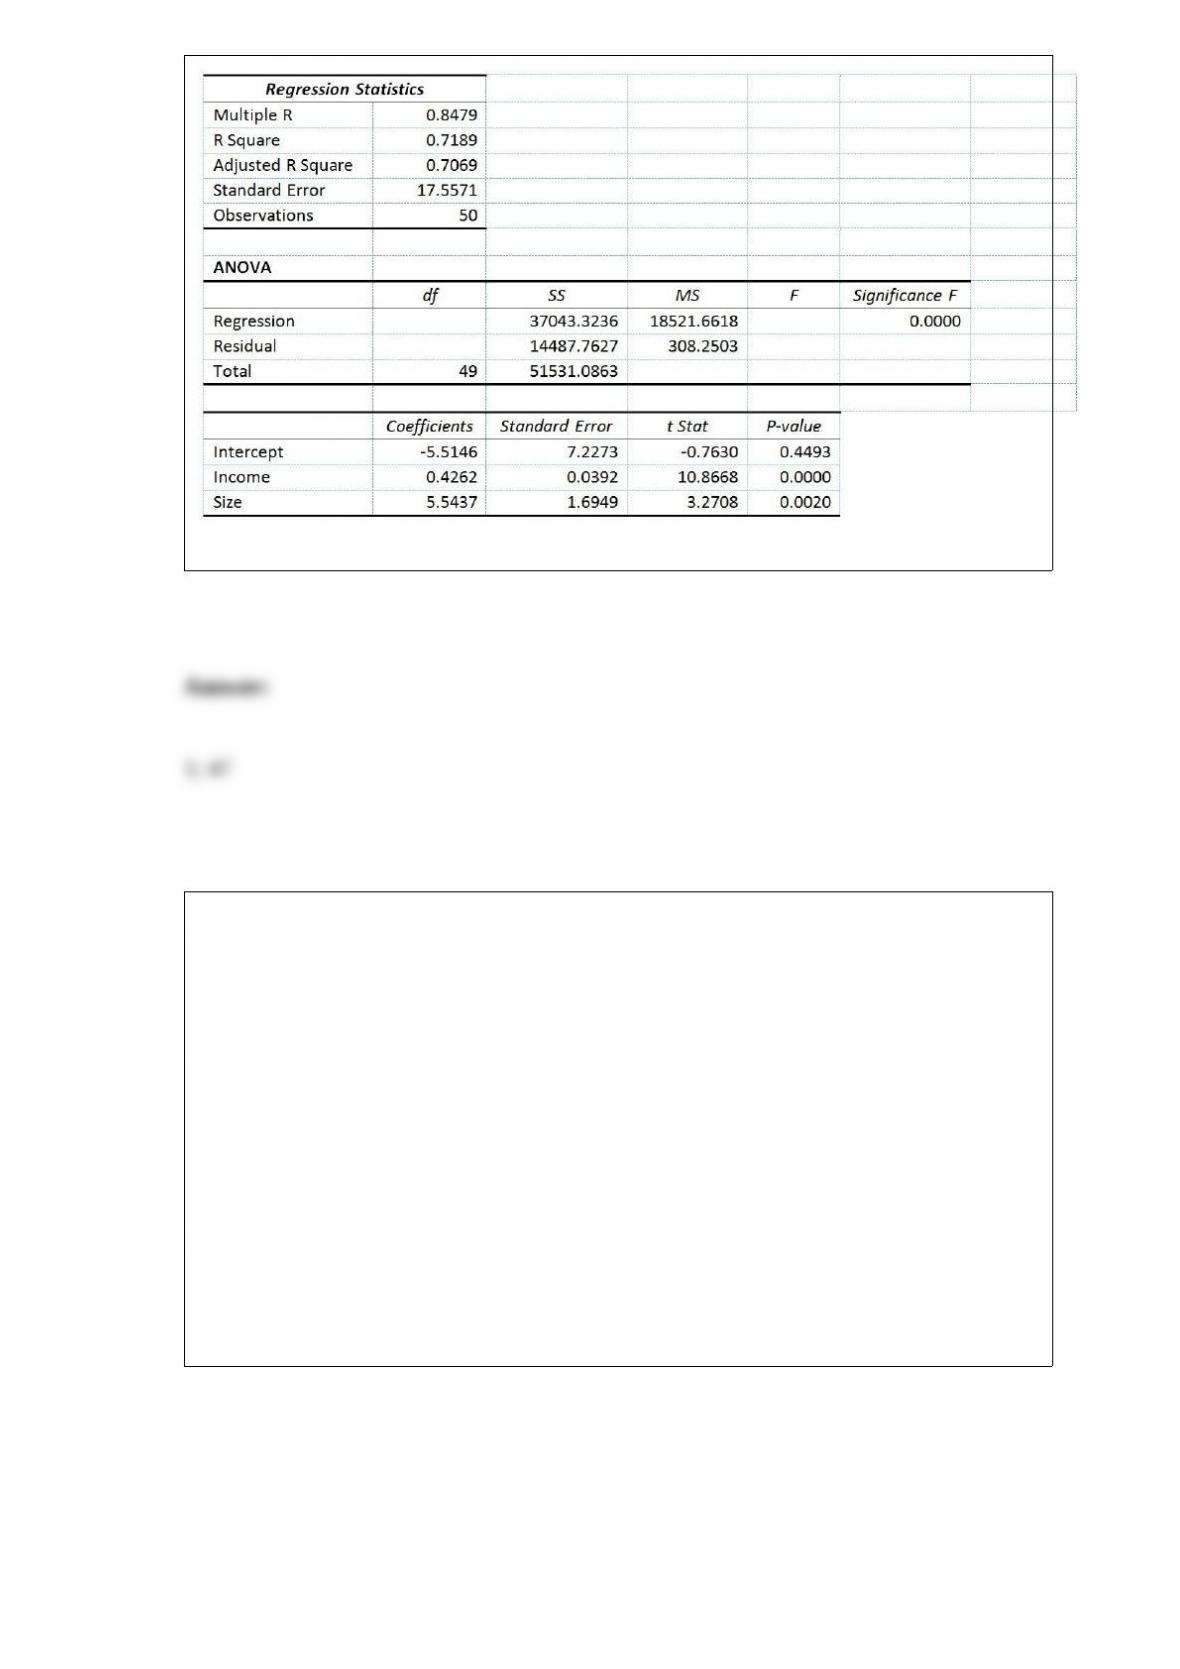
Also SSR (X1∣ X2) = 36400.6326 and SSR (X2∣ X1) = 3297.7917
Referring to Table 14-18, what are the degrees of freedom for the
chi-square distribution when testing whether the model is a
good-7tting model?
TABLE 14-18
A logistic regression model was estimated in order to predict the
probability that a randomly chosen university or college would be a
private university using information on mean total Scholastic Aptitude
Test score (SAT) at the university or college and whether the TOEFL
criterion is at least 90 (Toe90 = 1 if yes, 0 otherwise). The
dependent variable, Y, is school type (Type = 1 if private and 0
otherwise).
The PHStat output is given below:
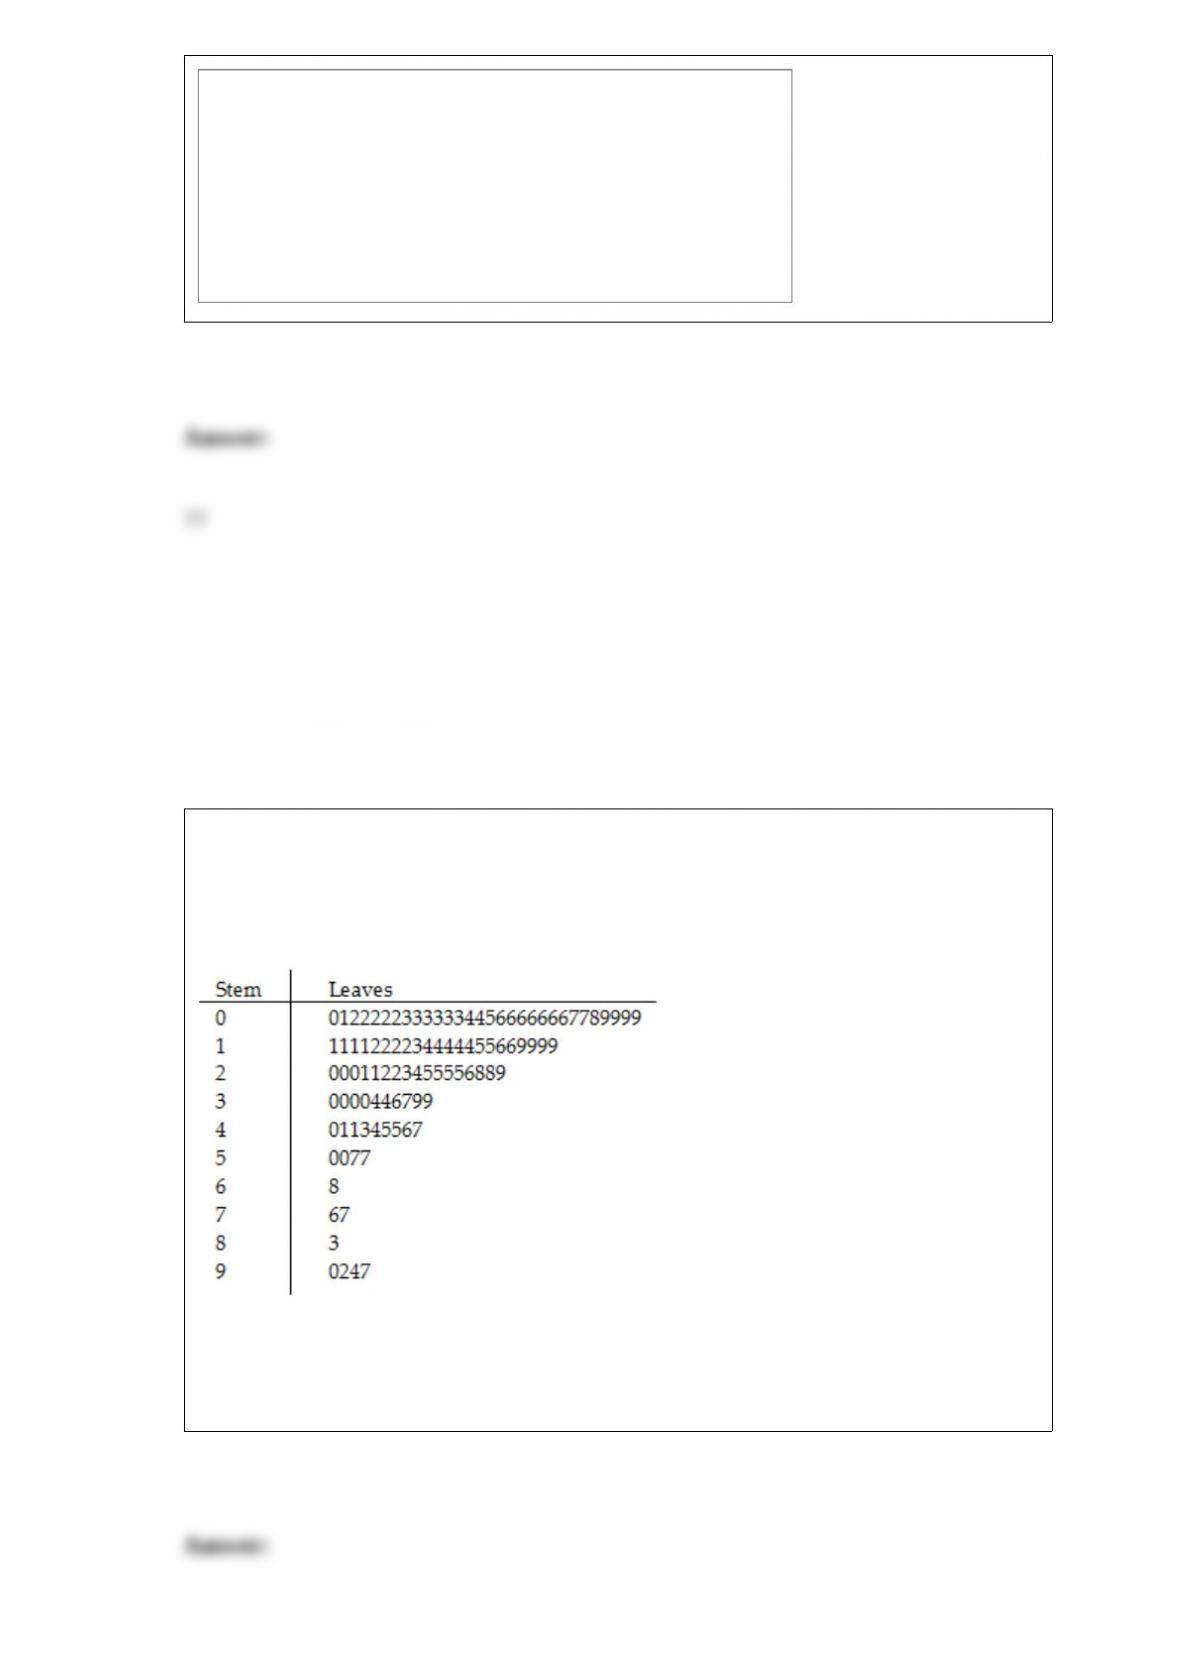
TABLE 2-8
The Stem-and-Leaf display represents the number of times in a year that a random
sample of 100 “lifetime” members of a health club actually visited the facility.
Referring to Table 2-8, if a frequency distribution with equal sized classes was made
from this data, and the first class was “0 but less than 10,” the frequency of the fifth
class would be ________.