TABLE 3-2
The data below represent the amount of grams of carbohydrates in a serving of
breakfast cereal in a sample of 11 different servings.
Referring to Table 3-2, the variance of the carbohydrate amounts is ________ (grams
squared).
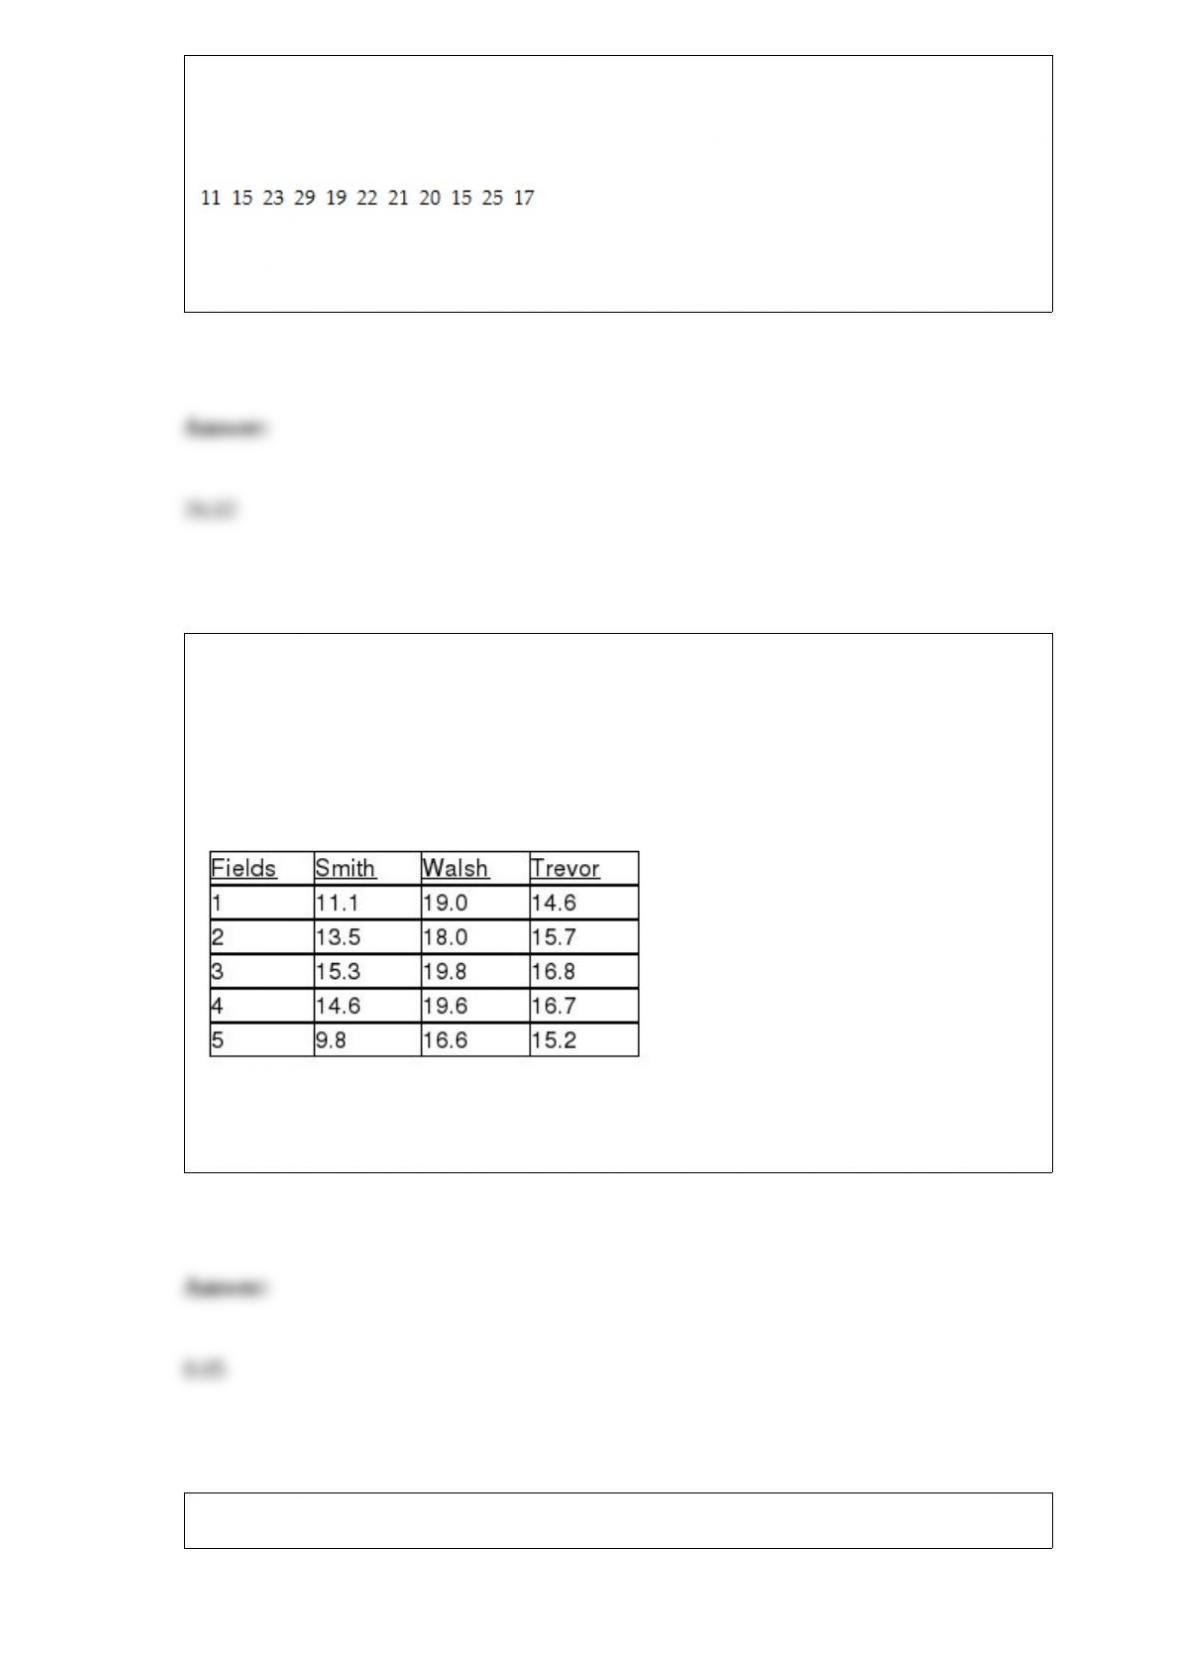
TABLE 11-10
An agronomist wants to compare the crop yield of 3 varieties of chickpea seeds. She
plants all 3 varieties of the seeds on each of 5 different patches of fields. She then
measures the crop yield in bushels per acre. Treating this as a randomized block design,
the results are presented in the table that follows.
Referring to Table 11-10, what is the critical value of the randomized block F test for
the difference in the means at a level of significance of 0.01?
Referring to Table 14-7, the value of the coefficient of multiple

determination, , is ________.
TABLE 14-7
The department head of the accounting department wanted to see if
she could predict the GPA of students using the number of course
units (credits) and total SAT scores of each. She takes a sample of
students and generates the following Microsoft Excel output:
TABLE 8-2
A quality control engineer is interested in the mean length of sheet insulation being cut
automatically by machine. The desired mean length of the insulation is 12 feet. It is
known that the standard deviation in the cutting length is 0.15 feet. A sample of 70 cut
sheets yields a mean length of 12.14 feet. This sample will be used to obtain a 99%

confidence interval for the mean length cut by machine.
Referring to Table 8-2, the confidence interval goes from ________ to ________.
TABLE 9-7
A major home improvement store conducted its biggest brand recognition campaign in
the company’s history. A series of new television advertisements featuring well-known
entertainers and sports figures were launched. A key metric for the success of television
advertisements is the proportion of viewers who “like the ads a lot”. A study of 1,189
adults who viewed the ads reported that 230 indicated that they “like the ads a lot.” The
percentage of a typical television advertisement receiving the “like the ads a lot” score
is believed to be 22%. Company officials wanted to know if there is evidence that the
series of television advertisements are less successful than the typical ad (i.e. if there is
evidence that the population proportion of “like the ads a lot” for the company’s ads is
less than 0.22) at a 0.01 level of significance.
Referring to Table 9-7, state the alternative hypothesis for this study.
TABLE 3-6
The rate of return of an Internet Service Provider over a 10-year period are: 10.25%,
12.64%, 8.37%, 9.29%, 6.23%, 42.53%, 29.23%, 15.25%, 21.52%, -2.35%.
Referring to Table 3-6, compute the geometric mean rate of return per year for the first
three years.

TABLE 3-3
The ordered array below represents the number of vitamin supplements sold by a health
food store in a sample of 16 days.
19, 19, 20, 20, 22, 23, 25, 26, 27, 30, 33, 34, 35, 36, 38, 41
Note: For this sample, the sum of the values is 448, and the sum of the squared
differences between each value and the mean is 812.
Referring to Table 3-3, what type of shape does the distribution of the sample appear to
have?
TABLE 13-11
A computer software developer would like to use the number of downloads (in
thousands) for the trial version of his new shareware to predict the amount of revenue
(in thousands of dollars) he can make on the full version of the new shareware.
Following is the output from a simple linear regression along with the residual plot and
normal probability plot obtained from a data set of 30 different sharewares that he has
developed:
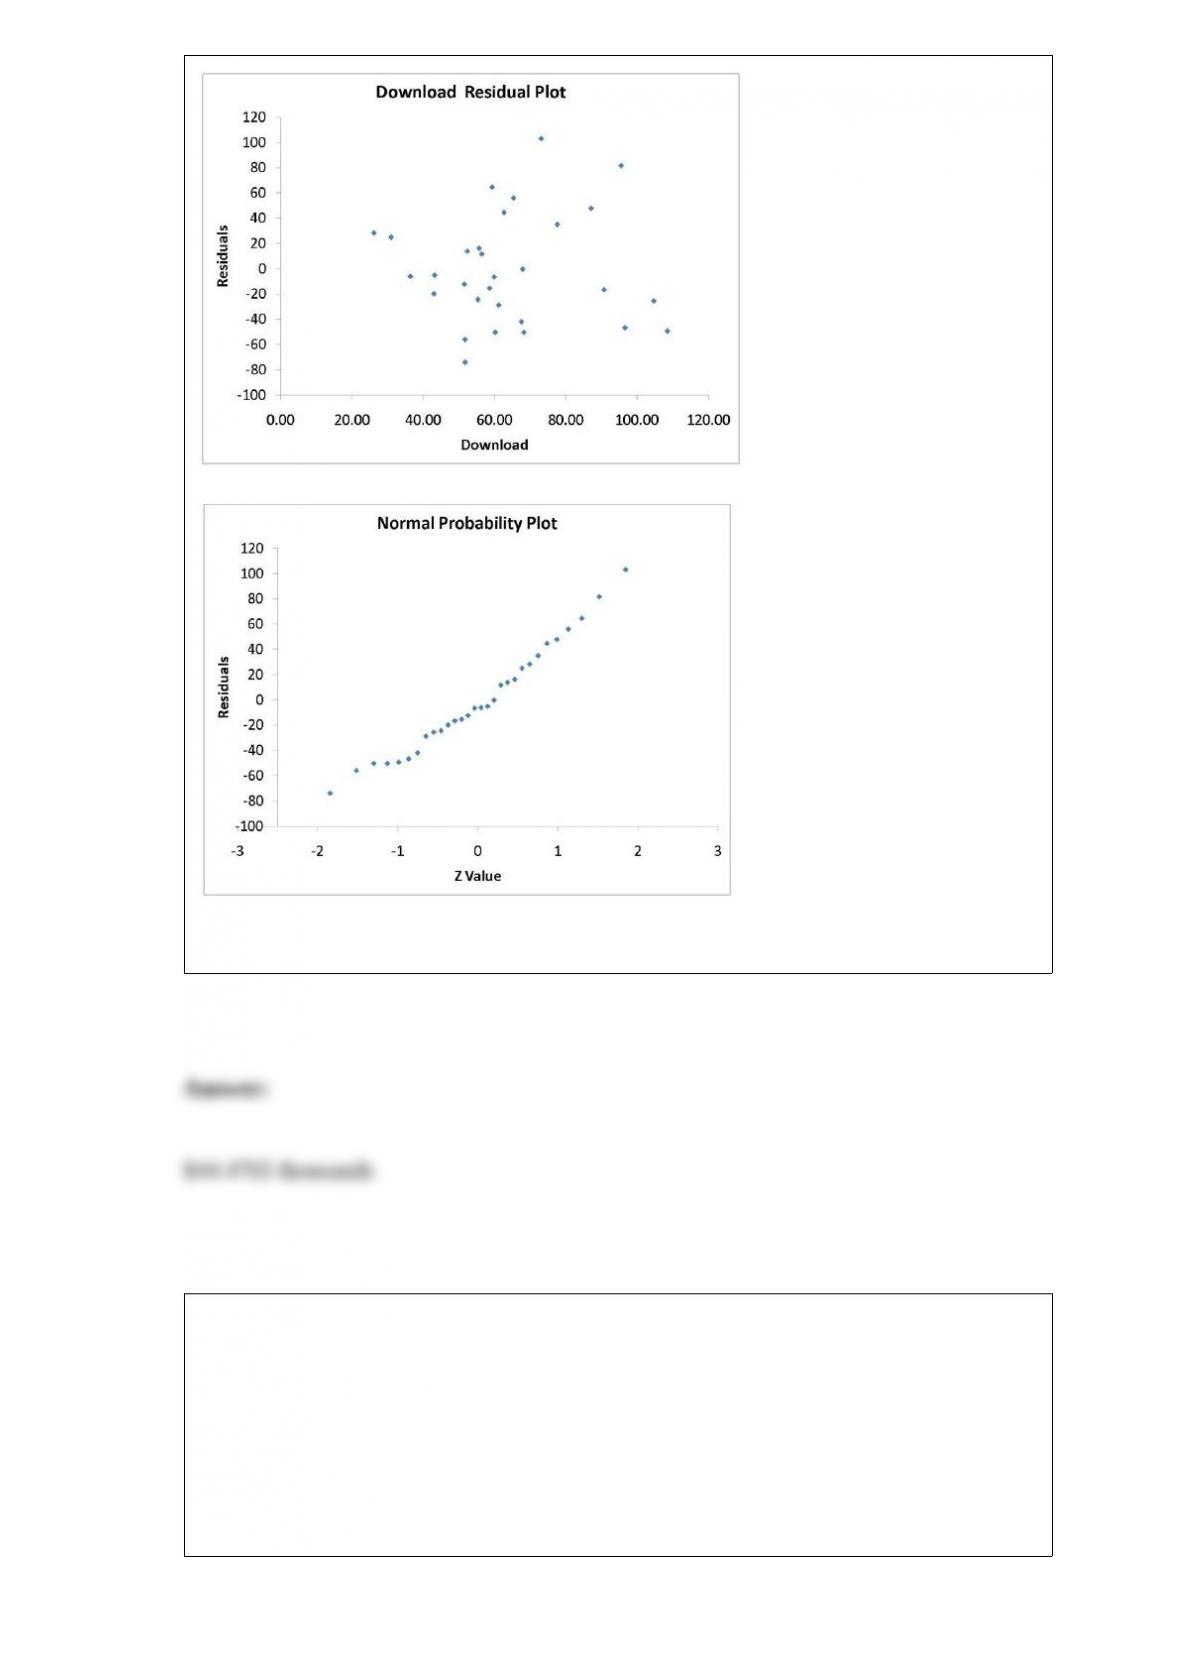
Referring to Table 13-11, what is the standard error of estimate?
TABLE 13-11
A computer software developer would like to use the number of downloads (in
thousands) for the trial version of his new shareware to predict the amount of revenue
(in thousands of dollars) he can make on the full version of the new shareware.
Following is the output from a simple linear regression along with the residual plot and
normal probability plot obtained from a data set of 30 different sharewares that he has
developed:
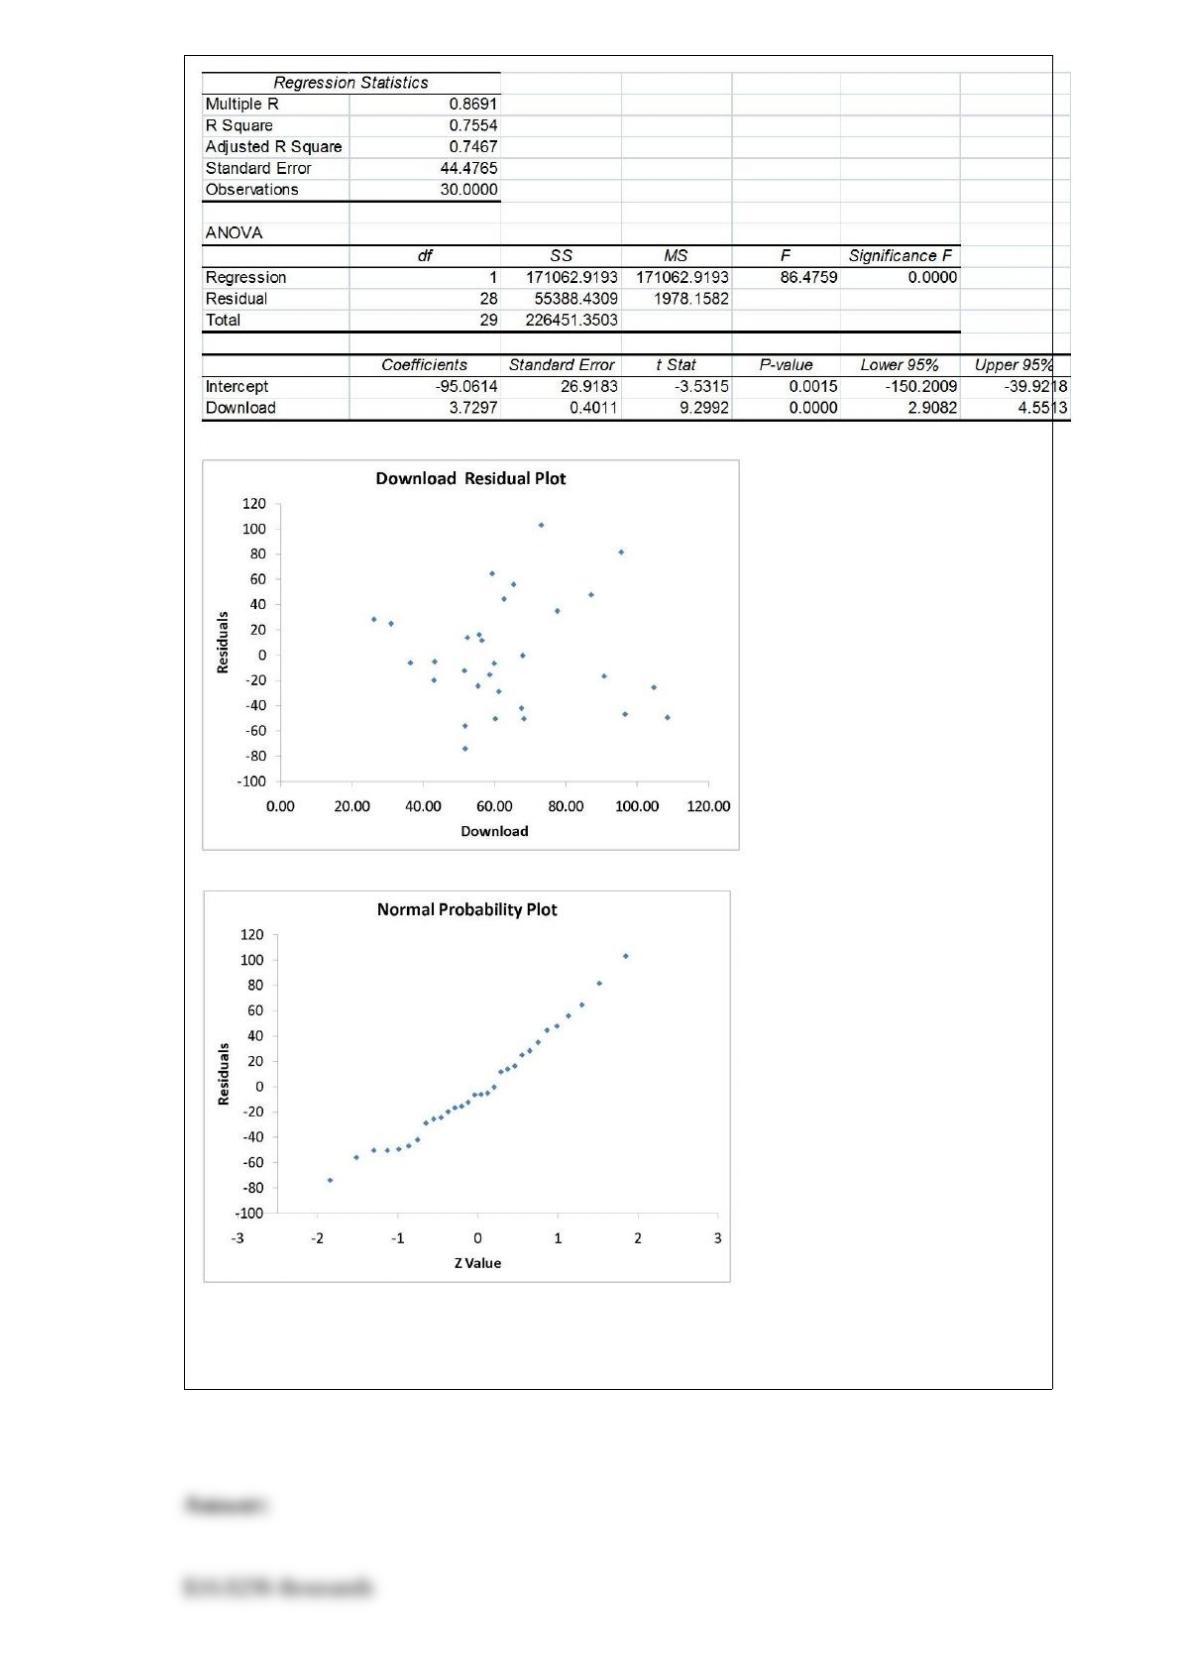
Referring to Table 13-11, predict the revenue when the number of downloads is 30
thousands.