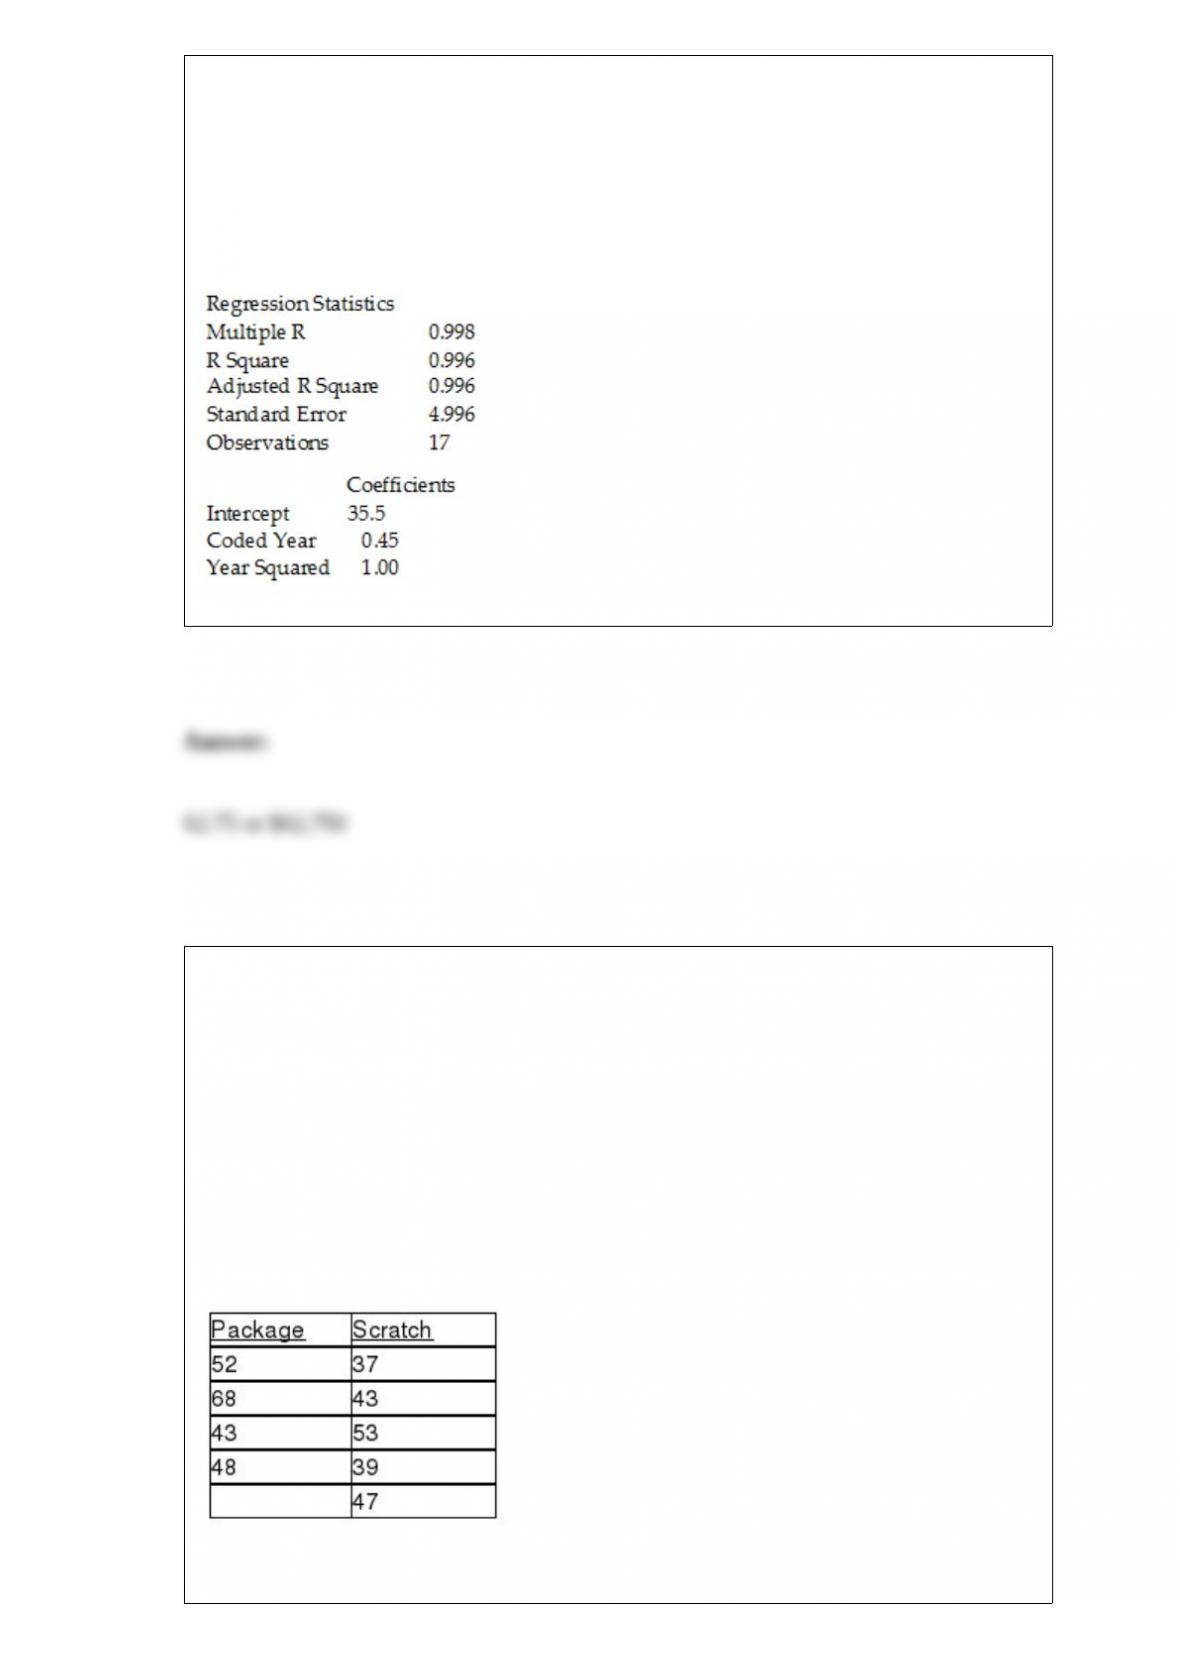
TABLE 16-8
The manager of a marketing consulting firm has been examining his company’s yearly
profits. He believes that these profits have been showing a quadratic trend since 1994.
He uses Microsoft Excel to obtain the partial output below. The dependent variable is
profit (in thousands of dollars), while the independent variables are coded years and
squared of coded years, where 1994 is coded as 0, 1995 is coded as 1, etc.
SUMMARY OUTPUT
Referring to Table 16-8, the fitted value for 1999 is ________.
TABLE 12-14
A perfume manufacturer is trying to choose between 2 magazine advertising layouts.
An expensive layout would include a small package of the perfume. A cheaper layout
would include a ‘scratch-and-sniff” sample of the product. The manufacturer would use
the more expensive layout only if there is evidence that it would lead to a higher
approval rate. The manufacturer presents the more expensive layout to 4 groups and
determines the approval rating for each group. He presents the ‘scratch-and-sniff” layout
to 5 groups and again determines the approval rating of the perfume for each group. The
data are given below. Use this to test the appropriate hypotheses with the Wilcoxon
Rank Sum Test with a level of significance of 0.05.
Referring to Table 12-14, the rank given to the second observation in the
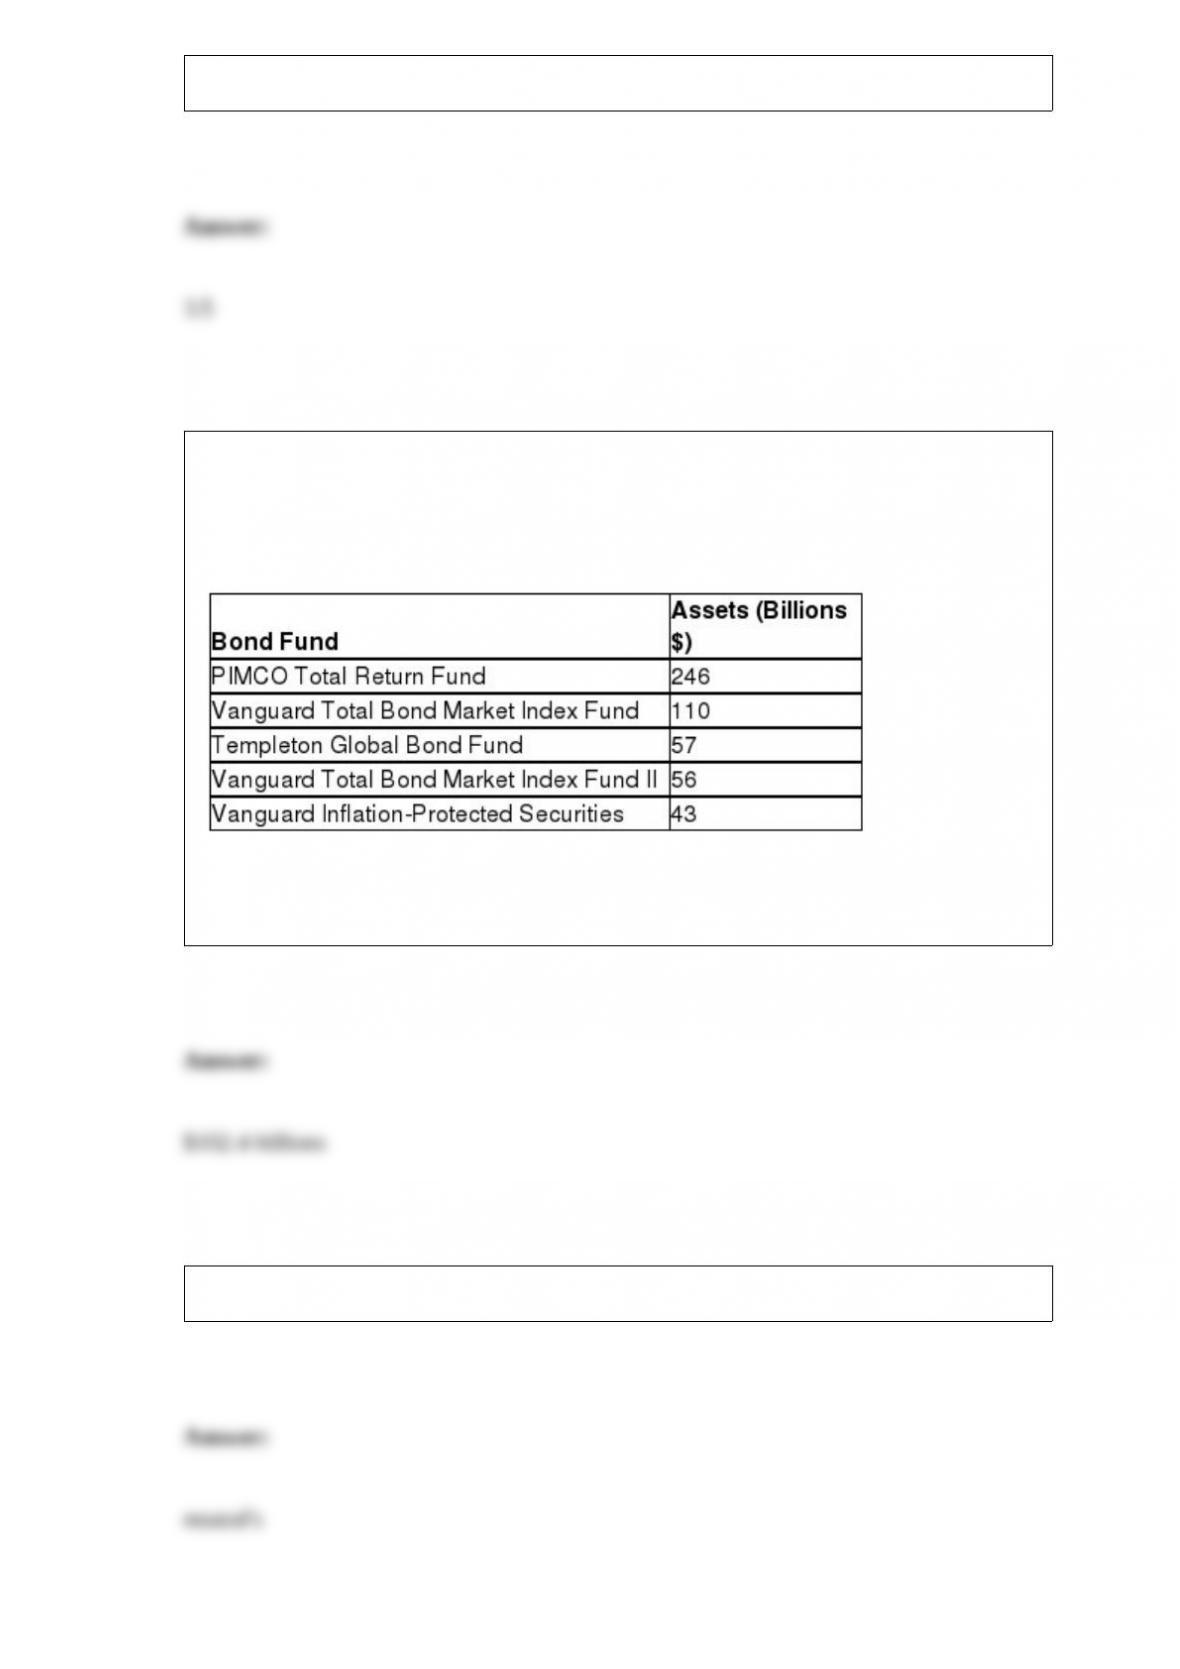
‘scratch-and-sniff” group is ________.
TABLE 3-9
The following table represents the assets in billions of dollars of the five largest bond
funds.
Referring to Table 3-9, what is the mean for this population of the five largest bond
funds?
The risk-________ curve represents the expected monetary value approach.
Referring to Table 14-4, what annual income (in thousands of dollars) would an
individual with a family size of 9 need to attain a predicted 5,000 square foot home
(House = 50)?
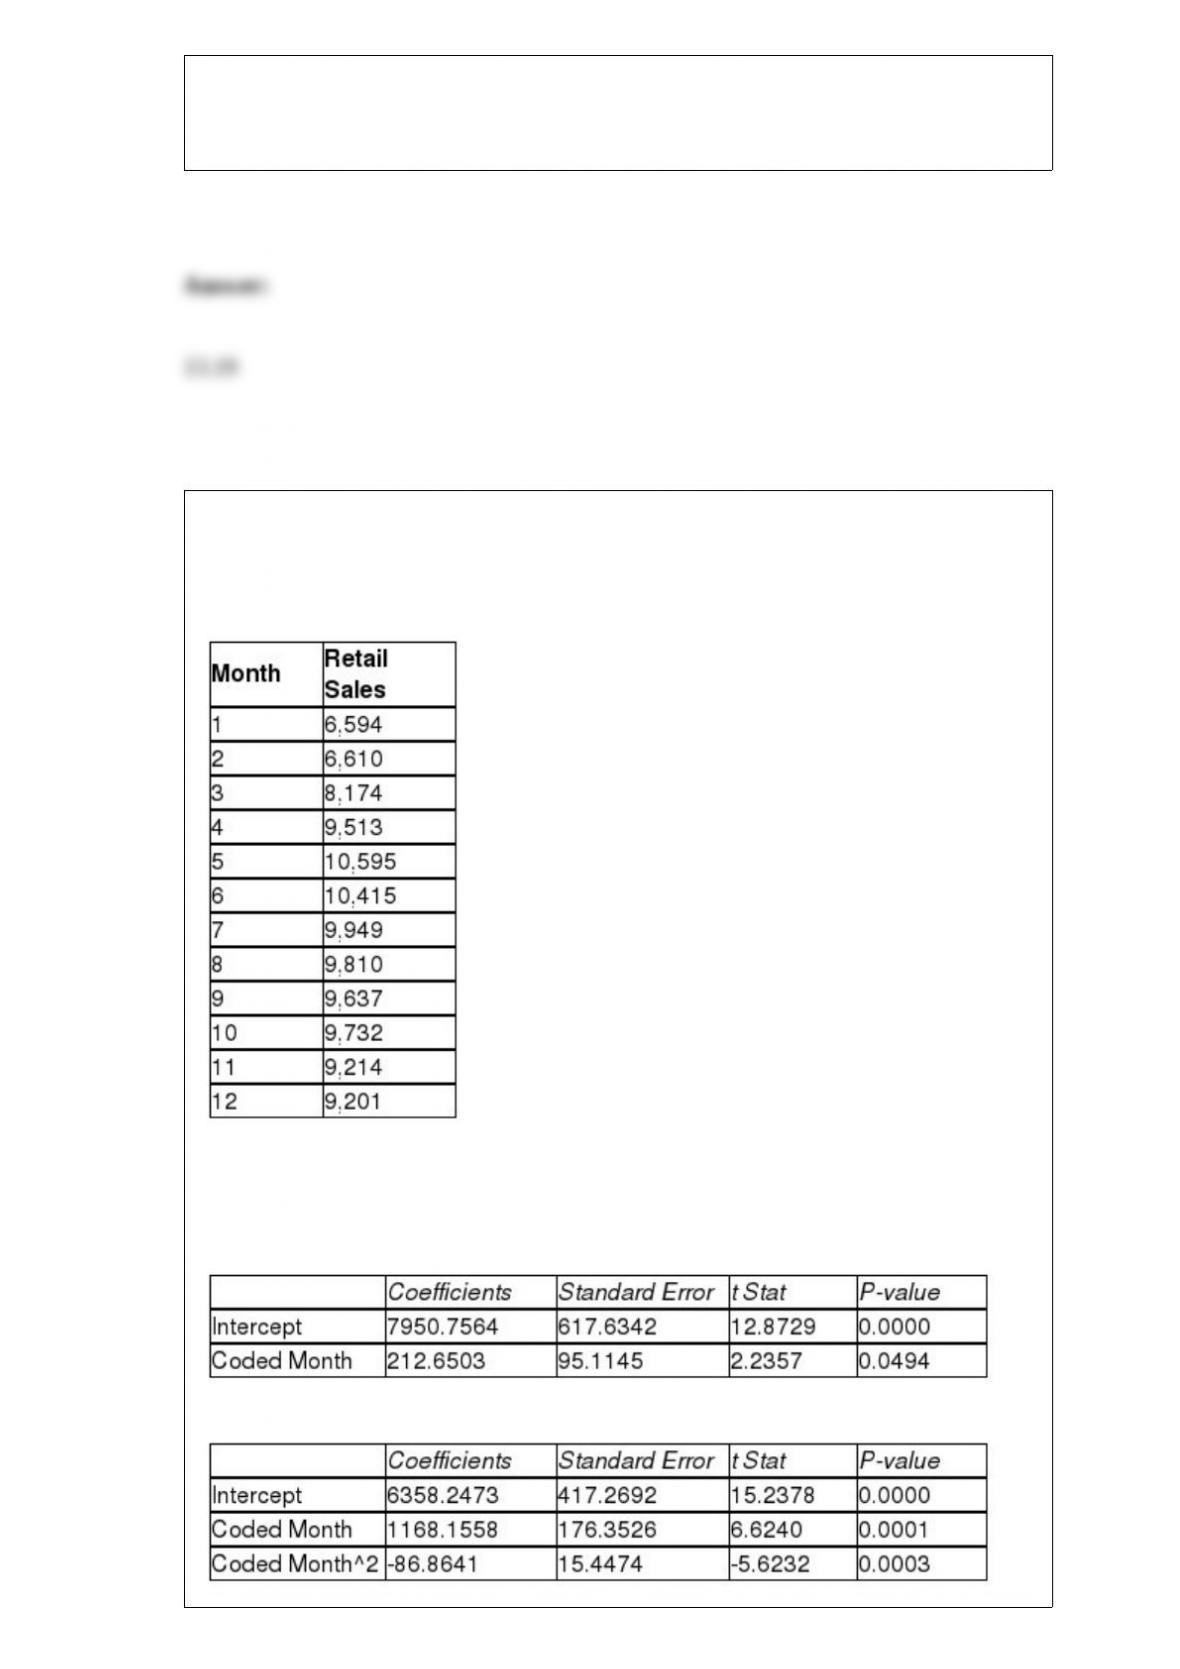
TABLE 16-13
Given below is the monthly time-series data for U.S. retail sales of building materials
over a specific year.
The results of the linear trend, quadratic trend, exponential trend, first-order
autoregressive, second-order autoregressive and third-order autoregressive model are
presented below in which the coded month for the 1st month is 0:
Linear trend model:
Quadratic trend model:
Exponential trend model:
First-order autoregressive:
Second-order autoregressive:
Third-order autoregressive:
Below is the residual plot of the various models:
Referring to Table 16-13, what is the exponentially smoothed forecast for the 13th
month using a smoothing coefficient of W = 0.25 if the exponentially smooth value for
the 10th and 11th month are 9,477.7776 and 9,411.8332, respectively?
Assume that house prices in a neighborhood are normally distributed with a standard
deviation of $20,000. A random sample of 16 observations is taken. What is the
probability that the sample mean differs from the population mean by more than
$5,000?