At a computer manufacturing company, the actual size of computer chips is normally
distributed with a mean of 1 centimeter and a standard deviation of 0.1 centimeter. A
random sample of 12 computer chips is taken. Above what value do 2.5% of the sample
means fall?
TABLE 2-7
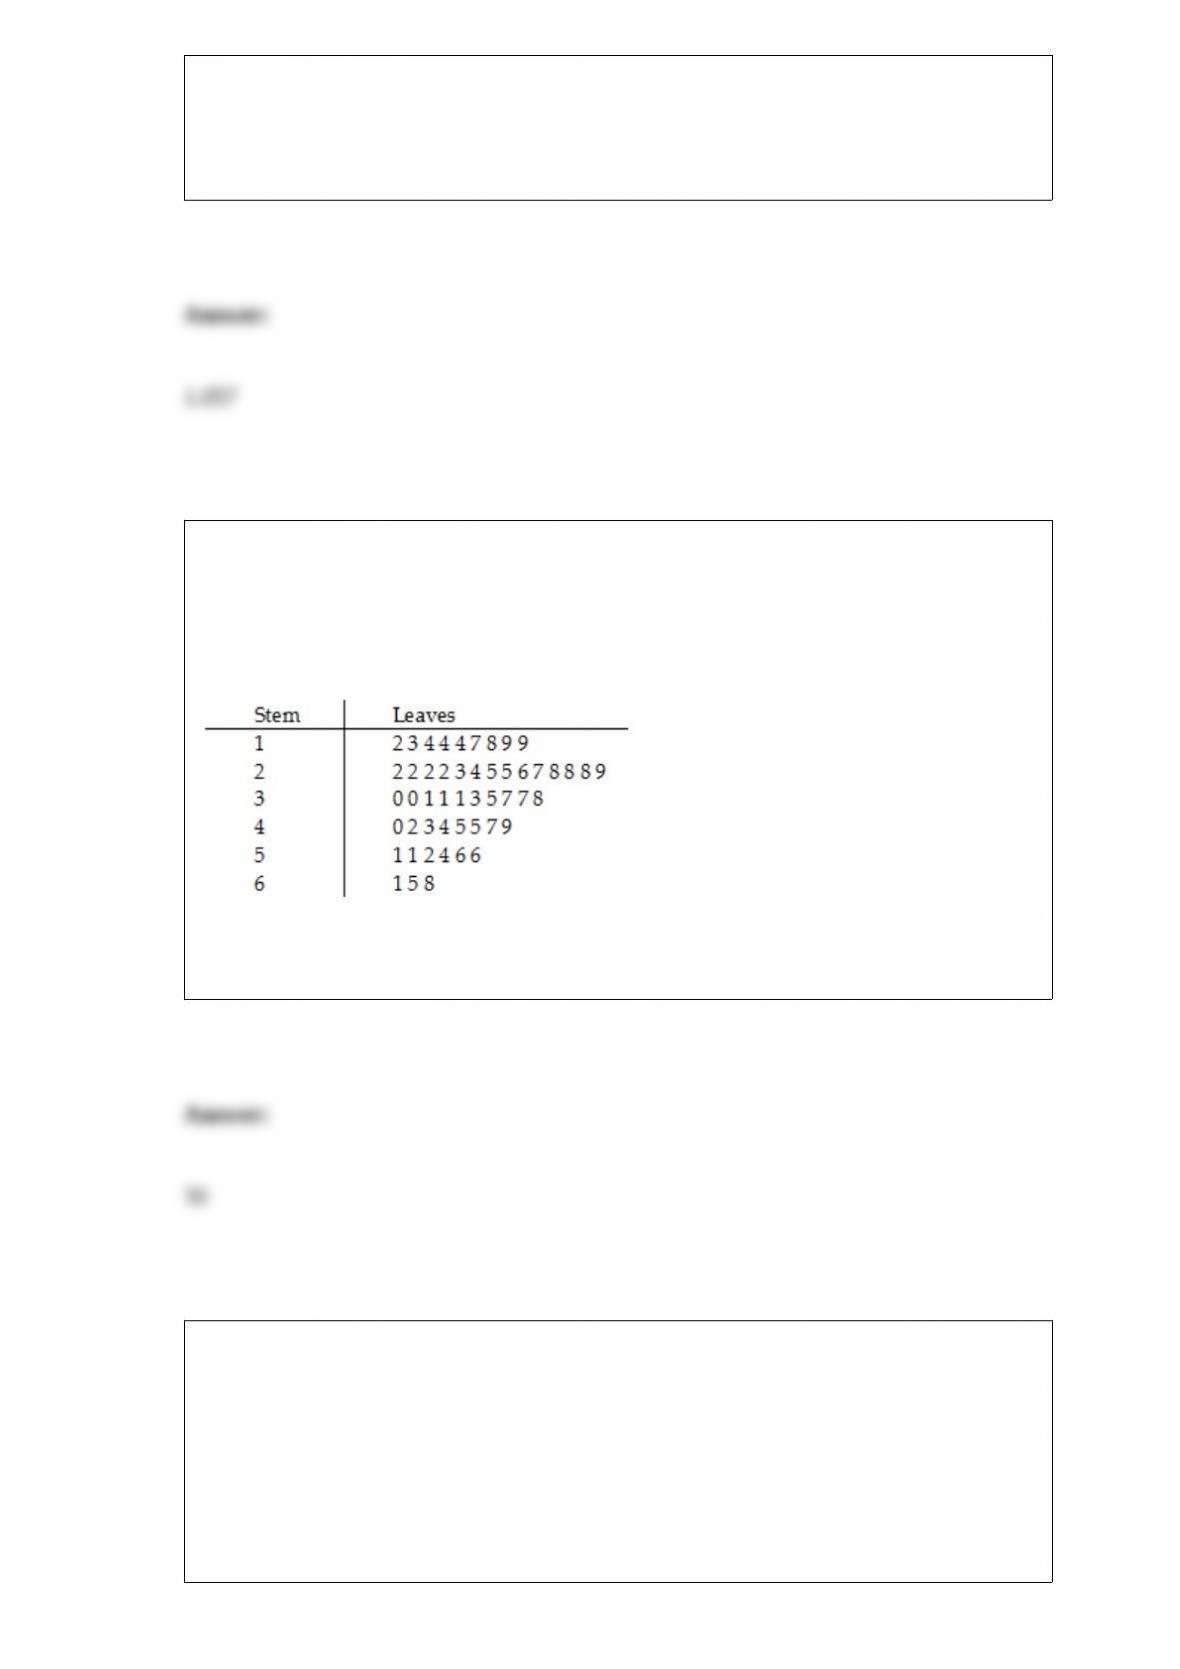
The Stem-and-Leaf display below contains data on the number of months between the
date a civil suit is filed and when the case is actually adjudicated for 50 cases heard in
superior court.
Referring to Table 2-7, ________ percent of the cases were adjudicated within the first
2 years.
TABLE 7-7
Times spent studying by students in the week before final exams follow a normal
distribution with standard deviation 8 hours. A random sample of 4 students was taken
from a population of 50 in order to estimate the mean study time for the population of
all students. Use the finite population correction.
Referring to Table 7-7, what is the probability that the sample mean is more than 3
hours below the population mean?
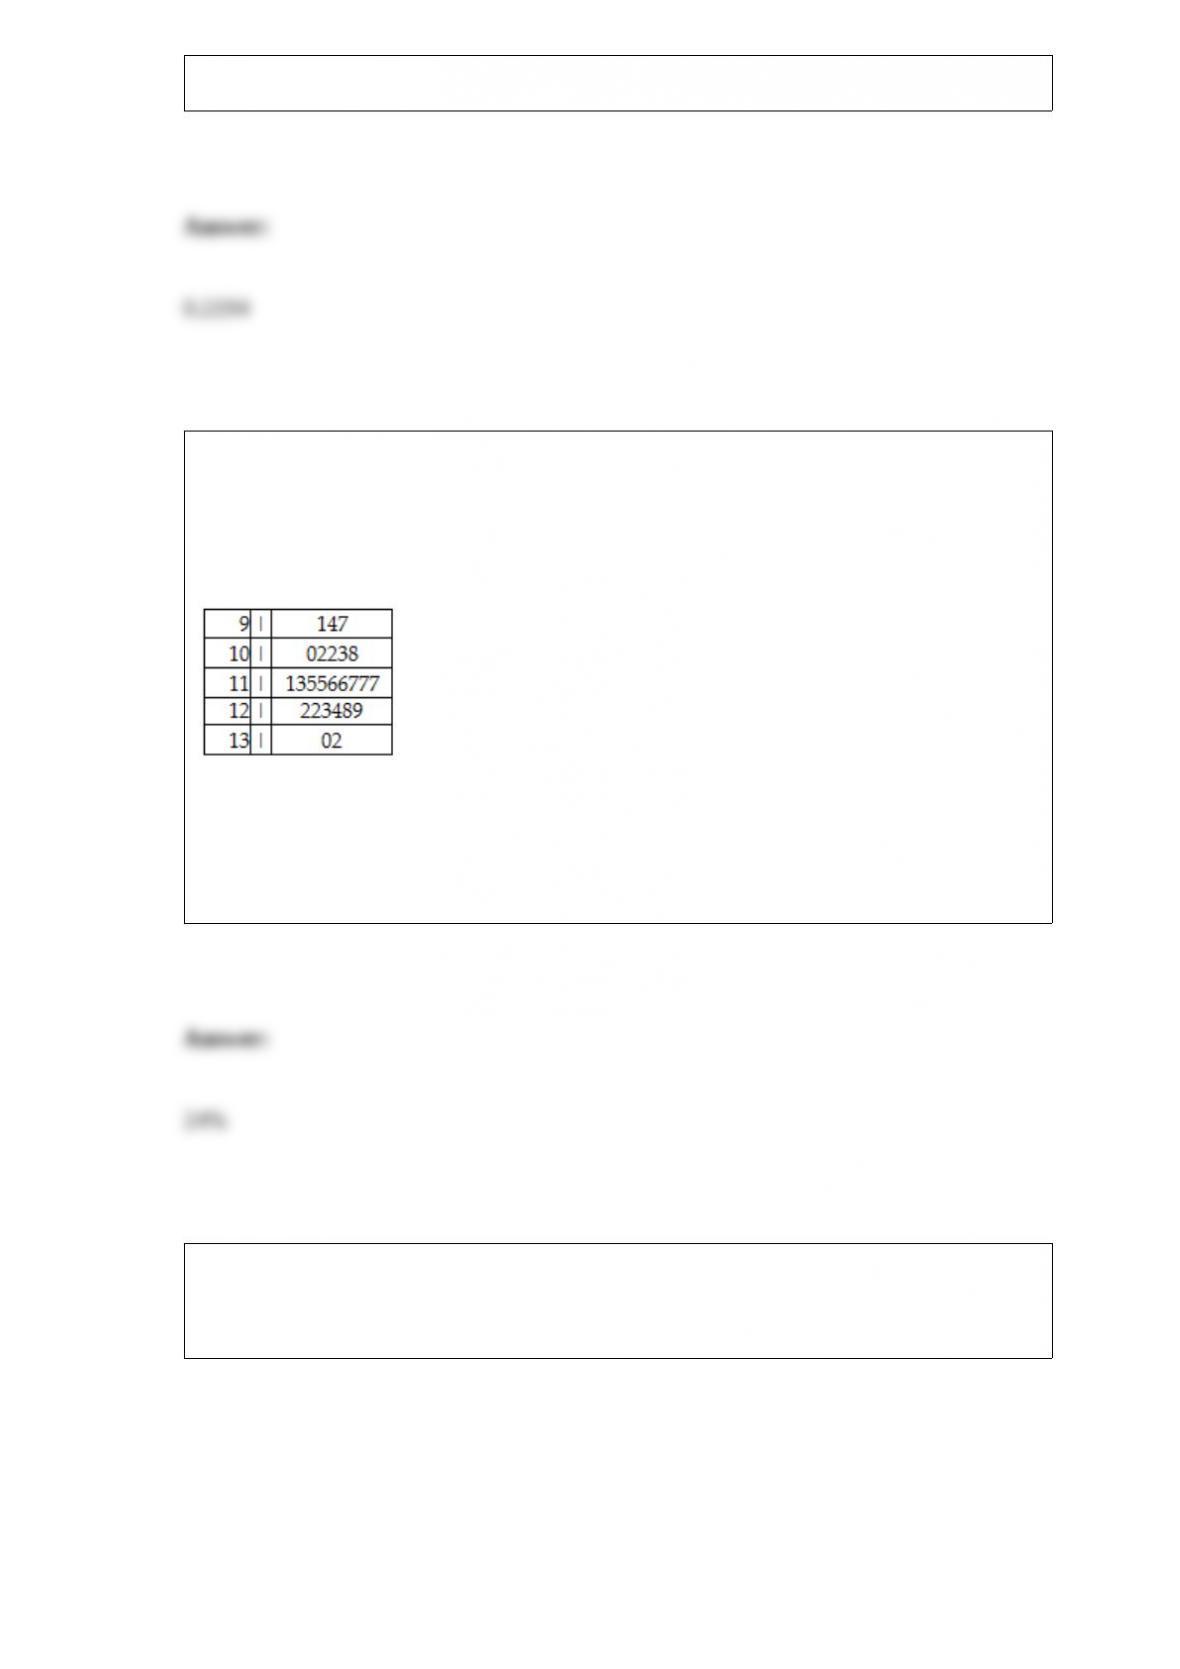
TABLE 2-13
Given below is the stem-and-leaf display representing the amount of detergent used in
gallons (with leaves in 10ths of gallons) in a day by 25 drive-through car wash
operations in Phoenix.
Referring to Table 2-13, if a percentage histogram for the detergent data is constructed,
using “9.0 but less than 10.0 gallons” as the first class, the percentage of drive-through
car wash operations that use “12.0 but less than 13.0 gallons” of detergent would be
________.
TABLE 16-1
The number of cases of chardonnay wine sold by a Paso Robles winery in an 8-year
period follows.
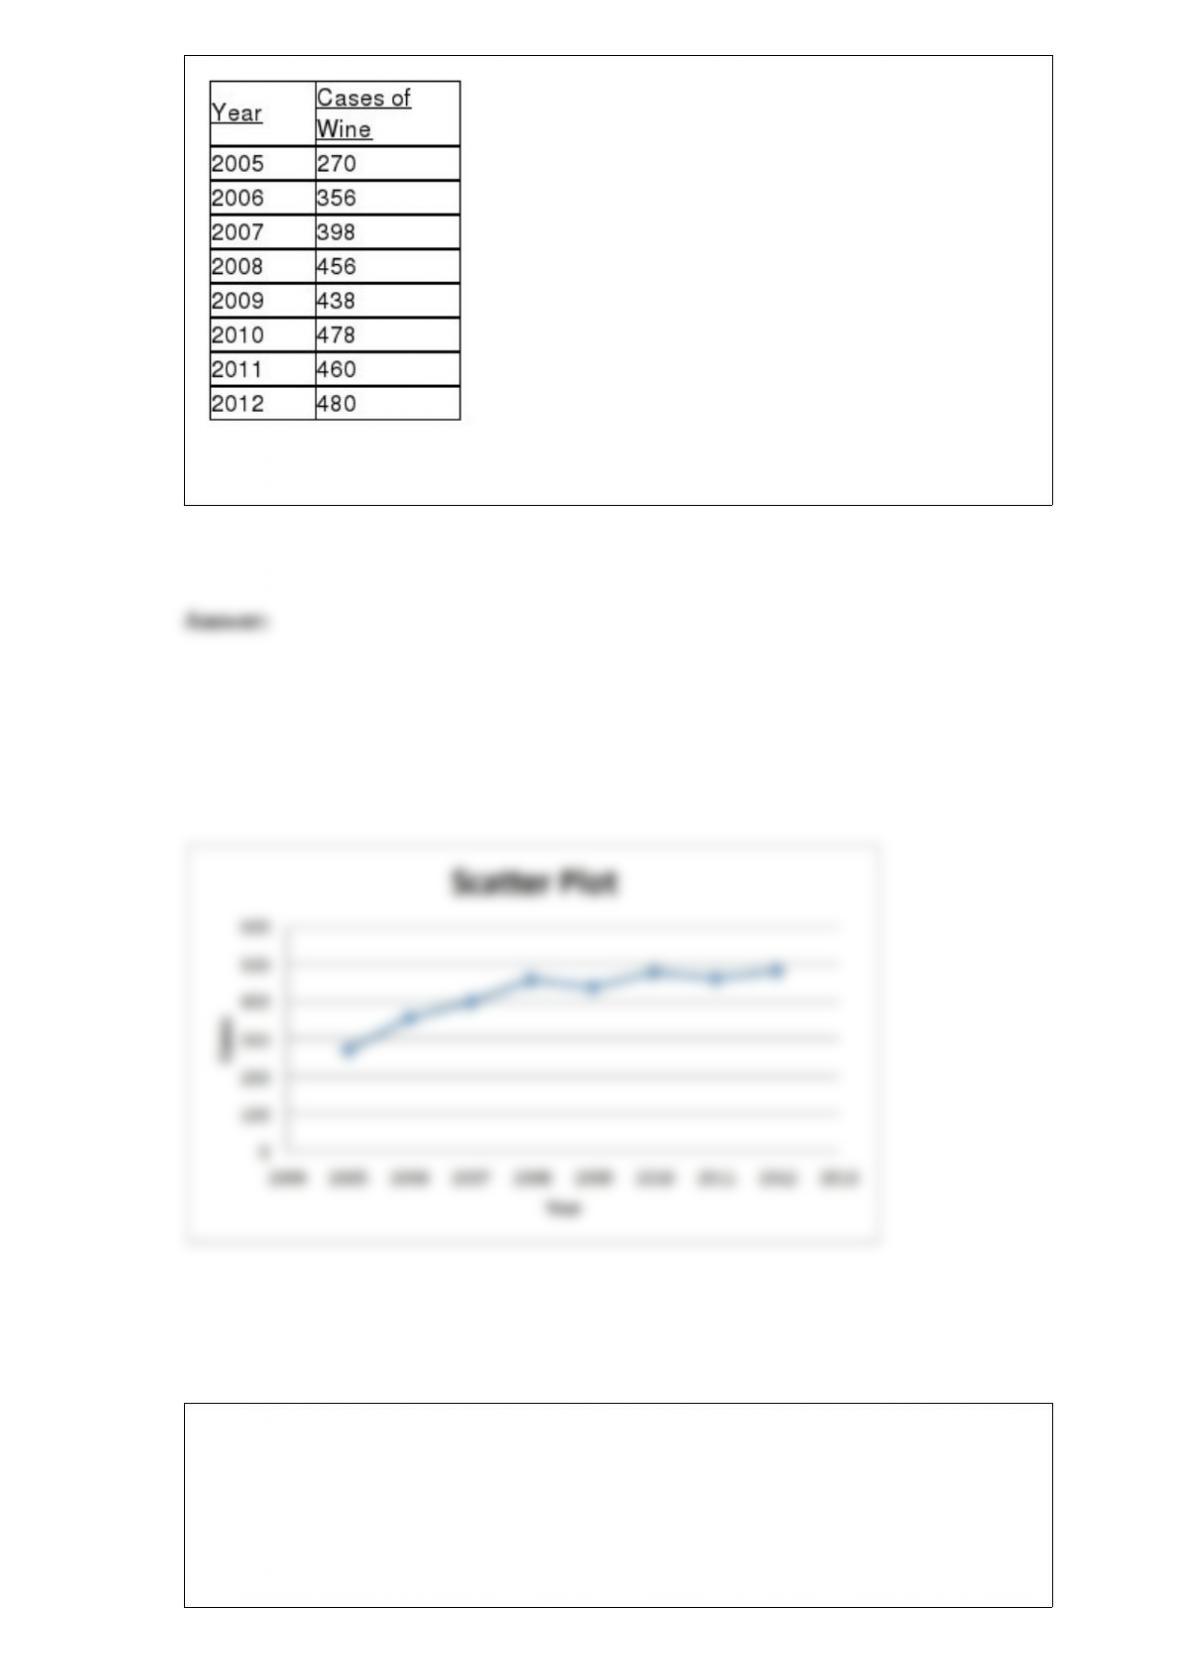
Referring to Table 16-1, set up a scatter diagram (i.e., a time-series plot) with year on
the horizontal X-axis.
TABLE 17-12
The marketing manager for a nationally franchised lawn service company would like to
study the characteristics that differentiate home owners who do and do not have a lawn
service. A random sample of 30 home owners located in a suburban area near a large
city was selected; 15 did not have a lawn service (code 0) and 15 had a lawn service
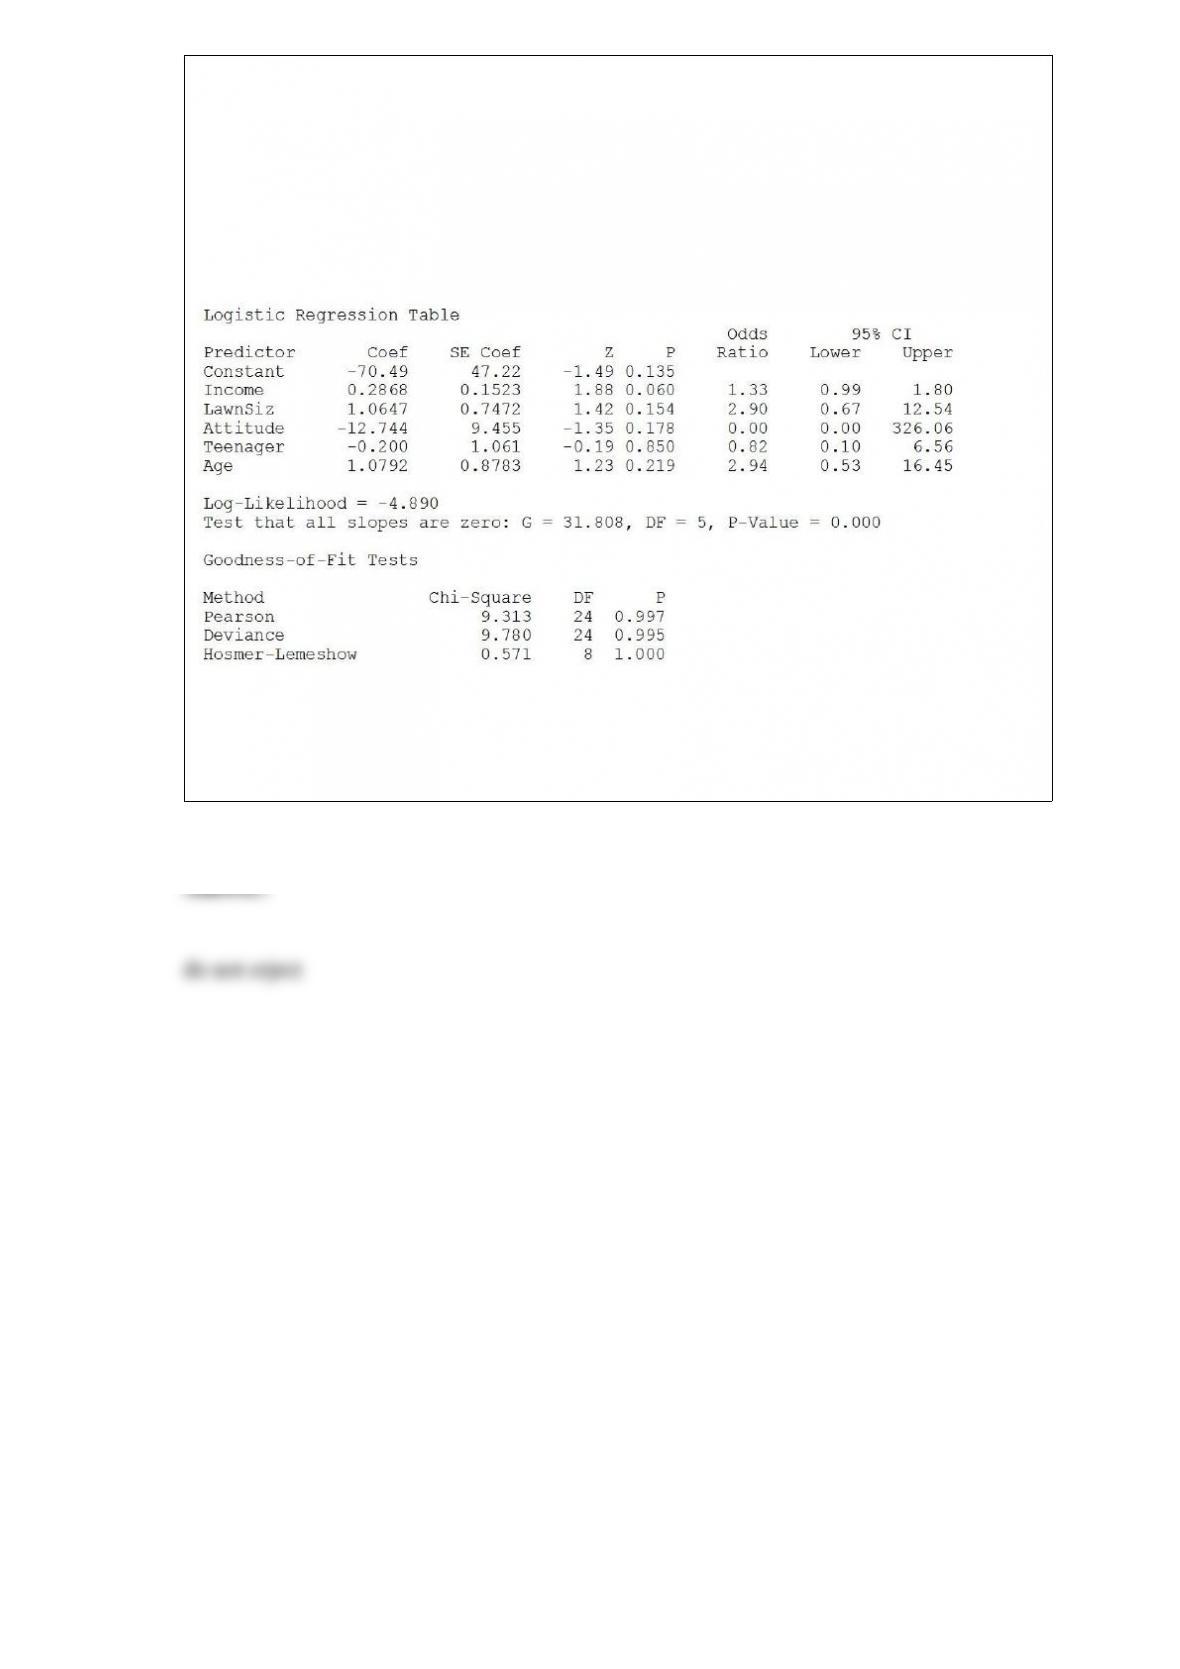
(code 1). Additional information available concerning these 30 home owners includes
family income (Income, in thousands of dollars), lawn size (Lawn Size, in thousands of
square feet), attitude toward outdoor recreational activities (Attitude 0 = unfavorable, 1
= favorable), number of teenagers in the household (Teenager), and age of the head of
the household (Age).
The Minitab output is given below:
Referring to Table 17-12, what should be the decision (‘reject’ or ‘do not reject’) on the
null hypothesis when testing whether Income makes a significant contribution to the
model in the presence of the other independent variables at a 0.05 level of significance?