The Commissioner of Health in New York State wanted to study malpractice litigation
in New York. A sample of 31 thousand medical records was drawn from a population of
2.7 million patients who were discharged during 2010. The proportion of malpractice
claims filed from the sample of 31 thousand patients is a ________.
TABLE 13-11
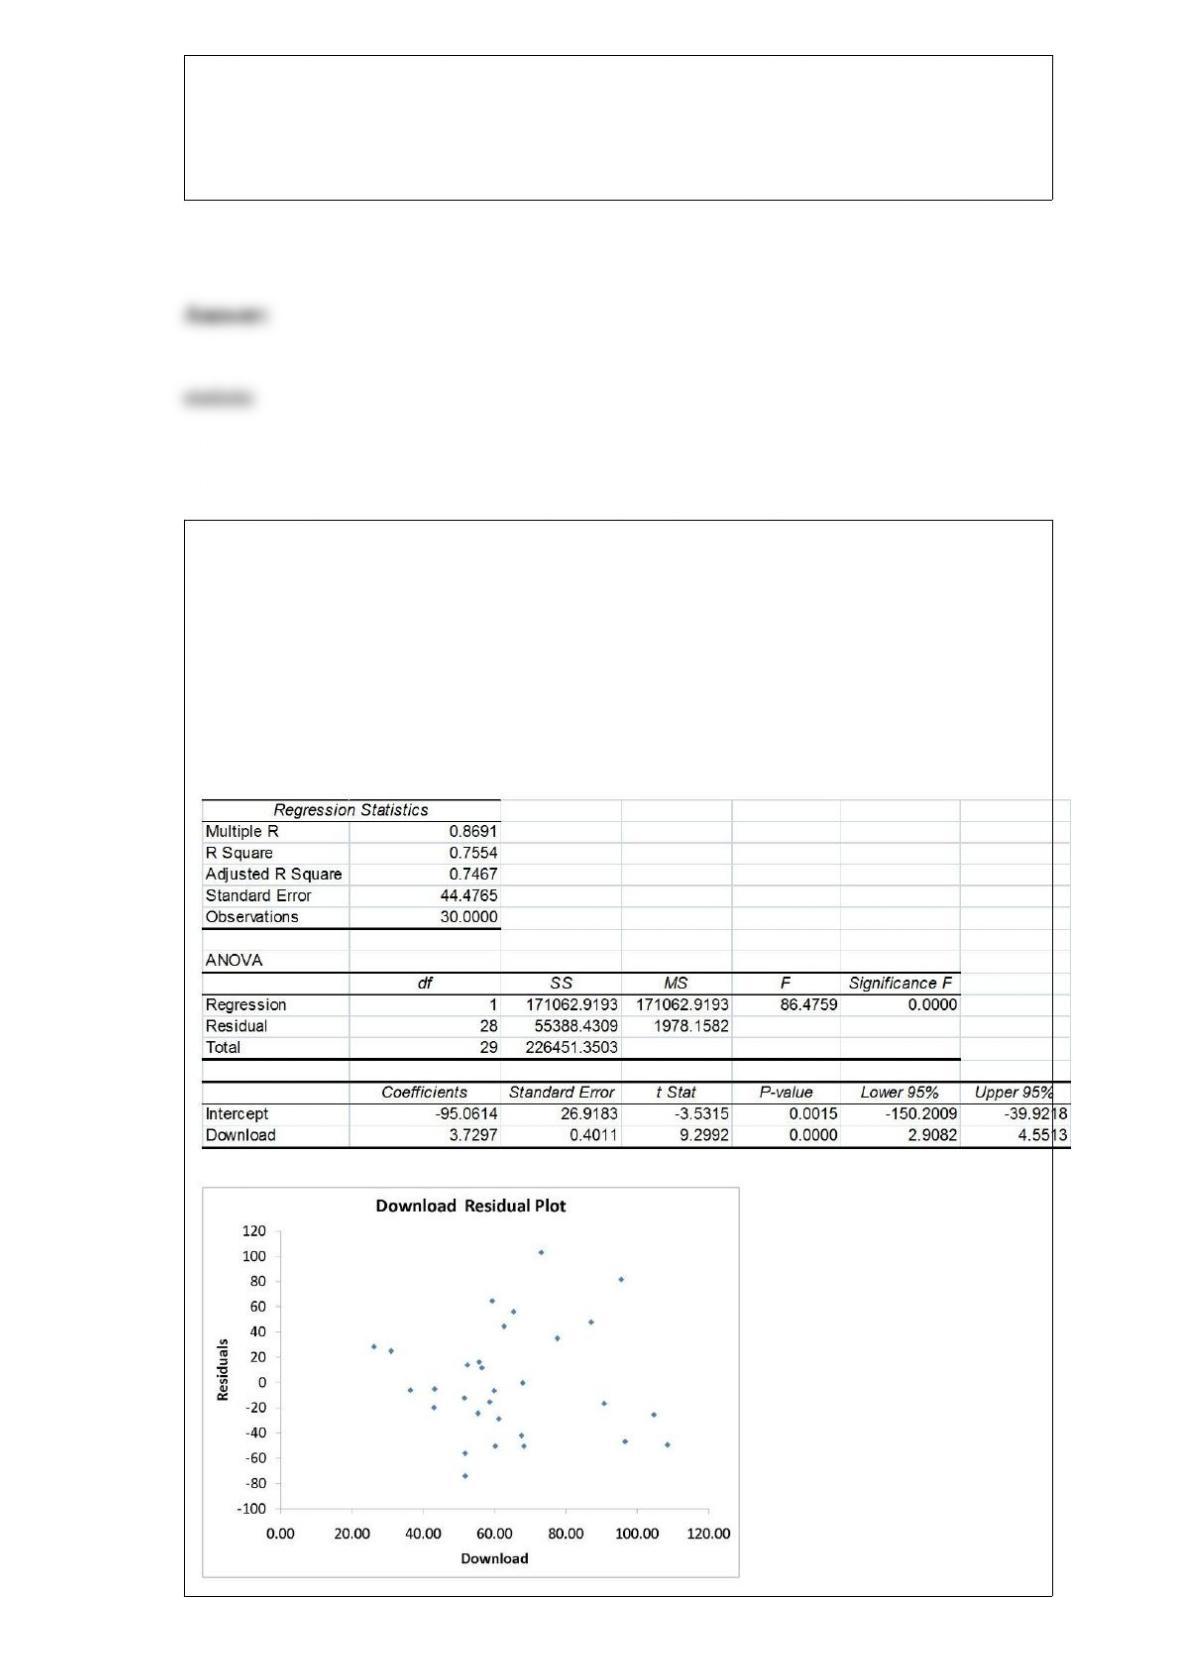
A computer software developer would like to use the number of downloads (in
thousands) for the trial version of his new shareware to predict the amount of revenue
(in thousands of dollars) he can make on the full version of the new shareware.
Following is the output from a simple linear regression along with the residual plot and
normal probability plot obtained from a data set of 30 different sharewares that he has
developed:
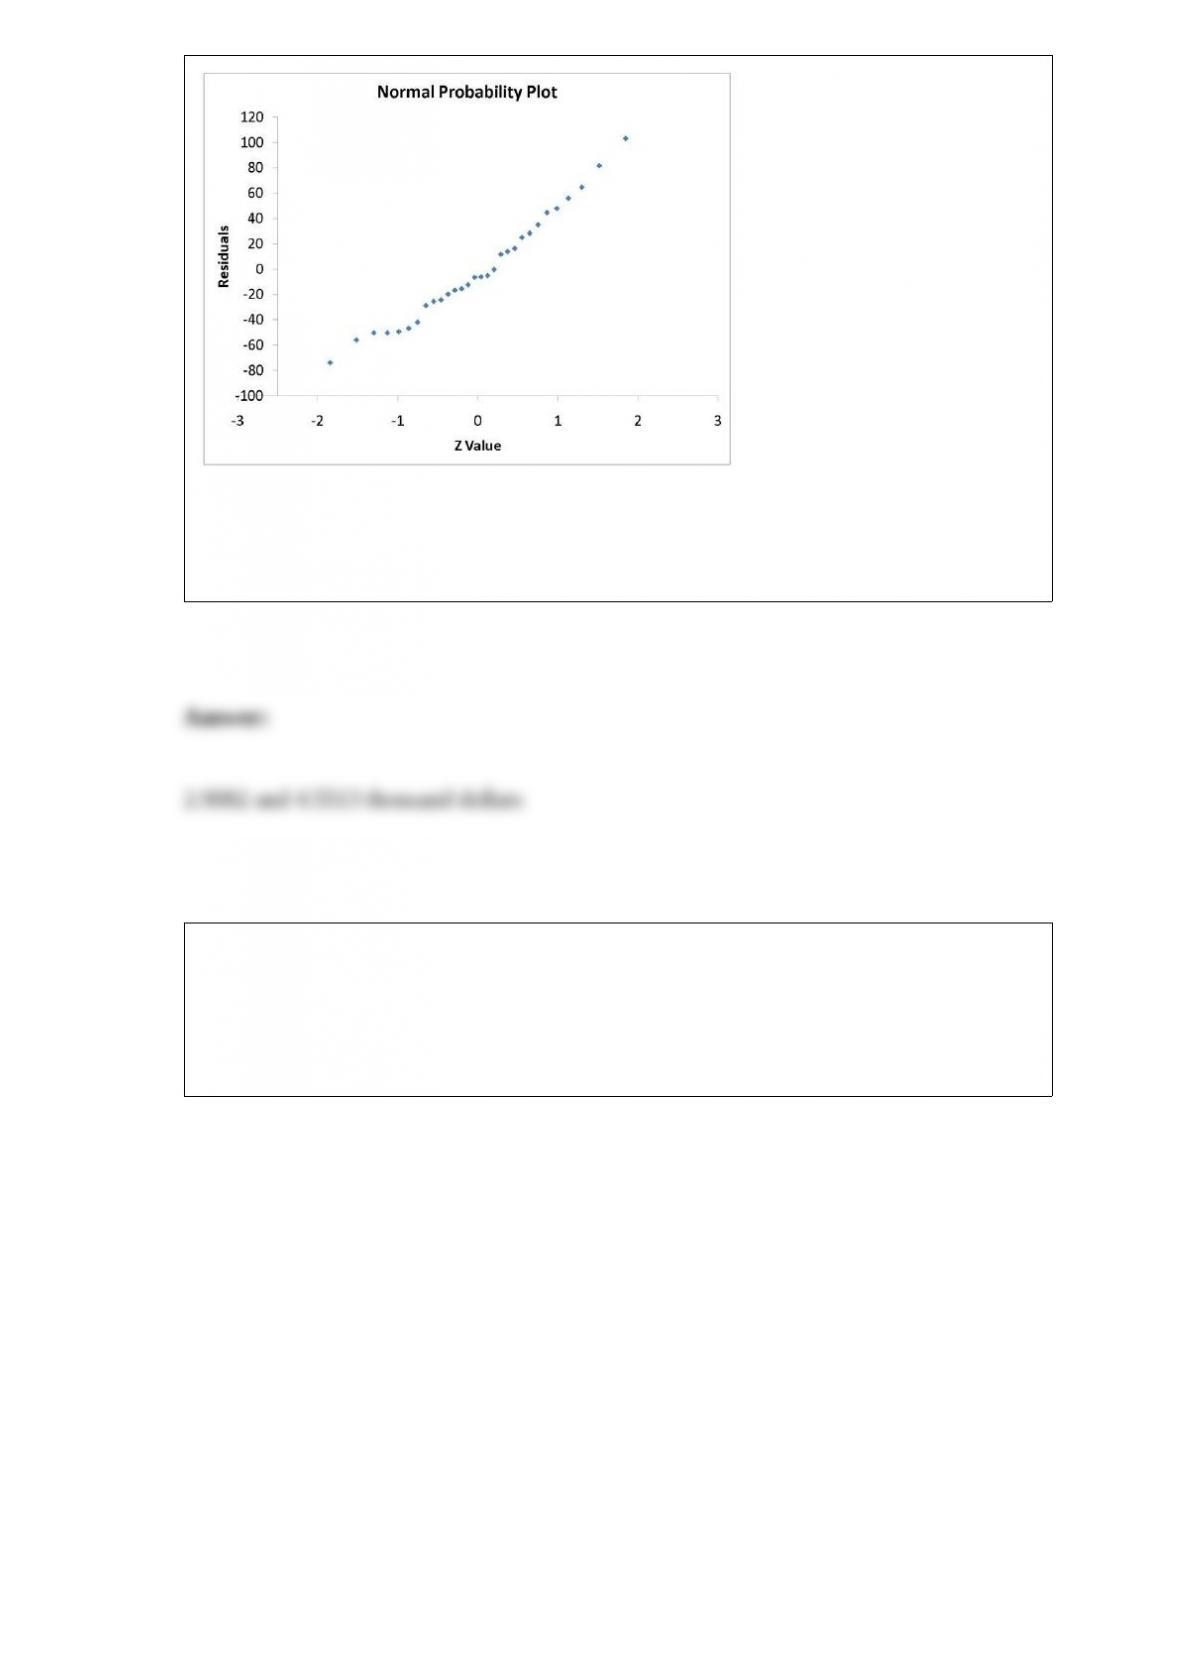
Referring to Table 13-11, what are the lower and upper limits of the 95% confidence
interval estimate for the mean change in revenue as a result of a one thousand increase
in the number of downloads?
TABLE 18-7
A supplier of silicone sheets for producers of computer chips wants to evaluate her
manufacturing process. She takes sample sizes of 5 from each day’s output and counts
the number of blemishes on each silicone sheet. The results from 20 days of such
evaluations are presented below.
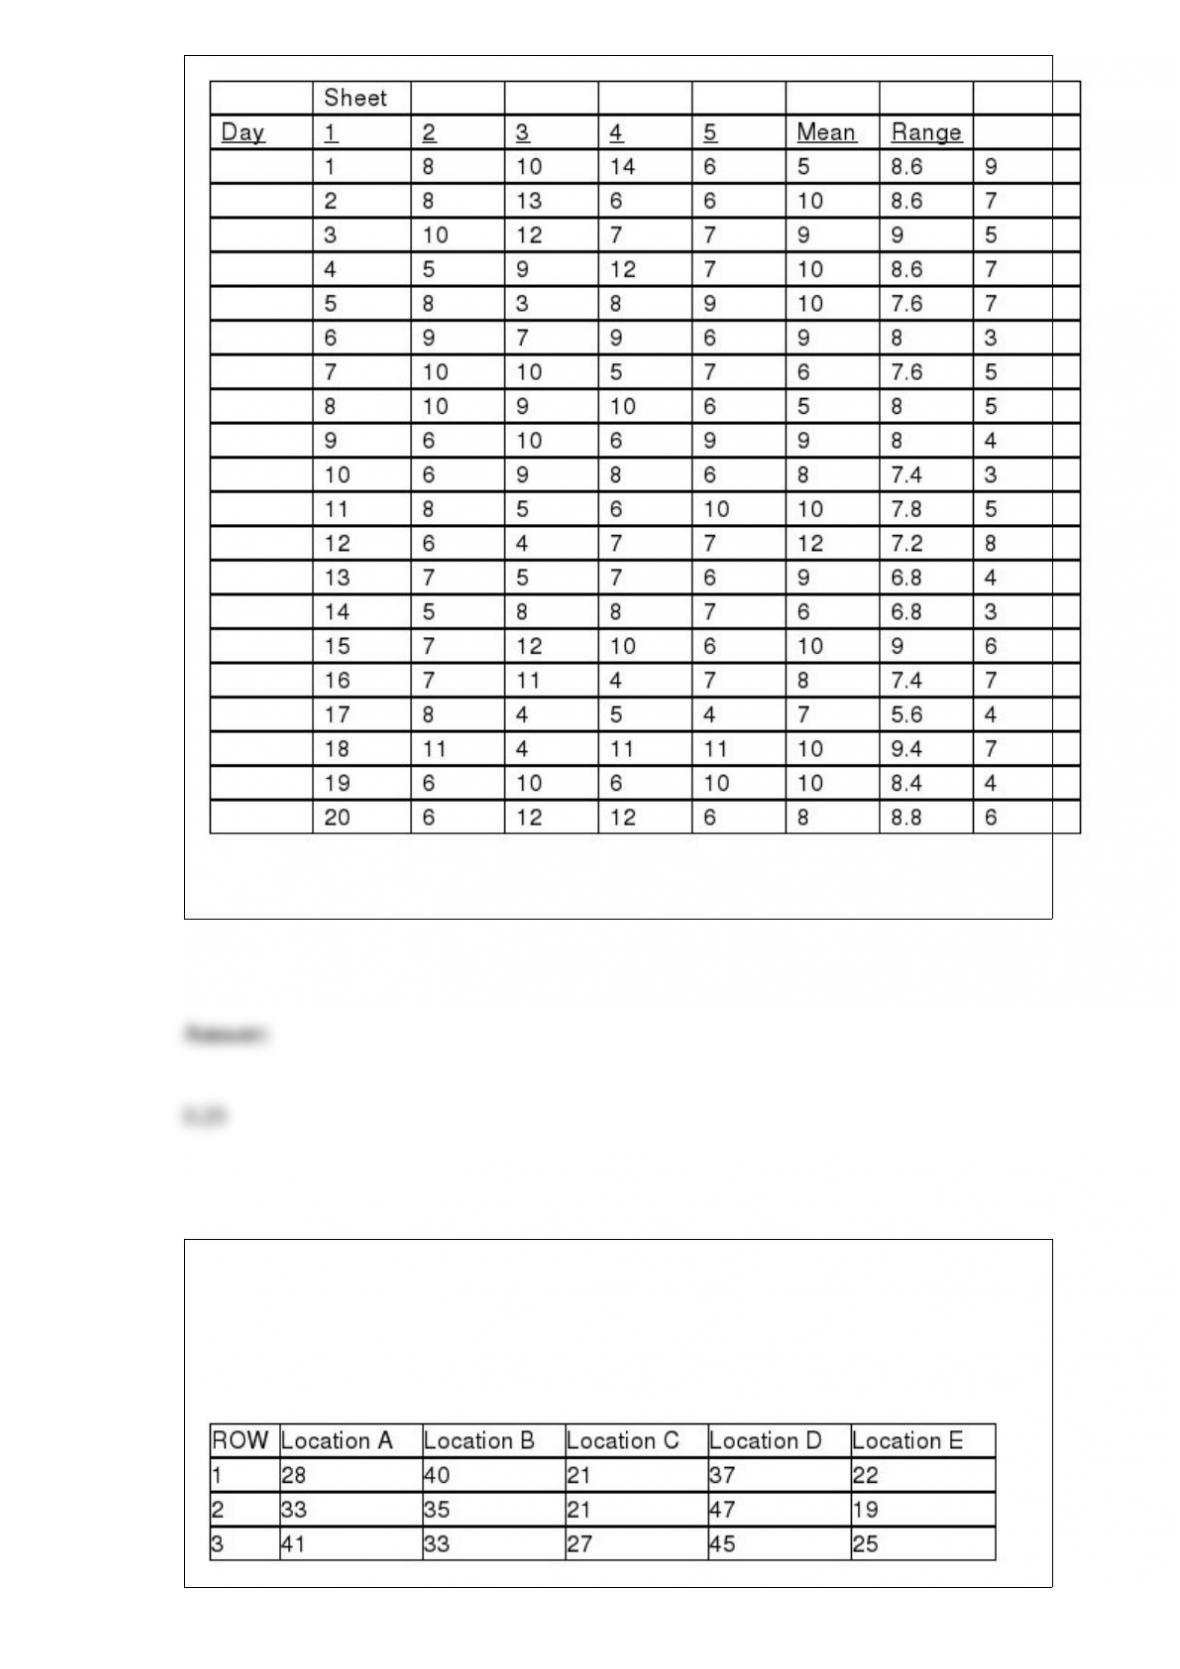
She also decides that the upper specification limit is 10 blemishes.
Referring to Table 18-7, what is the value of the CPU index?
TABLE 11-5
A hotel chain has identically small sized resorts in 5 locations in different small islands.
The data that follow resulted from analyzing the hotel occupancies on randomly
selected days in the 5 locations.
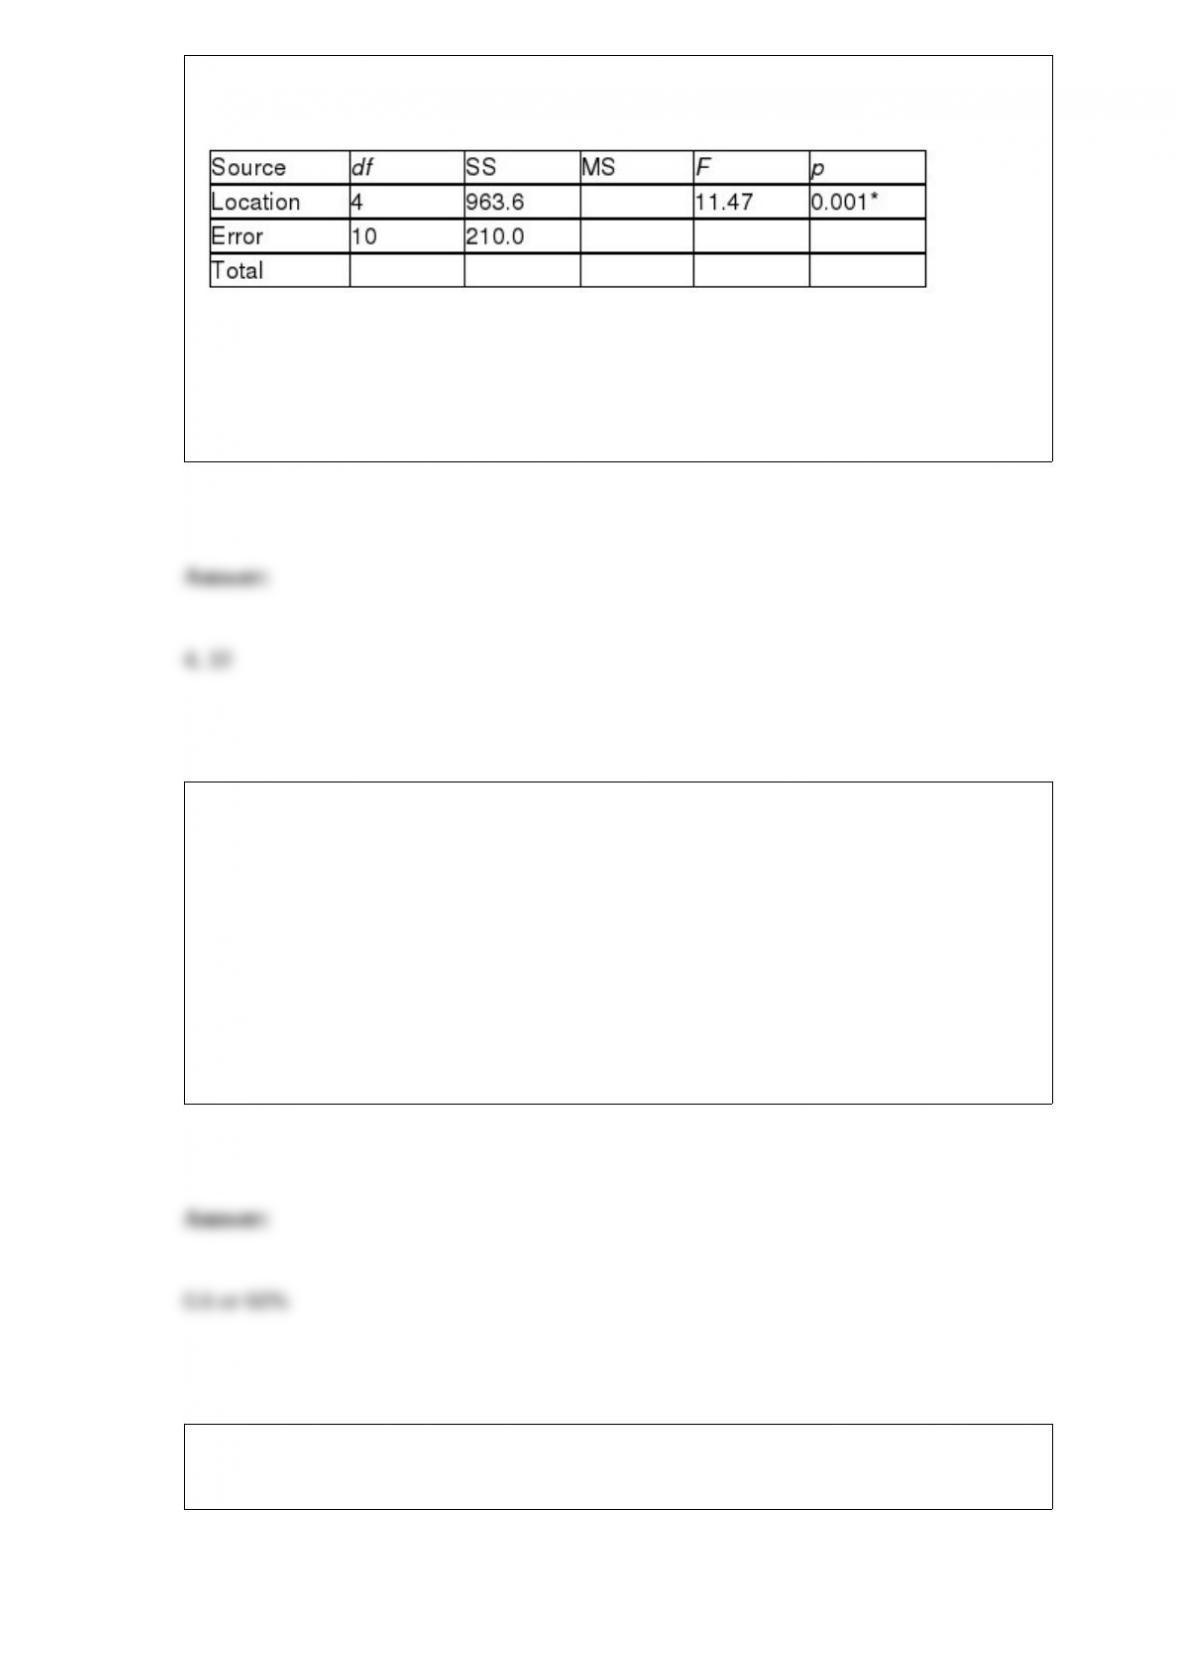
Analysis of Variance
* or p < 0.005, tabular value
Referring to Table 11-5, what are the numerator and denominator degrees of freedom
for Levene’s test for homogeneity of variances respectively?
TABLE 4-10
Are whites more likely to claim bias? It was found that 60% of the workers were white,
30% were black and 10% are other races. Given that a worker was white, the
probability that the worker had claimed bias was 30%. Given that a worker was black,
the probability that the worker had claimed bias was 40%. Given that a worker was
other race, the probability that the worker had claimed bias was 0%.
Referring to Table 4-10, if a randomly selected worker had claimed bias, what is the
probability that the worker is white?
The Dean of Students conducted a survey on campus. Number of credits currently
enrolled for is an example of a ________ numerical variable.
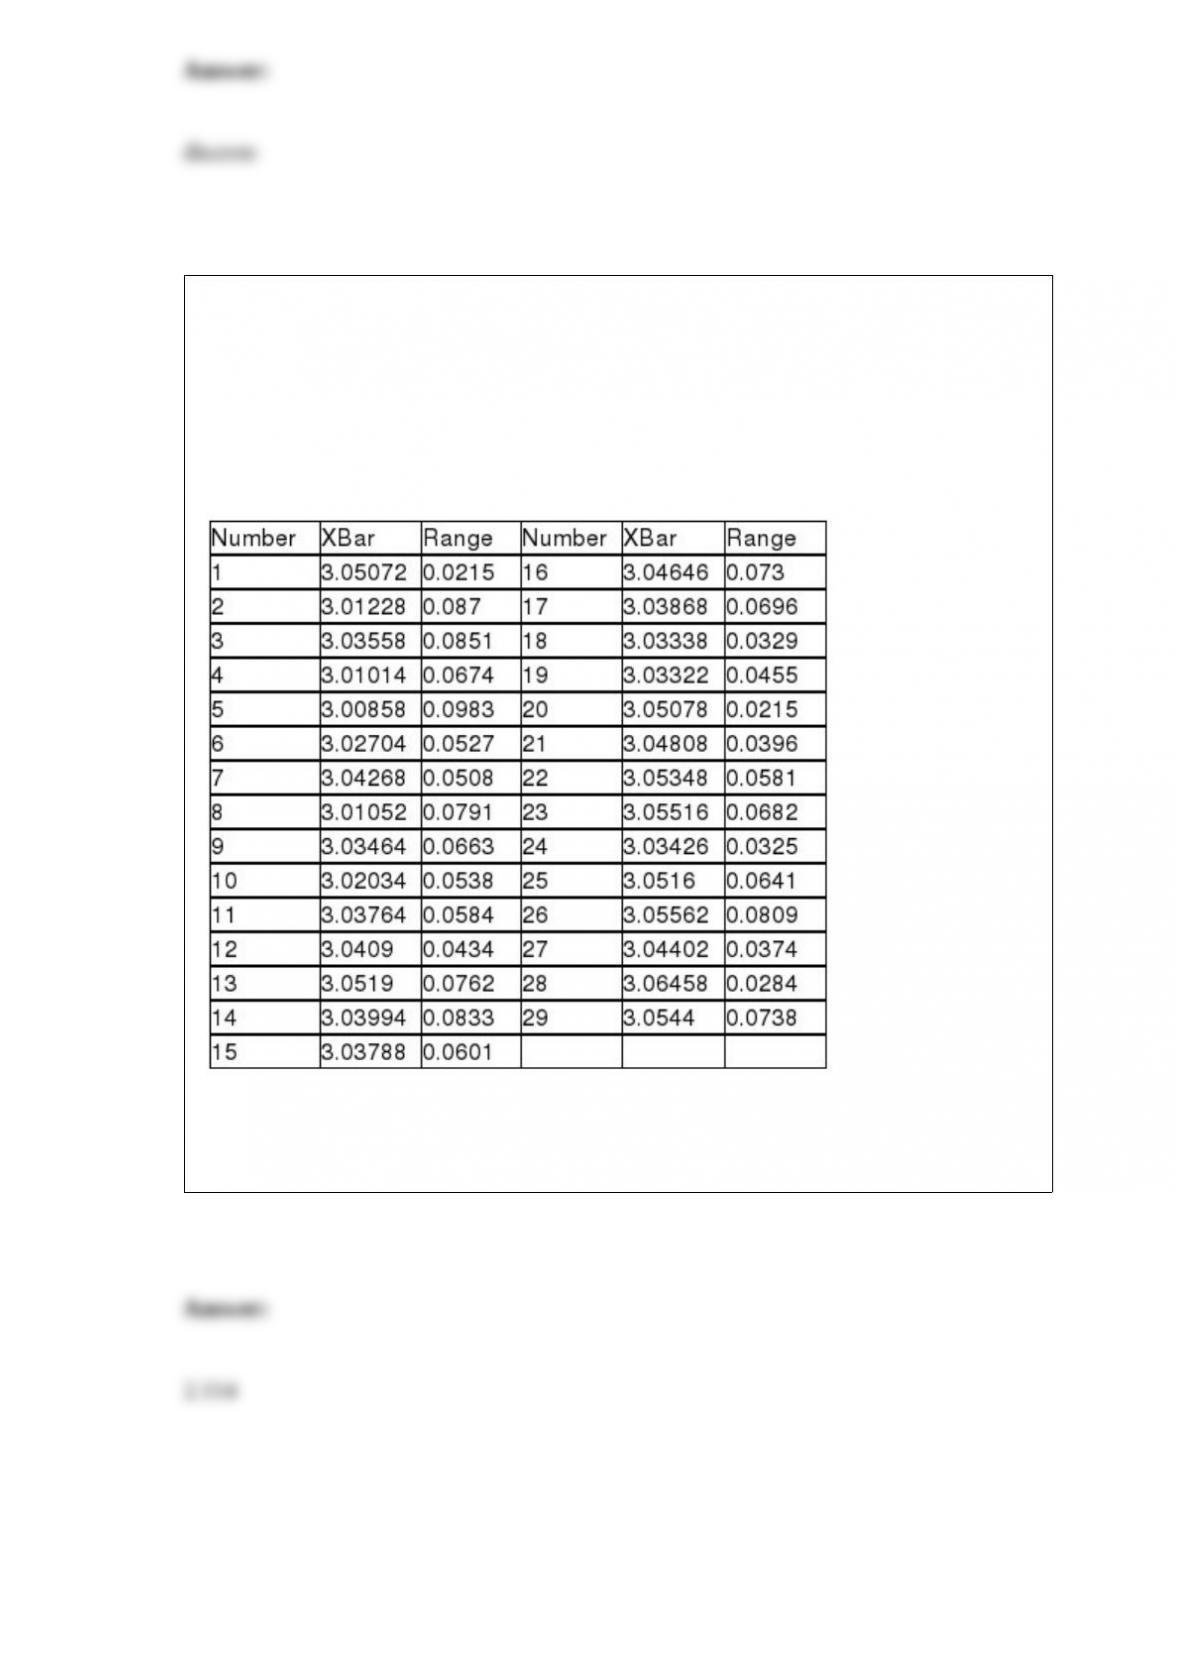
TABLE 18-9
The manufacturer of canned food constructed control charts and analyzed several
quality characteristics. One characteristic of interest is the weight of the filled cans. The
lower specification limit for weight is 2.95 pounds. The table below provides the range
and mean of the weights of five cans tested every fifteen minutes during a day’s
production.
Referring to Table 18-9, an R chart is to be constructed for the weight. One way to
create the upper control limit involves multiplying the mean of the sample ranges by
D4. For this data set, the value of D4 is ________.