Unlock document.
This document is partially blurred.
Unlock all pages and 1 million more documents.
Get Access
True or False: The value of r is always positive.
True or False: The Paasche price index is a form of unweighted aggregate price index.
True or False: The sampling error can either be positive or negative.
True or False: The Poisson distribution can be used to model a continuous random
variable.
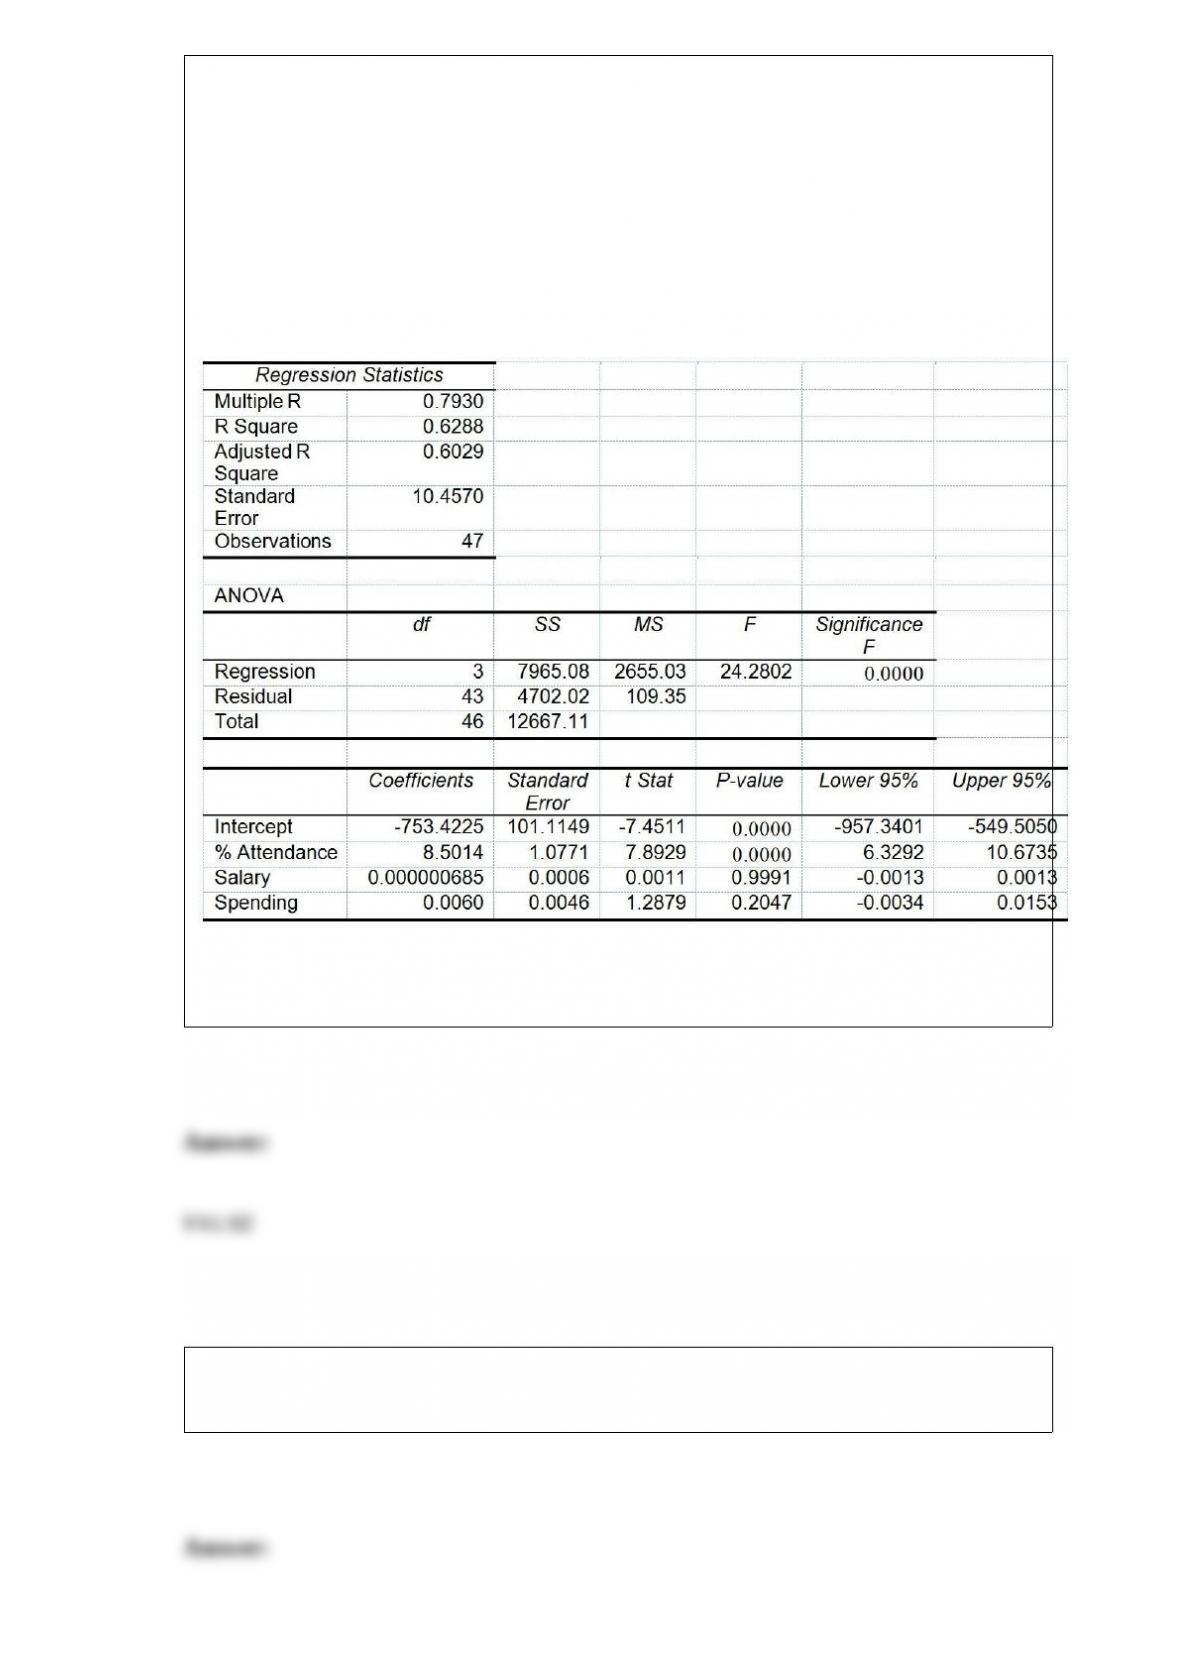
True or False: TABLE 17-8
The superintendent of a school district wanted to predict the percentage of students
passing a sixth-grade proficiency test. She obtained the data on percentage of students
passing the proficiency test (% Passing), daily mean of the percentage of students
attending class (% Attendance), mean teacher salary in dollars (Salaries), and
instructional spending per pupil in dollars (Spending) of 47 schools in the state.
Following is the multiple regression output with Y = % Passing as the dependent
variable, X1 = % Attendance, X2 = Salaries and X3 = Spending:
Referring to Table 17-8, there is sufficient evidence that all of the explanatory variables
are related to the percentage of students passing the proficiency test at a 5% level of
significance.
True or False: When the sample sizes are equal, the pooled variance of the two groups
is the average of the 2 sample variances.
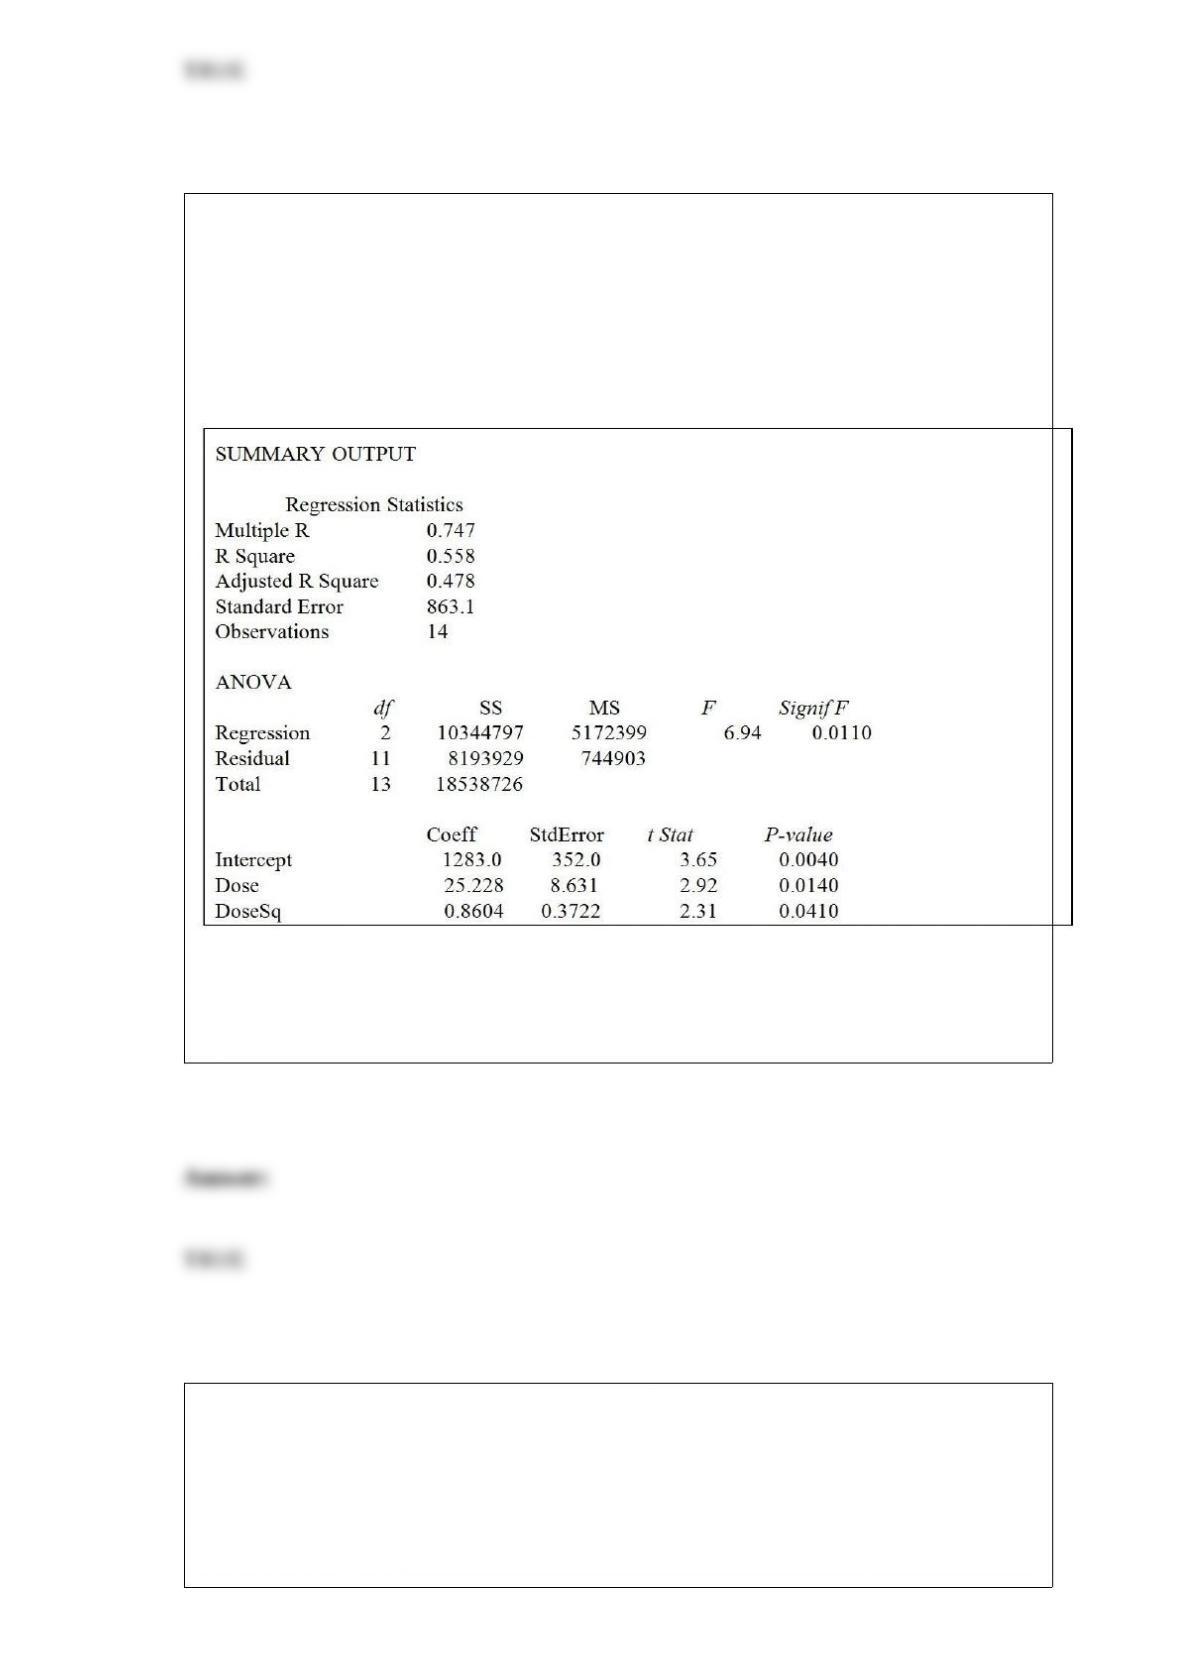
TABLE 15-3
A chemist employed by a pharmaceutical firm has developed a muscle relaxant. She
took a sample of 14 people suffering from extreme muscle constriction. She gave each a
vial containing a dose (X) of the drug and recorded the time to relief (Y) measured in
seconds for each. She fit a curvilinear model to this data. The results obtained by
Microsoft Excel follow
True or False: Referring to Table 15-3, suppose the chemist decides to use an F test to
determine if there is a significant curvilinear relationship between time and dose. If she
chooses to use a level of significance of 0.05, she would decide that there is a
significant curvilinear relationship.
A summary measure that is computed to describe a characteristic of an entire population
is called
A) a parameter.
B) an ordered array.
C) a statistic.
D) a summary table.
TABLE 9-6
The quality control engineer for a furniture manufacturer is interested in the mean
amount of force necessary to produce cracks in stressed oak furniture. She performs a
two-tail test of the null hypothesis that the mean for the stressed oak furniture is 650.
The calculated value of the Z test statistic is a positive number that leads to a p-value of
0.080 for the test.
Referring to Table 9-6, suppose the engineer had decided that the alternative hypothesis
to test was that the mean was less than 650. What would be the p-value of this one-tail
test?
A) 0.040
B) 0.160
C) 0.840
D) 0.960
TABLE 2-15
The figure below is the ogive for the amount of fat (in grams) for a sample of 36 pizza
products where the upper boundaries of the intervals are: 5, 10, 15, 20, 25, and 30.
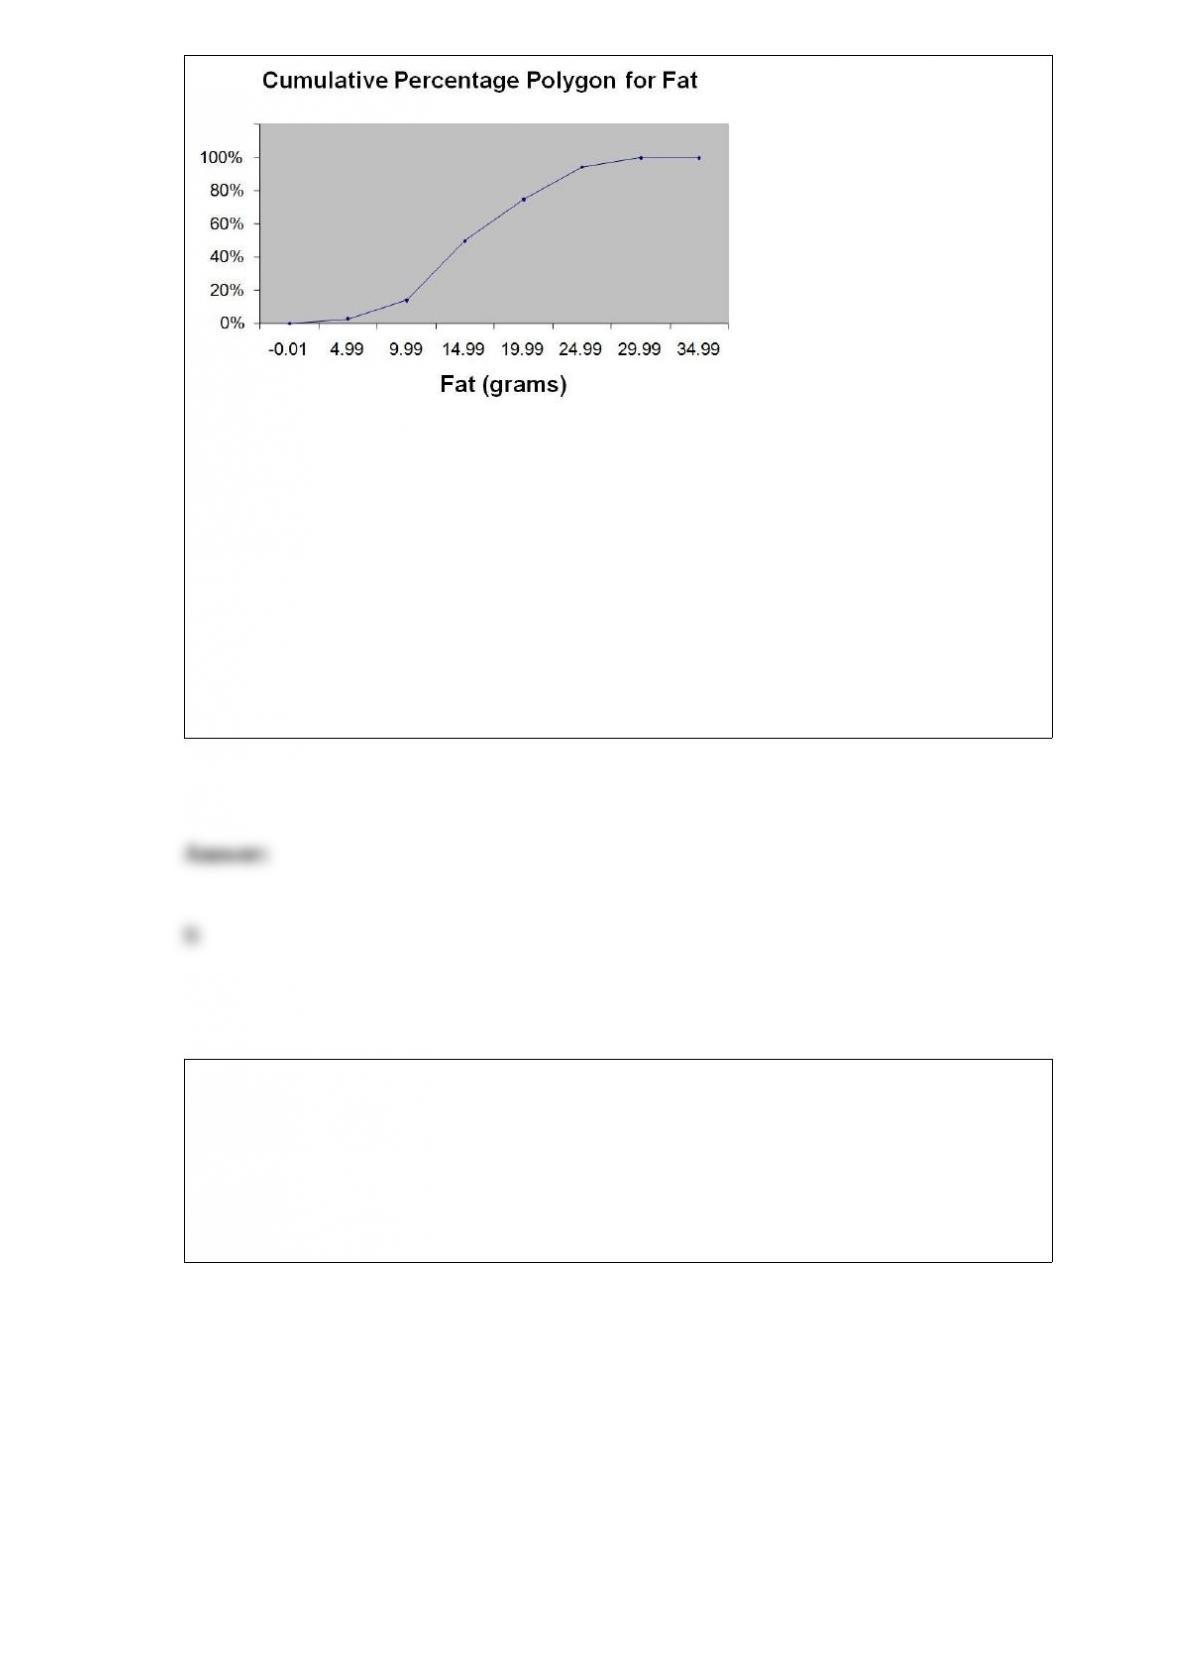
Referring to Table 2-15, what percentage of pizza products contains at least 20 grams of
fat?
A) 5%
B) 25%
C) 75%
D) 96%
Referring to Table 14-3, what is the estimated mean consumption level for an economy
with GDP equal to $4 billion and an aggregate price index of 150?
TABLE 14-3
An economist is interested to see how consumption for an economy (in $ billions) is
influenced by gross domestic product ($ billions) and aggregate price (consumer price
index). The Microsoft Excel output of this regression is partially reproduced below.
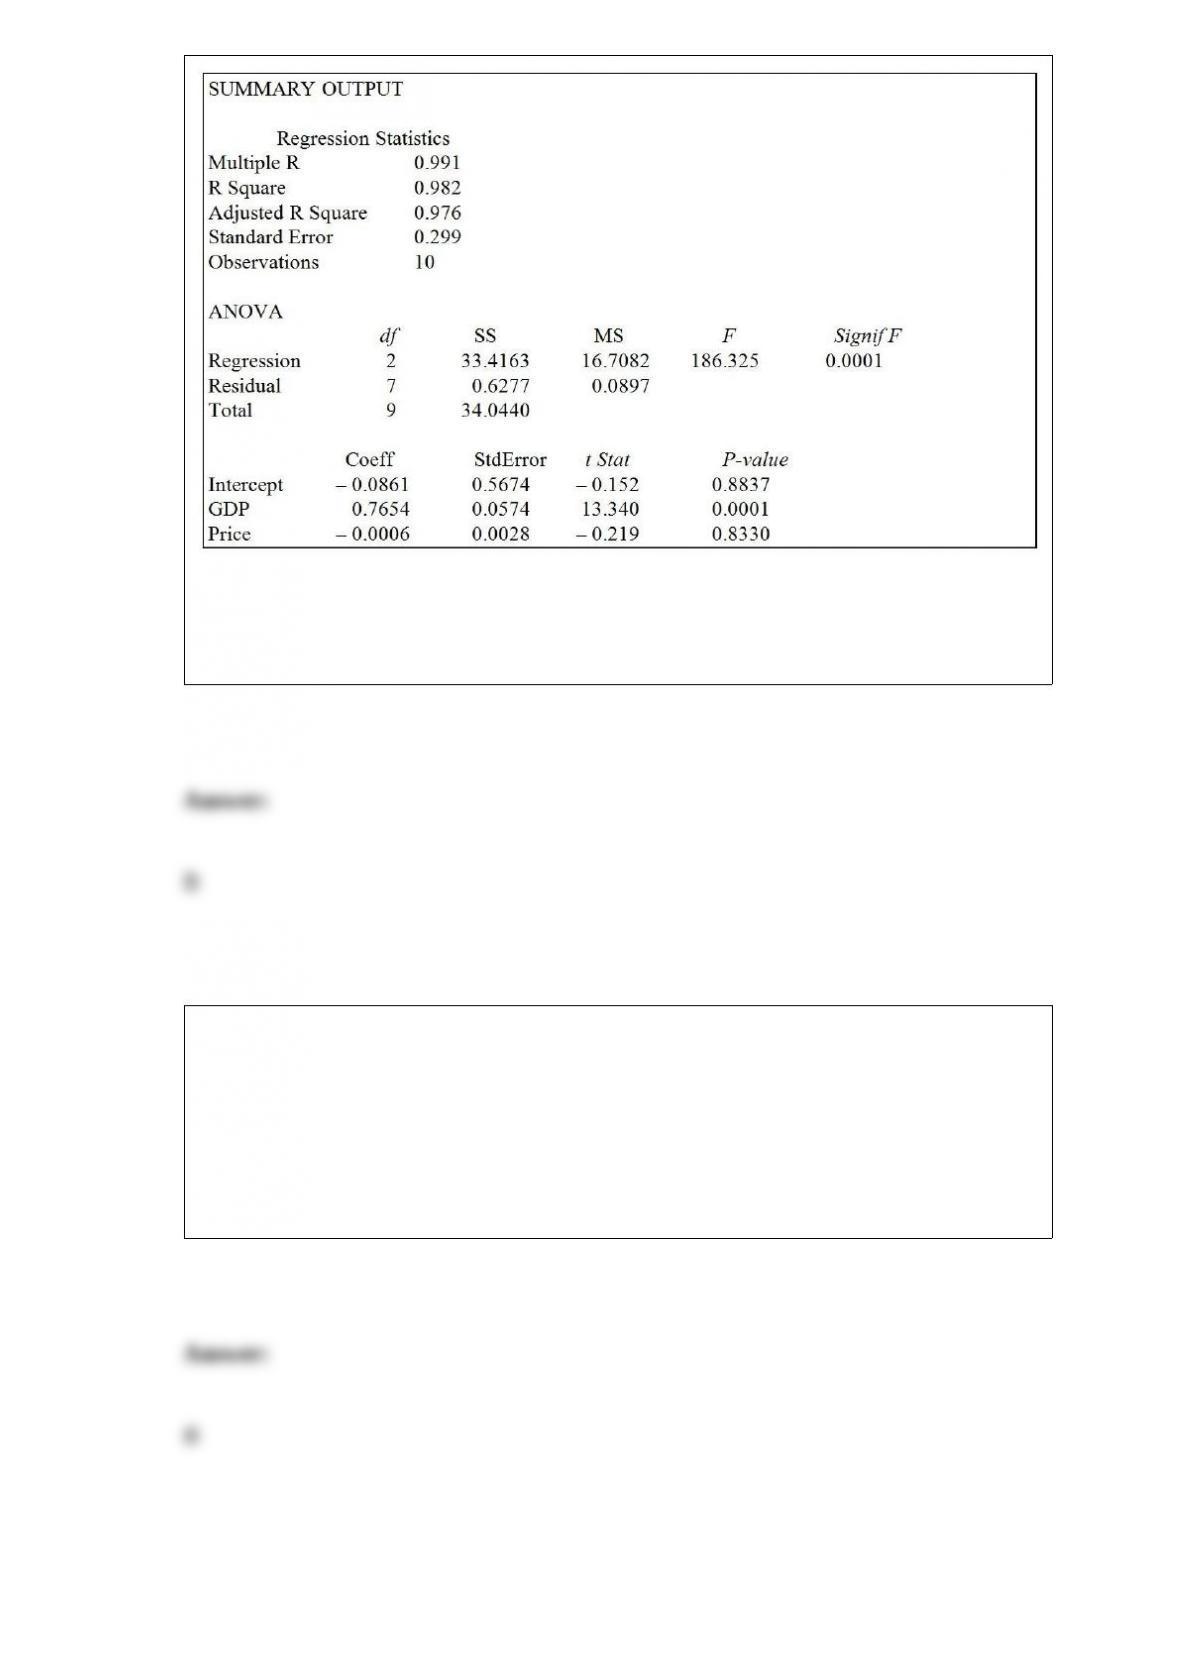
A) $1.39 billion
B) $2.89 billion
C) $4.75 billion
D) $9.45 billion
Data on the amount of time spent studying for a particular exam at a high school were
collected for 150 students. You want to know if half of the students spent at least how
much time studying for that exam. Which of the following would you compute?
A) Arithmetic mean
B) Median
C) Coefficient of variation
D) Coefficient of correlation
The sample correlation coefficient between X and Y is 0.375. It has been found out that
the p-value is 0.744 when testing H0 : = 0 against the one-sided alternative H1 : < 0.
To test H0 : = 0 against the two-sided alternative H1 : 0 at a significance level of
0.1, the p-value is
A) 0.744 / 2.
B) (0.744)(2).
C) 1 - 0.744.
D) (1 - 0.744)(2).
True or False: The interquartile range is a measure of central tendency in a set of data.
A debate team of 4 members for a high school will be chosen randomly from a potential
group of 15 students. Ten of the 15 students have no prior competition experience while
the others have some degree of experience. Which of the following distributions would
you use to determine the probability that none of the members chosen for the team have
any competition experience?
A) Hypergeometric distribution
B) Poisson distribution
C) Uniform distribution
D) Binomial distribution
To test the effectiveness of a business school preparation course, 8 students took a
general business test before and after the course. Suppose the before and after exam
scores are both normally distributed. Which of the following tests will be the most
appropriate?
A) Pooled-variance t test
B) Paired t test
C) Wilcoxon rank sum test
D) McNemar test
In a one-way ANOVA, the null hypothesis is always
A) there is no difference in the population means.
B) there is some treatment effect.
C) all the population means are different.
D) some of the population means are different.
TABLE 2-6
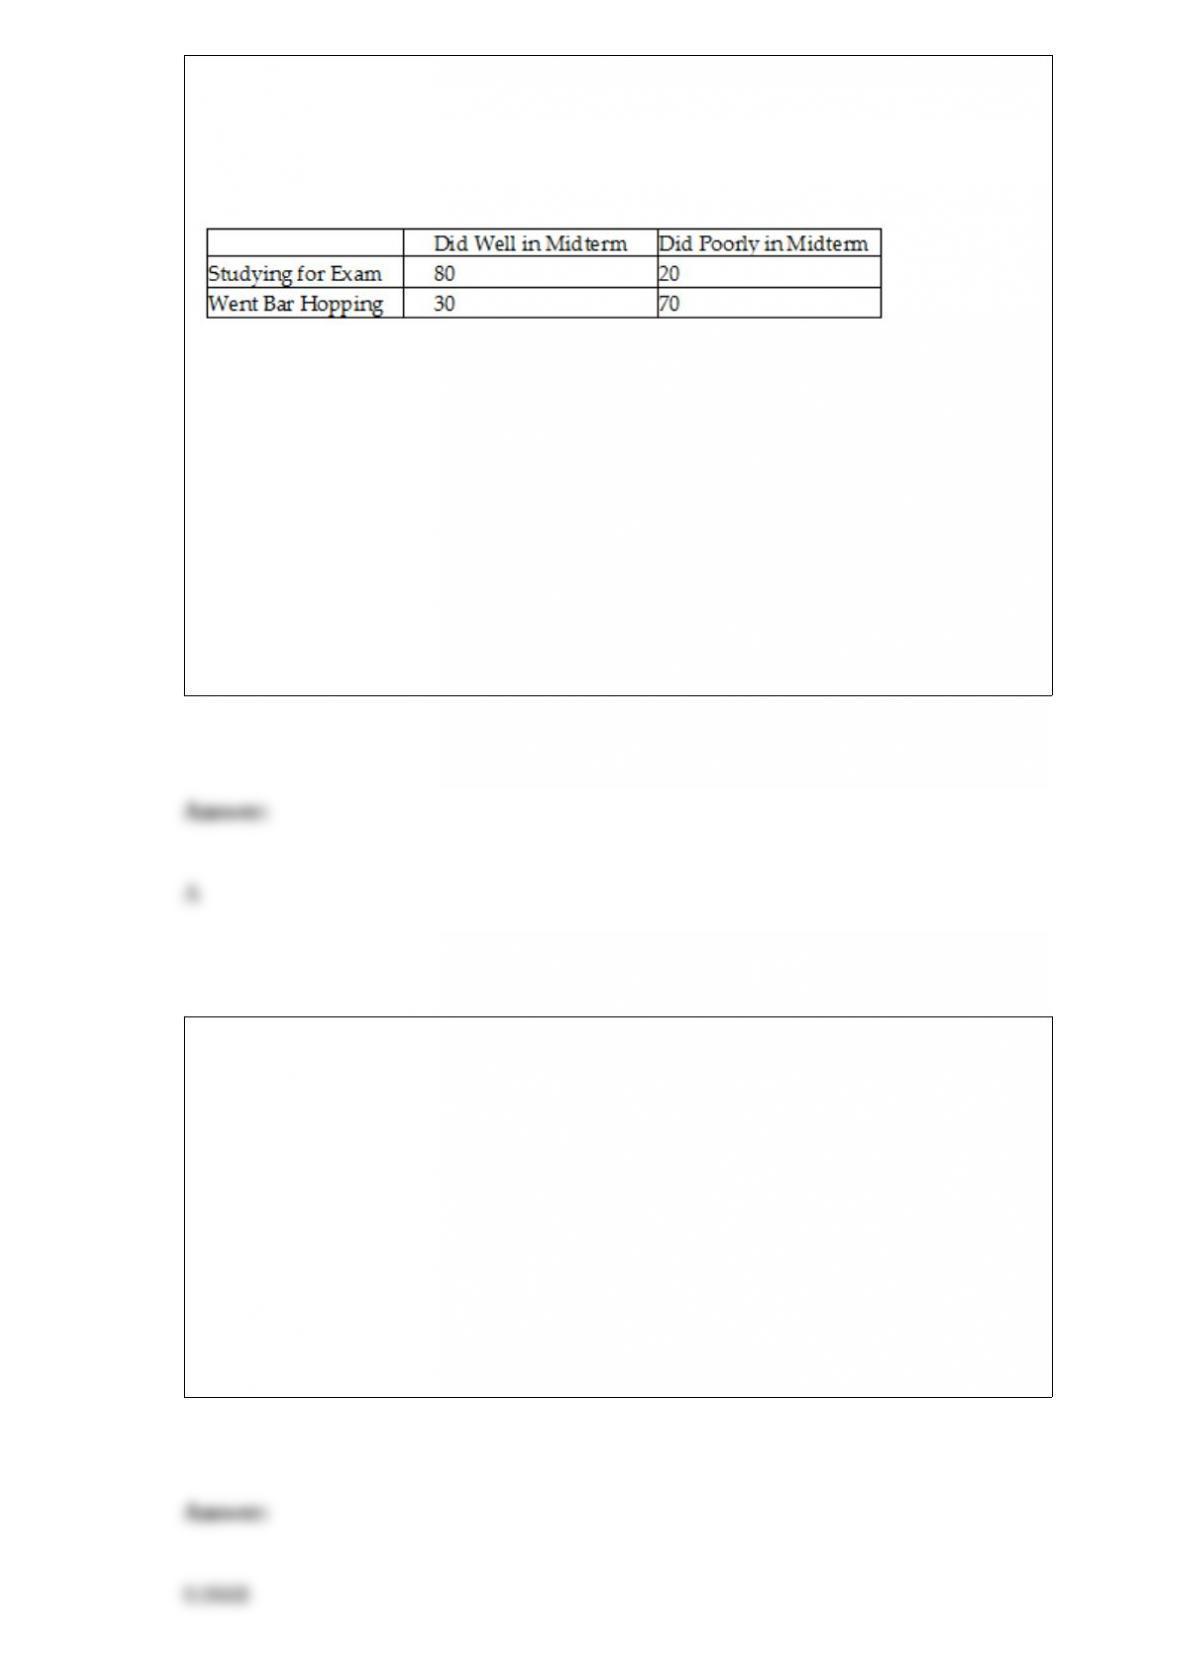
A sample of 200 students at a Big-Ten university was taken after the midterm to ask
them whether they went bar hopping the weekend before the midterm or spent the
weekend studying, and whether they did well or poorly on the midterm. The following
table contains the result.
Referring to Table 2-6, if the sample is a good representation of the population, we can
expect ________ percent of the students in the population to spend the weekend
studying and do poorly on the midterm.
A) 10
B) 20
C) 45
D) 50
TABLE 9-4
A drug company is considering marketing a new local anesthetic. The effective time of
the anesthetic the drug company is currently producing has a normal distribution with a
mean of 7.4 minutes with a standard deviation of 1.2 minutes. The chemistry of the new
anesthetic is such that the effective time should be normally distributed with the same
standard deviation, but the mean effective time may be lower. If it is lower, the drug
company will market the new anesthetic; otherwise, they will continue to produce the
older one. A sample size of 36 results in a sample mean of 7.1. A hypothesis test will be
done to help make the decision.
Referring to Table 9-4, the p-value of the test is ________.
TABLE 17-9
What are the factors that determine the acceleration time (in sec.) from 0 to 60 miles per
hour of a car? Data on the following variables for 171 different vehicle models were
collected:
Accel Time: Acceleration time in sec.
Cargo Vol: Cargo volume in cu. ft.
HP: Horsepower
MPG: Miles per gallon
SUV: 1 if the vehicle model is an SUV with Coupe as the base when SUV and Sedan
are both 0
Sedan: 1 if the vehicle model is a sedan with Coupe as the base when SUV and Sedan
are both 0
The regression results using acceleration time as the dependent variable and the
remaining variables as the independent variables are presented below.
The various residual plots are as shown below.
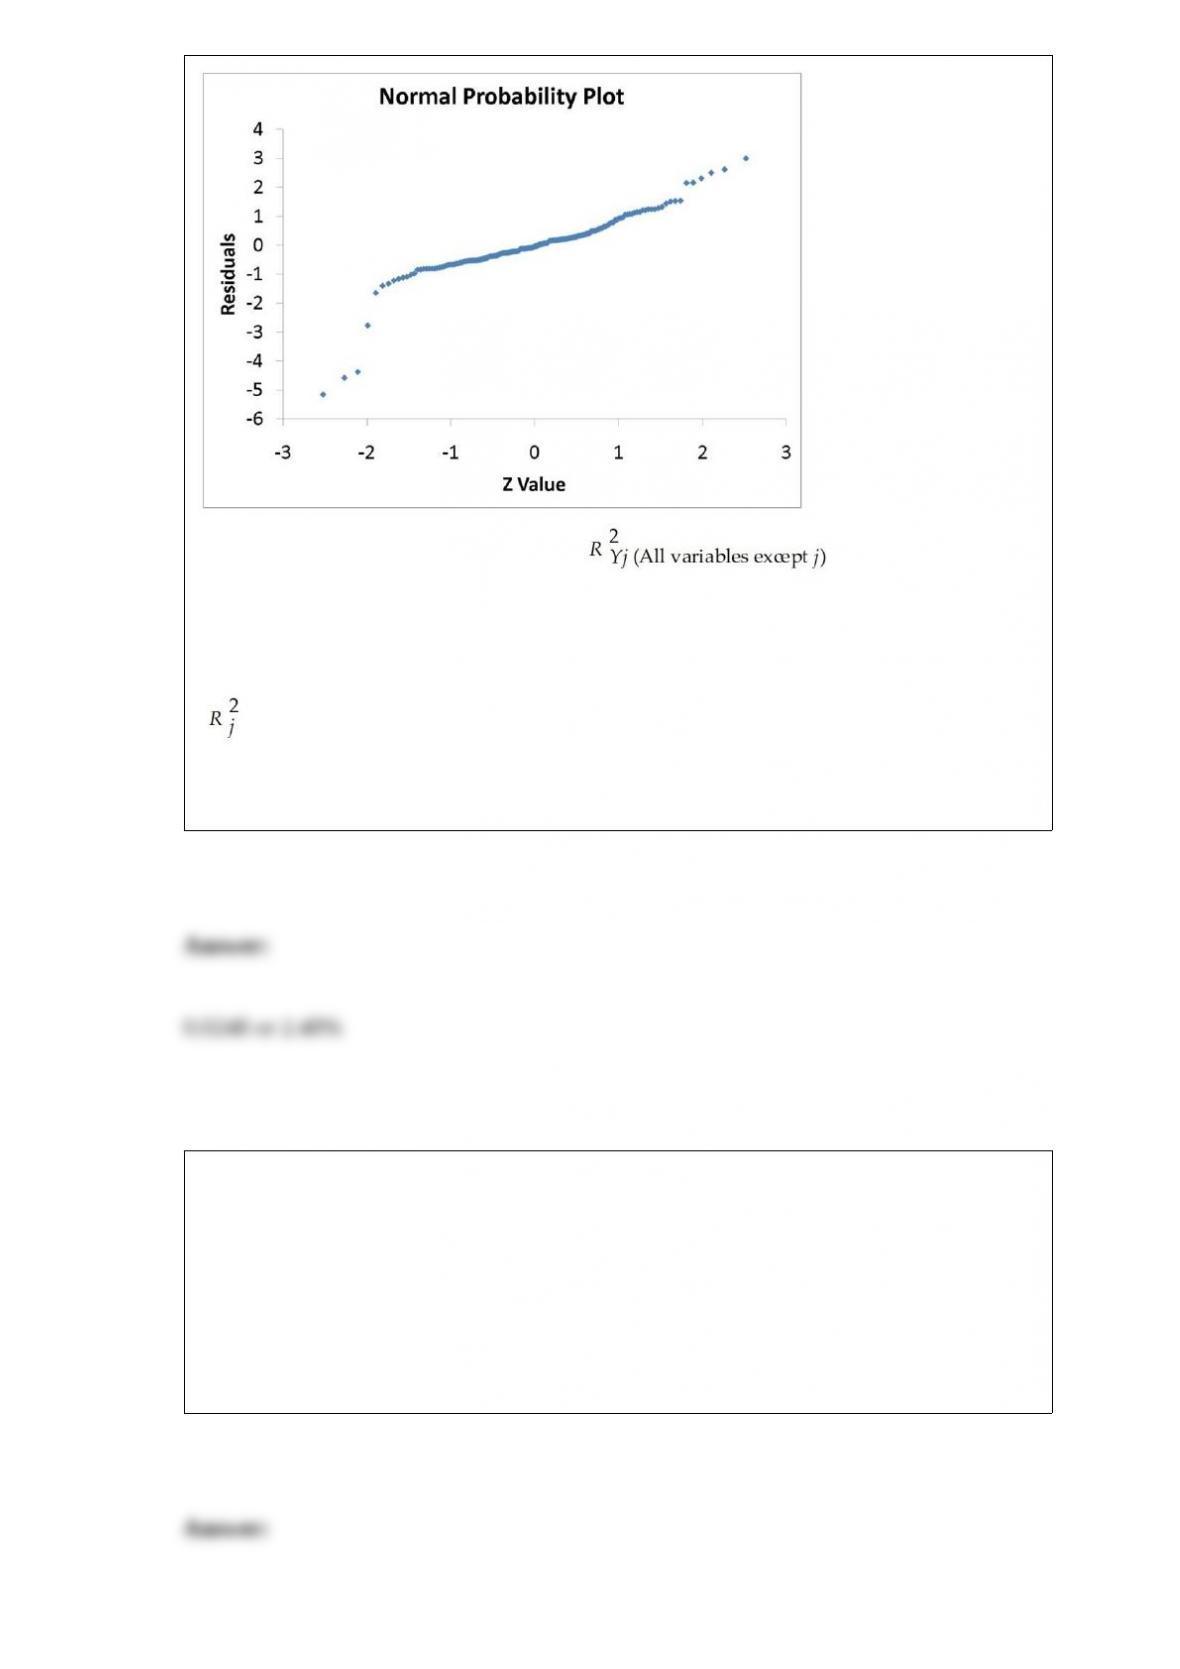
The coefficient of partial determination ( ) of each of the 5
predictors are, respectively, 0.0380, 0.4376, 0.0248, 0.0188, and 0.0312.
The coefficient of multiple determination for the regression model using each of the 5
variables Xj as the dependent variable and all other X variables as independent variables
( ) are, respectively, 0.7461, 0.5676, 0.6764, 0.8582, 0.6632.
Referring to Table 17-9, ________ of the variation in Accel Time can be explained by
MPG while controlling for the other independent variables.
TABLE 7-1
The time spent studying by students in the week before final exams follows a normal
distribution with a standard deviation of 8 hours. A random sample of 4 students was
taken in order to estimate the mean study time for the population of all students.
Referring to Table 7-1, what is the probability that the sample mean exceeds the
population mean by more than 2 hours?
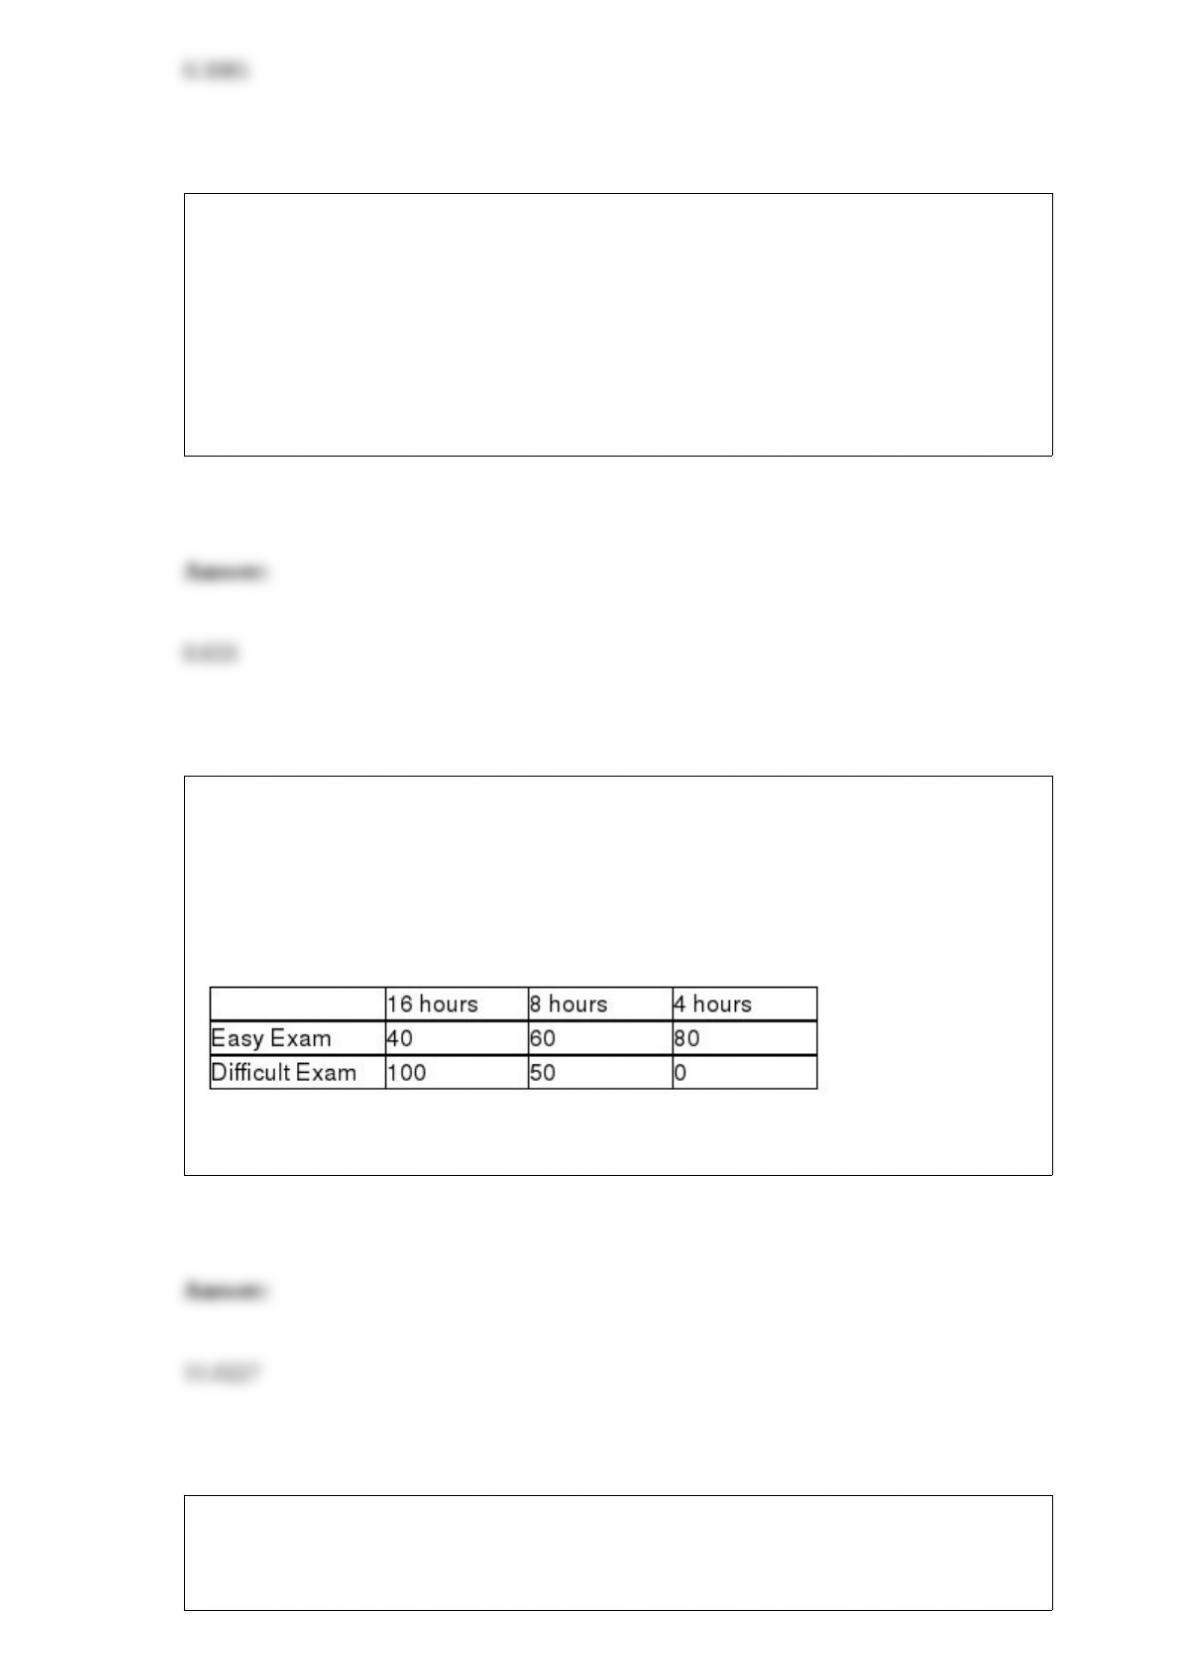
TABLE 4-6
At a Texas college, 60% of the students are from the southern part of the state, 30% are
from the northern part of the state, and the remaining 10% are from out-of-state. All
students must take and pass an Entry
Referring to Table 4-6, if a randomly selected student is not from out-of-state, the
probability that the student has passed the ELM is ________.
TABLE 19-6
A student wanted to find out the optimal strategy to study for a Business Statistics
exam. He constructed the following payoff table based on the mean amount of time he
needed to study every week for the course and the degree of difficulty of the exam.
From the information that he gathered from students who had taken the course, he
concluded that there was a 40% probability that the exam would be easy.
Referring to Table 19-6, what is the return-to-risk ratio of spending 8 hours per week on
average studying for the exam?
TABLE 17-5
You worked as an intern at We Always Win Car Insurance Company last summer. You
notice that individual car insurance premiums depend very much on the age of the
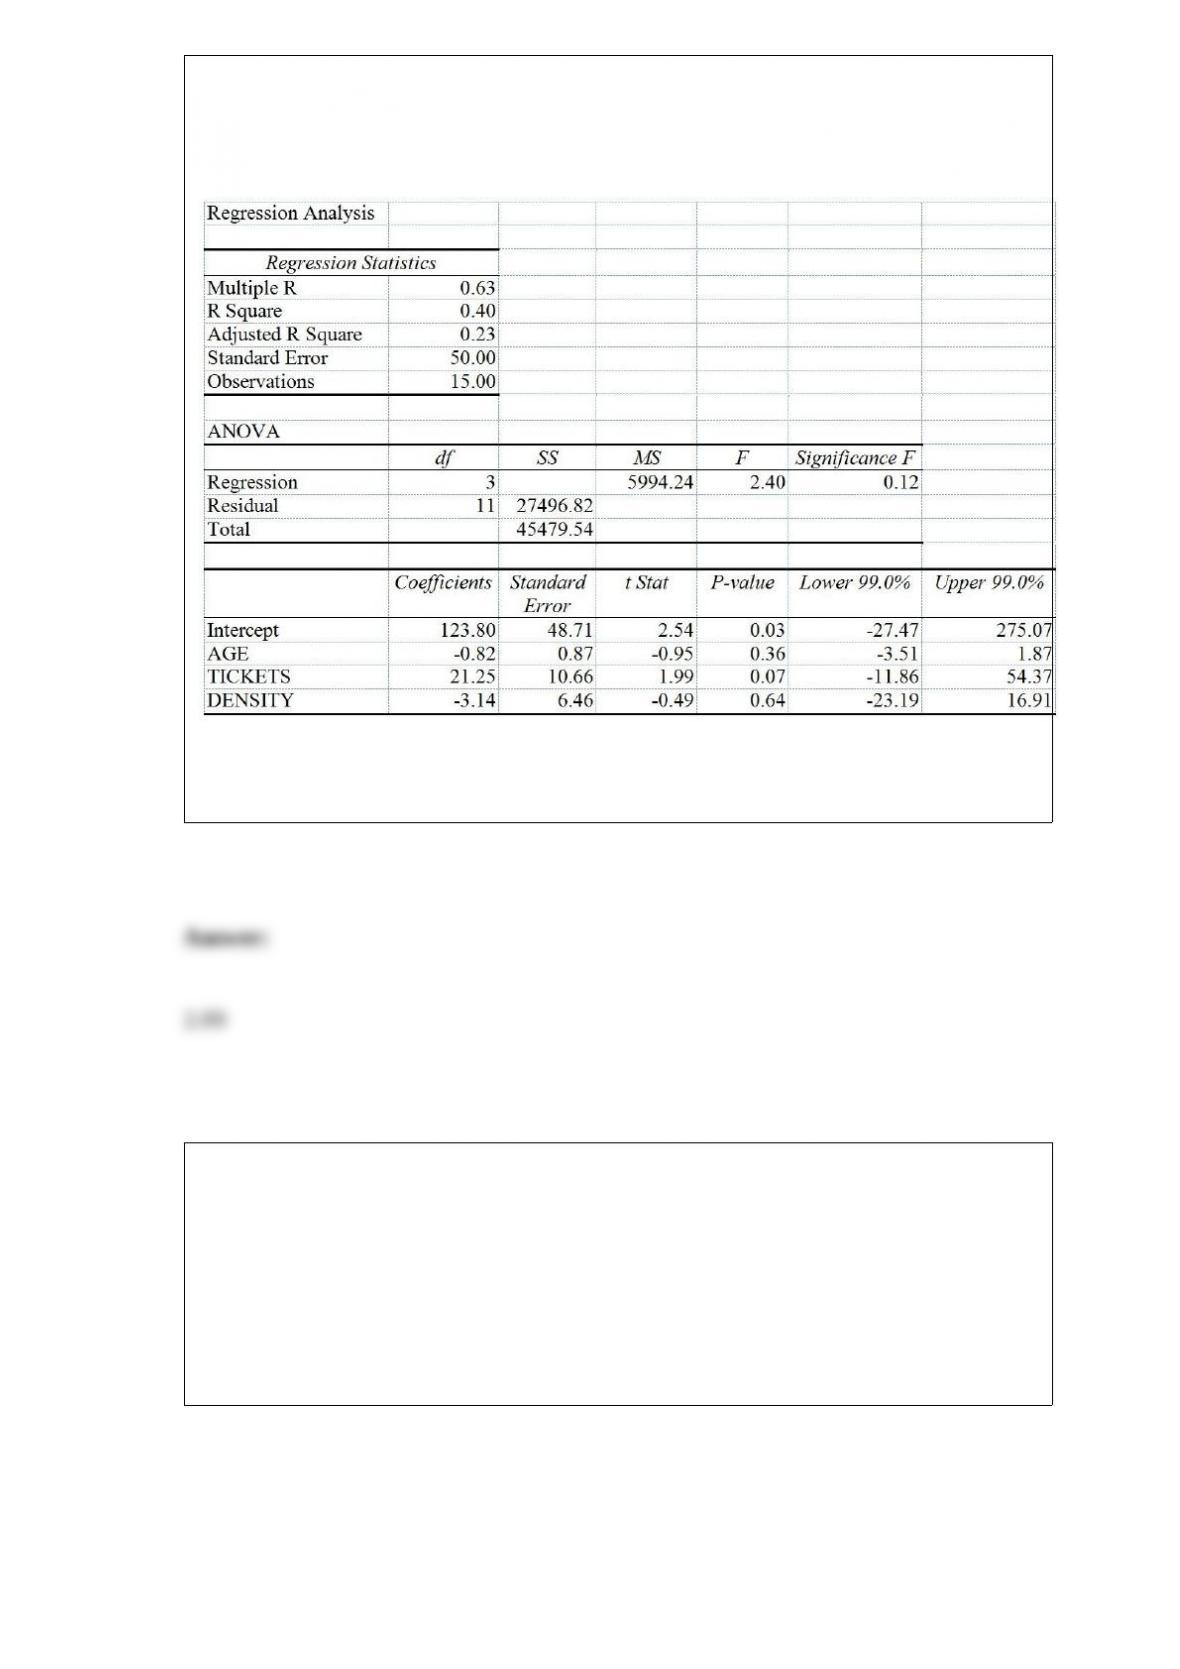
individual, the number of traffic tickets received by the individual, and the population
density of the city in which the individual lives. You performed a regression analysis in
EXCEL and obtained the following information:
Referring to Table 17-5, the 99% confidence interval for the change in mean insurance
premiums of a person who has become 1 year older (i.e., the slope coefficient for AGE)
is -0.82 ± ________.
TABLE 11-8
An important factor in selecting database software is the time required for a user to
learn how to use the system. To evaluate three potential brands (A, B and C) of database
software, a company designed a test involving five different employees. To reduce
variability due to differences among employees, each of the five employees is trained
on each of the three different brands. The amount of time (in hours) needed to learn
each of the three different brands is given below:
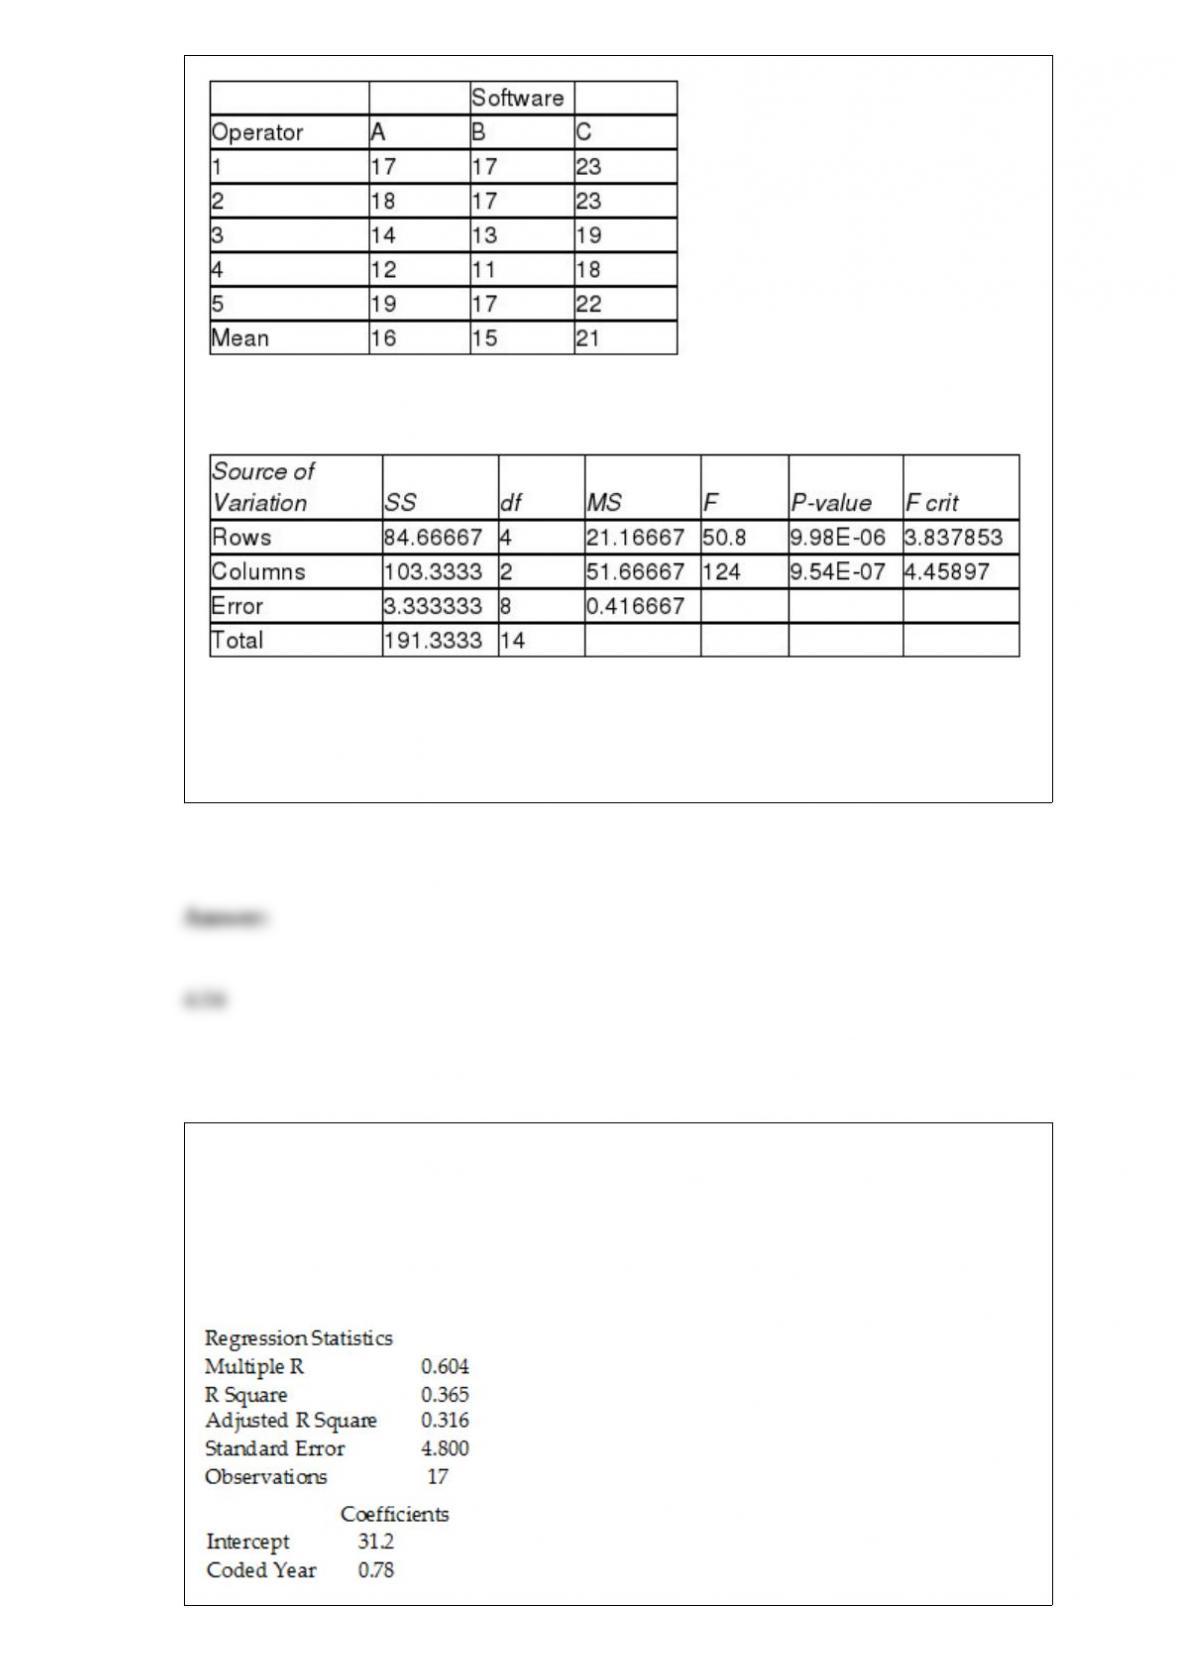
Below is the Excel output for the randomized block design:
Referring to Table 11-8, what is the upper-tail critical value of the Studentized range
distribution for the Tukey multiple comparison procedure at the 5% level of
significance?
TABLE 16-6
The president of a chain of department stores believes that her stores' total sales have
been showing a linear trend since 1993. She uses Microsoft Excel to obtain the partial
output below. The dependent variable is sales (in millions of dollars), while the
independent variable is coded years, where 1993 is coded as 0, 1994 is coded as 1, etc.
SUMMARY OUTPUT
Referring to Table 16-6, the forecast for sales (in millions of dollars) in 2015 is
________.
The Dean of Students conducted a survey on campus. Number of clubs, groups, teams,
and organizations affiliated with on campus is an example of a ________ numerical
variable.
Referring to Table 14-7, the department head decided to construct a
95% confidence interval for β1. The confidence interval is from
________ to ________.
TABLE 14-7
The department head of the accounting department wanted to see if
she could predict the GPA of students using the number of course
units (credits) and total SAT scores of each. She takes a sample of
students and generates the following Microsoft Excel output: