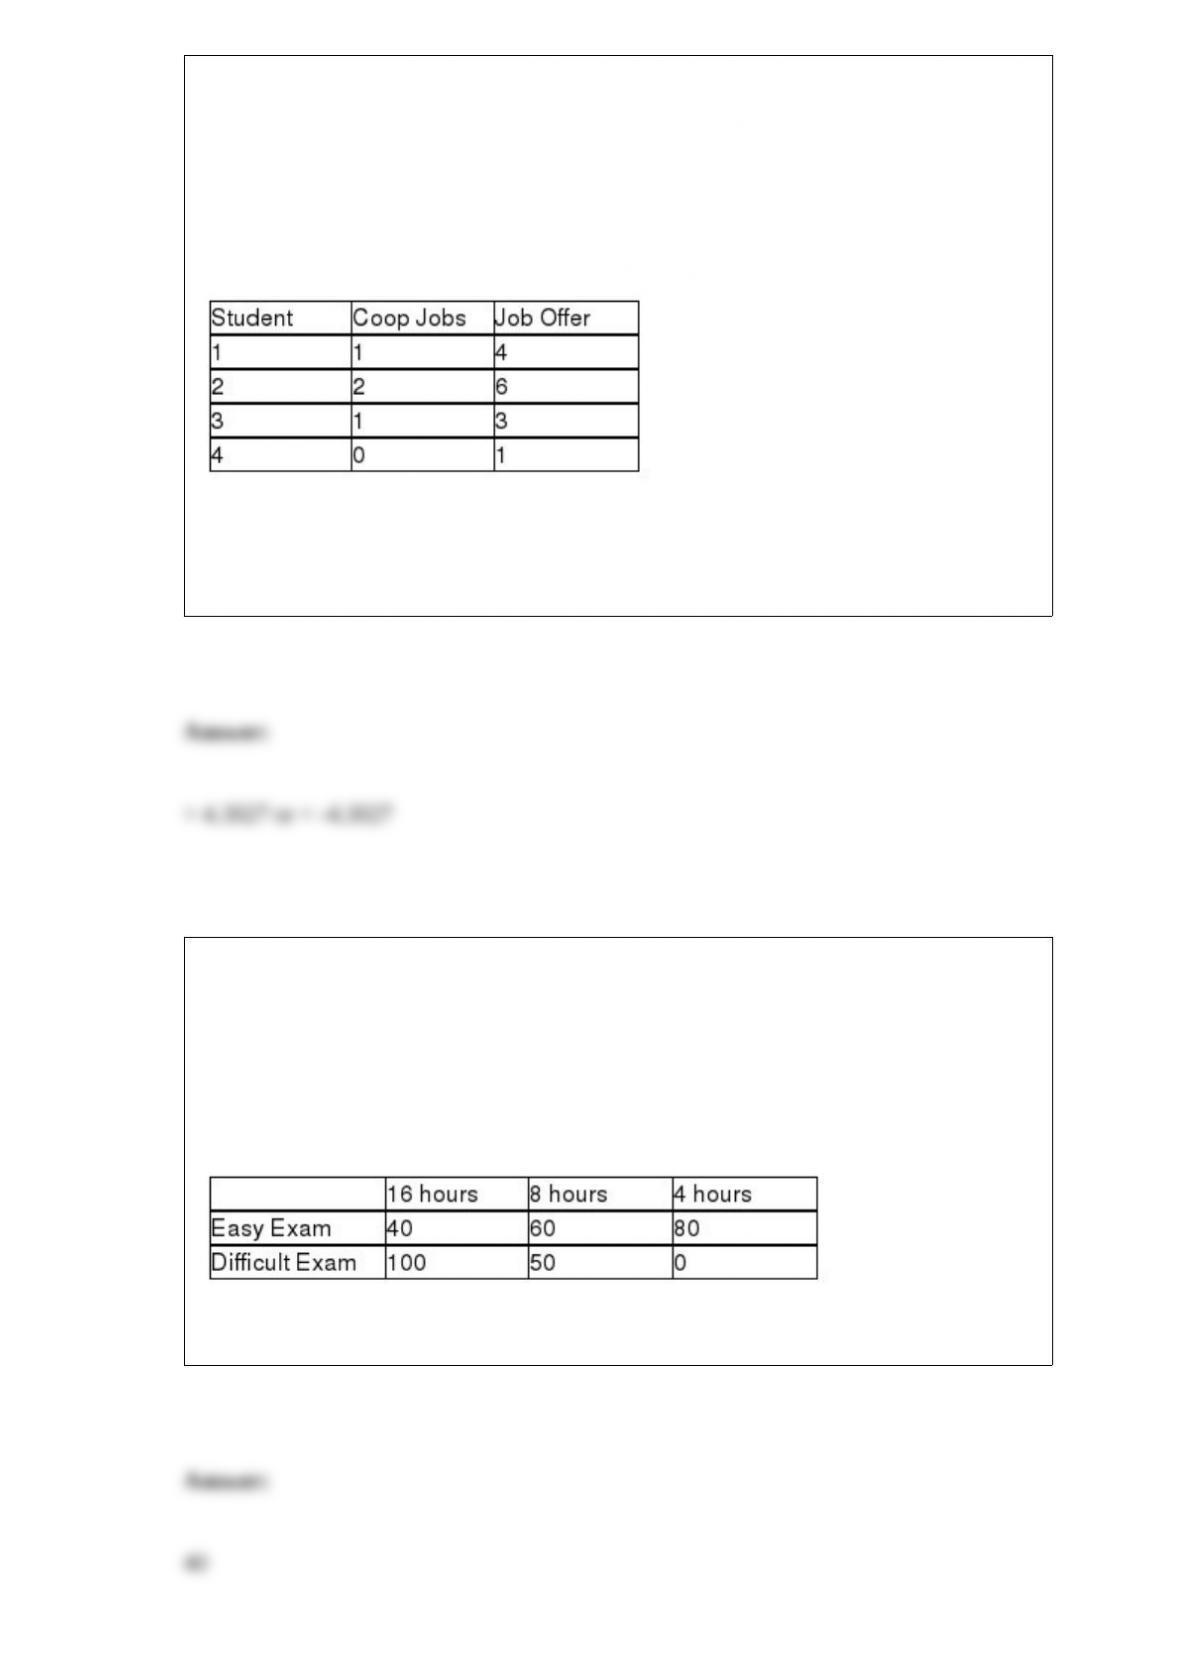
TABLE 13-3
The director of cooperative education at a state college wants to examine the effect of
cooperative education job experience on marketability in the work place. She takes a
random sample of 4 students. For these 4, she finds out how many times each had a
cooperative education job and how many job offers they received upon graduation.
These data are presented in the table below.
Referring to Table 13-3, the director of cooperative education wanted to test the
hypothesis that the population slope was equal to 3.0. For a test with a level of
significance of 0.05, the null hypothesis should be rejected if the value of the test
statistic is ________.
TABLE 19-6
A student wanted to find out the optimal strategy to study for a Business Statistics
exam. He constructed the following payoff table based on the mean amount of time he
needed to study every week for the course and the degree of difficulty of the exam.
From the information that he gathered from students who had taken the course, he
concluded that there was a 40% probability that the exam would be easy.
Referring to Table 19-6, what is the opportunity loss of spending 16 hours per week on
average studying for the exam when the exam turns out to be easy?

TABLE 4-9
A survey conducted by the Segal Company of New York found that in a sample of 189
large companies, 40 offered stock options to their board members as part of their
noncash compensation packages. For small- to mid-sized companies, 43 of the 180
surveyed indicated that they offer stock options as part of their noncash compensation
packages to their board members.
Referring to Table 4-9, if a company is selected at random, what is the probability that
the company is small to mid-sized and did not offer stock options to their board
members?
The amount of time necessary for assembly line workers to complete a product is a
normal variable with a mean of 15 minutes and a standard deviation of 2 minutes. So,
17% of the products would be assembled within ________ minutes.
The interval between patients arriving at an outpatient clinic follows an exponential
distribution at a rate of 15 patients per hour. What is the probability that a randomly
chosen arrival interval will be less than 15 minutes?
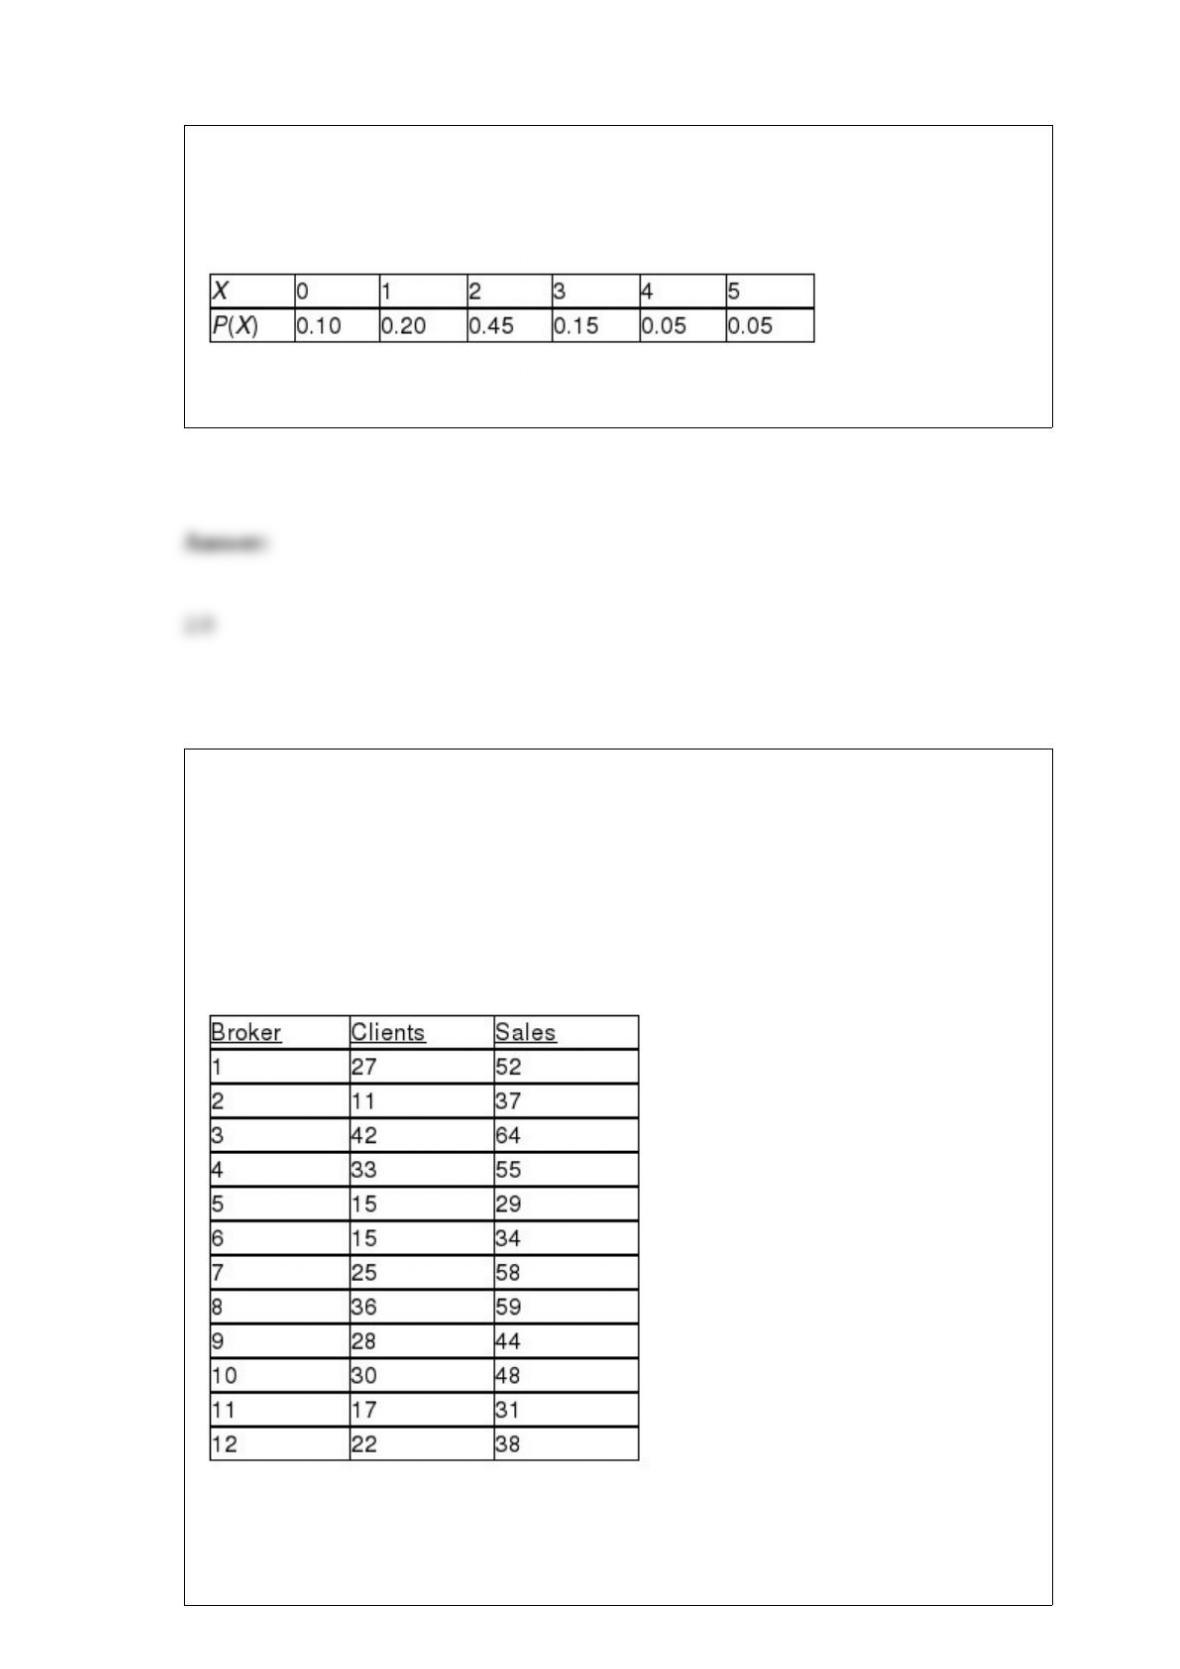
TABLE 5-4
The following table contains the probability distribution for X = the number of traffic
accidents reported in a day in Corvallis, Oregon.
Referring to Table 5-4, the mean or expected value of the number of accidents is
________.
TABLE 13-4
The managers of a brokerage firm are interested in finding out if the number of new
clients a broker brings into the firm affects the sales generated by the broker. They
sample 12 brokers and determine the number of new clients they have enrolled in the
last year and their sales amounts in thousands of dollars. These data are presented in the
table that follows.
Referring to Table 13-4, suppose the managers of the brokerage firm want to construct
both a 99% confidence interval estimate and a 99% prediction interval for X = 24. The
confidence interval estimate would be the ________ (‘wider’ or ‘narrower’) of the two
intervals.

TABLE 3-7
In a recent academic year, many public universities in the United States raised tuition
and fees due to a decrease in state subsidies. The change in the cost of tuition, a shared
dormitory room, and the most popular meal plan from the previous academic year for a
sample of 10 public universities were as follows: $1,589, $593, $1,223, $869, $423,
$1,720, $708, $1,425, $922 and $308.
Referring to Table 3-7, what is the coefficient of variation of the change in cost?