TABLE 8-2
A quality control engineer is interested in the mean length of sheet insulation being cut
automatically by machine. The desired mean length of the insulation is 12 feet. It is
known that the standard deviation in the cutting length is 0.15 feet. A sample of 70 cut
sheets yields a mean length of 12.14 feet. This sample will be used to obtain a 99%
confidence interval for the mean length cut by machine.
Referring to Table 8-2, the critical value to use in obtaining the confidence interval is
________.
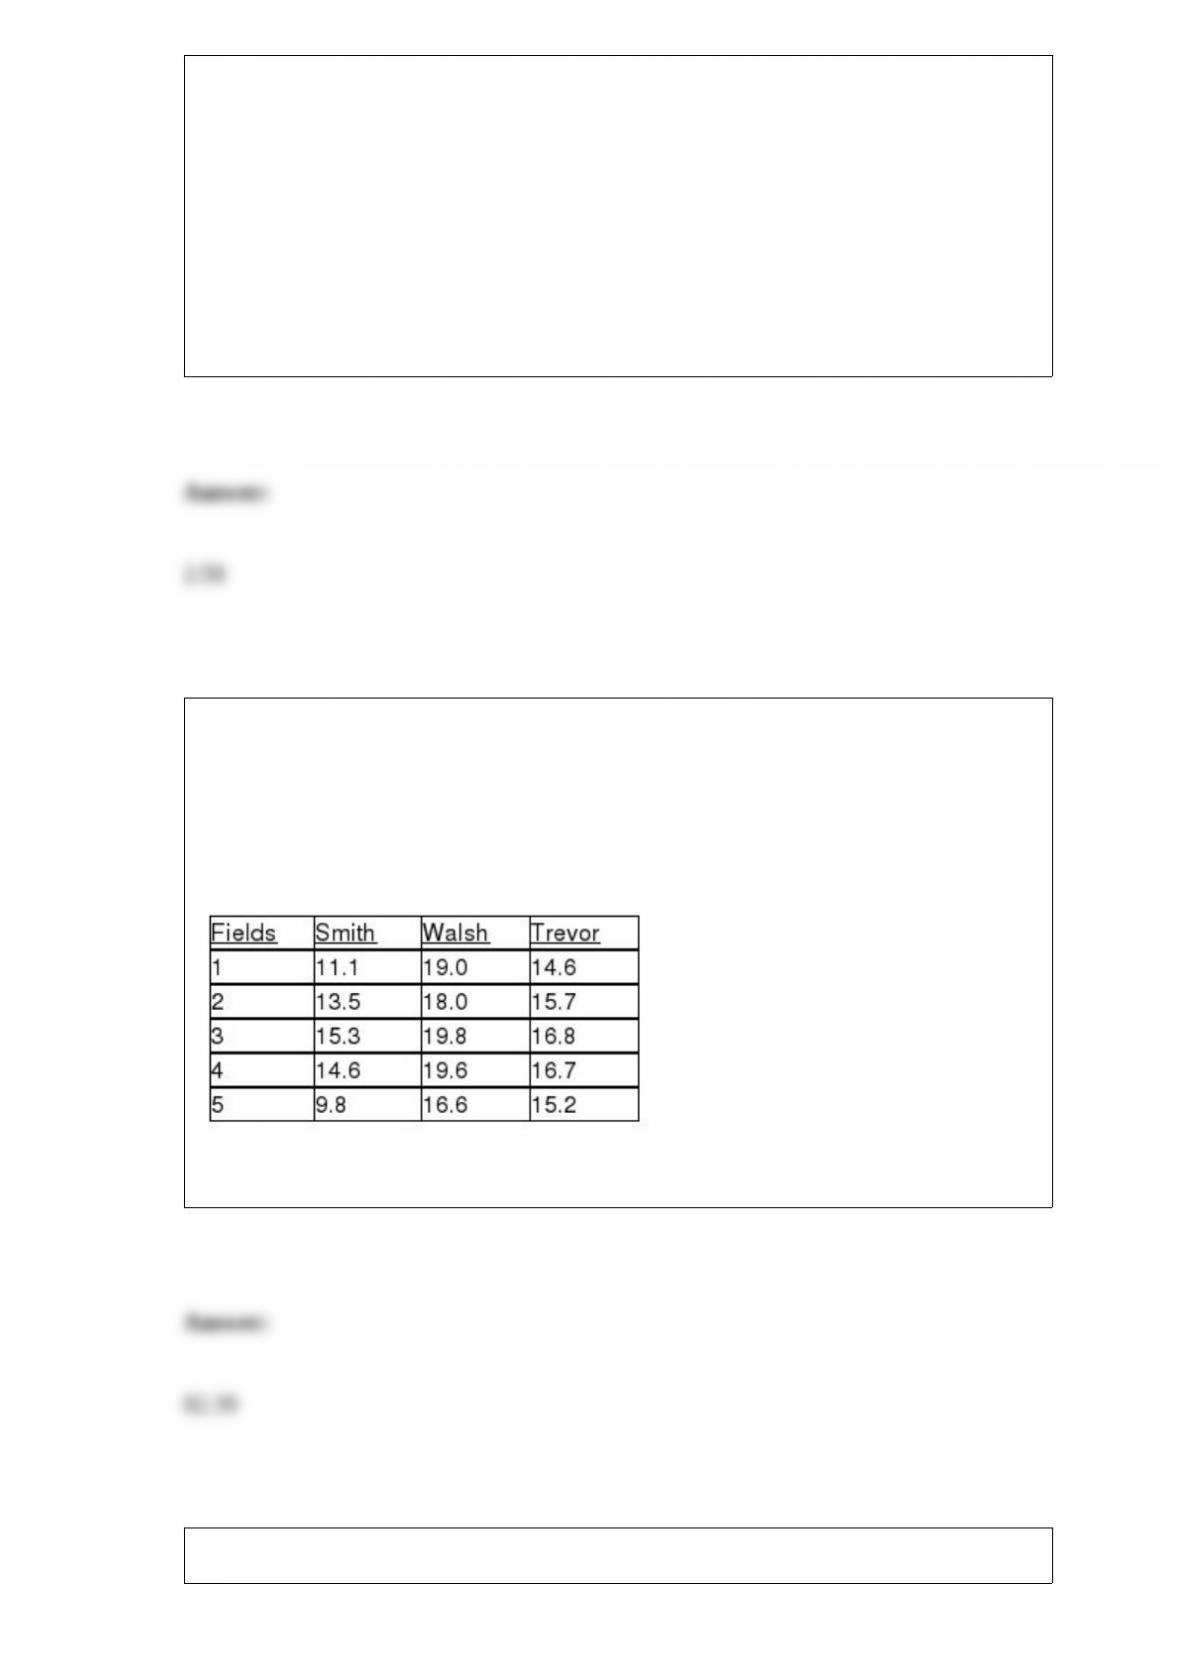
TABLE 11-10
An agronomist wants to compare the crop yield of 3 varieties of chickpea seeds. She
plants all 3 varieties of the seeds on each of 5 different patches of fields. She then
measures the crop yield in bushels per acre. Treating this as a randomized block design,
the results are presented in the table that follows.
Referring to Table 11-10, the among-group variation or SSA is ________.
TABLE 12-18

The director of transportation of a large company is interested in the usage of the
company’s van pool program. She surveyed 129 of her employees on the usage of the
program before and after a campaign to convince her employees to use the service and
obtained the following:
She will use this information to perform a test using a level of significance of 0.05.
Referring to Table 12-18, the director now wants to know if the proportion of
employees who use the service before the campaign and the proportion of employees
who use the service after the campaign are the same. What is the p-value of the test
statistic using a 5% level of significance?
Referring to Table 14-8, ________% of the variation in salary can be
explained by the variation in age while holding experience
constant.TABLE 14-8
A financial analyst wanted to examine the relationship between salary
(in $1,000) and 2 variables: age
(X1 = Age) and experience in the field (X2 = Exper). He took a sample
of 20 employees and obtained the following Microsoft Excel output:

Also, the sum of squares due to the regression for the model that
includes only Age is 5022.0654 while the sum of squares due to the
regression for the model that includes only Exper is 125.9848.
TABLE 17-9
What are the factors that determine the acceleration time (in sec.) from 0 to 60 miles per
hour of a car? Data on the following variables for 171 different vehicle models were
collected:
Accel Time: Acceleration time in sec.
Cargo Vol: Cargo volume in cu. ft.
HP: Horsepower
MPG: Miles per gallon
SUV: 1 if the vehicle model is an SUV with Coupe as the base when SUV and Sedan
are both 0
Sedan: 1 if the vehicle model is a sedan with Coupe as the base when SUV and Sedan
are both 0
The regression results using acceleration time as the dependent variable and the
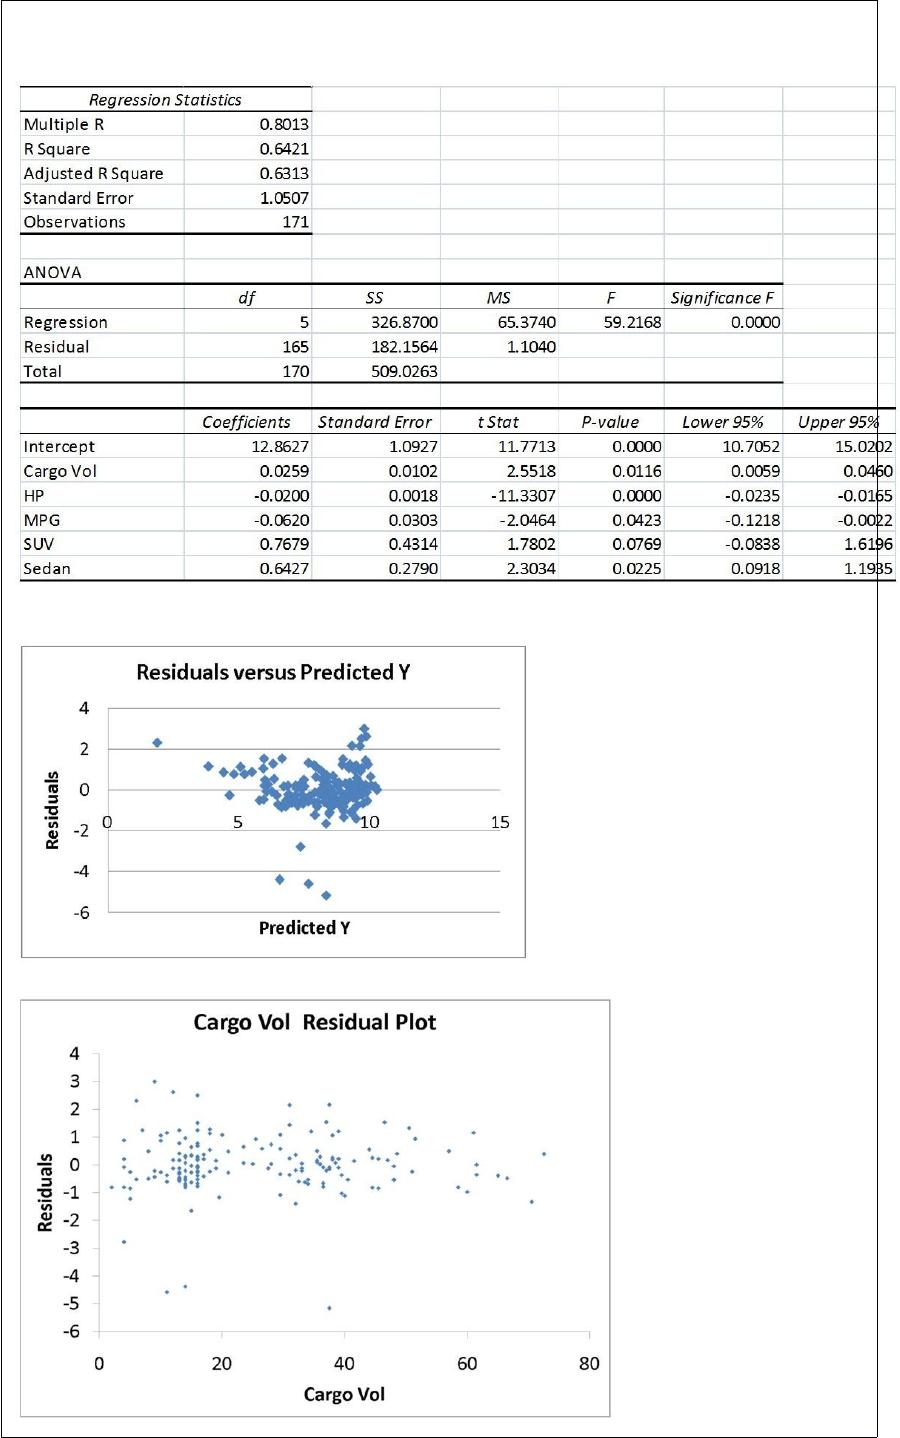
remaining variables as the independent variables are presented below.
The various residual plots are as shown below.
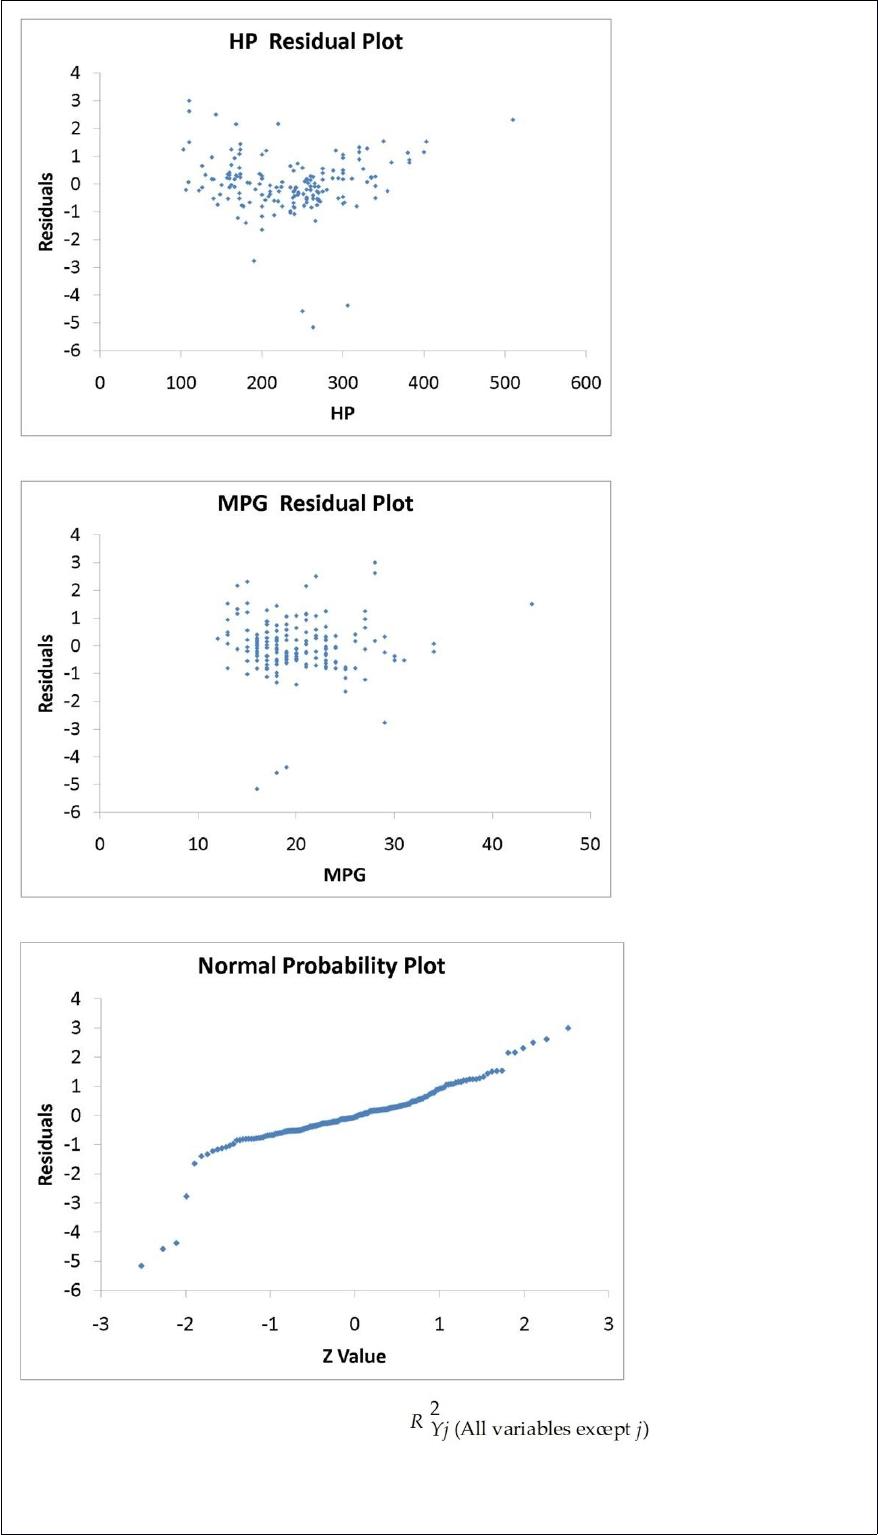
The coefficient of partial determination ( ) of each of the 5
predictors are, respectively, 0.0380, 0.4376, 0.0248, 0.0188, and 0.0312.
The coefficient of multiple determination for the regression model using each of the 5
variables Xj as the dependent variable and all other X variables as independent variables
( ) are, respectively, 0.7461, 0.5676, 0.6764, 0.8582, 0.6632.
Referring to Table 17-9, what is the p-value of the test statistic to determine whether HP
makes a significant contribution to the regression model in the presence of the other
independent variables at a 5% level of significance?
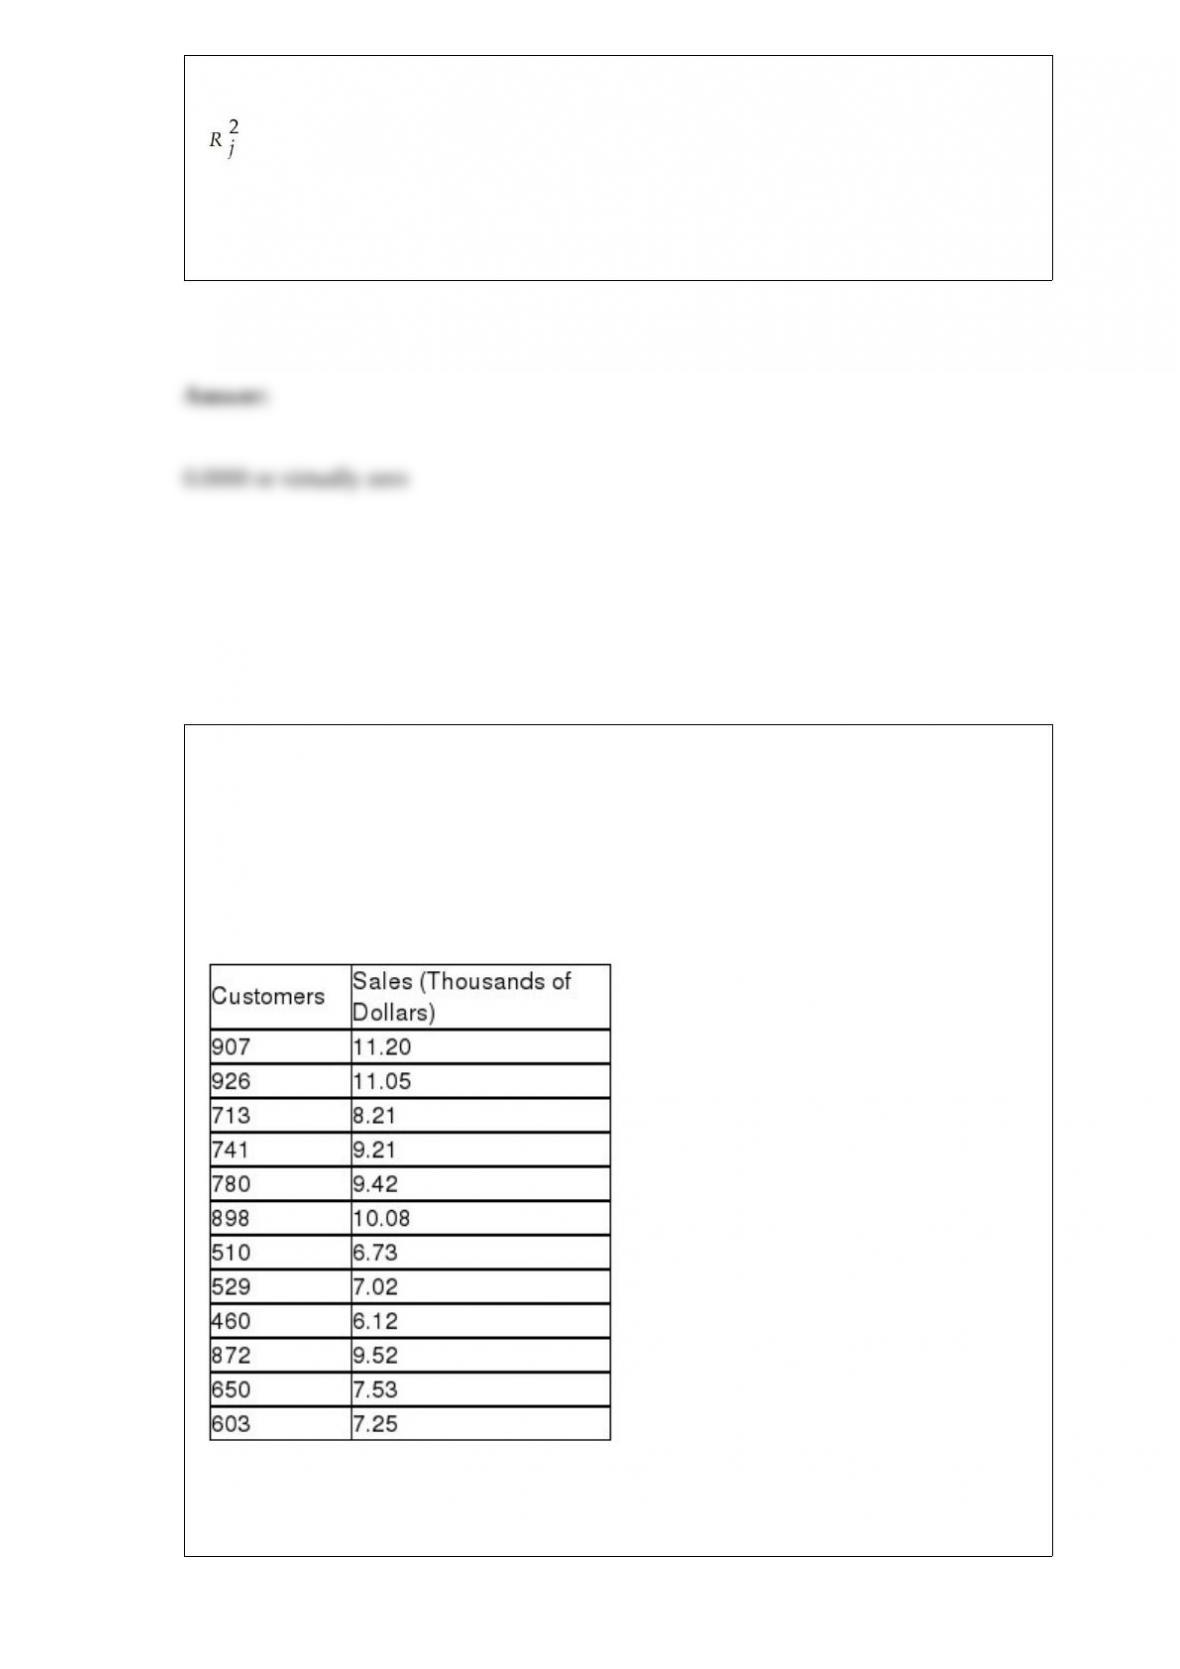
TABLE 13-10
The management of a chain electronic store would like to develop a model for
predicting the weekly sales (in thousands of dollars) for individual stores based on the
number of customers who made purchases. A random sample of 12 stores yields the
following results:
Referring to Table 13-10, construct a 95% confidence interval for the change in mean
weekly sales when the number of customers who make purchases increases by one.