True or False: The sample mean is an unbiased estimate of the population mean.
True or False: You can compute any of the numerical descriptive statistics for the
variables of the new worksheet that a drill-down in a PivotTable creates.
True or False: TABLE 17-8
The superintendent of a school district wanted to predict the percentage of students
passing a sixth-grade proficiency test. She obtained the data on percentage of students
passing the proficiency test (% Passing), daily mean of the percentage of students
attending class (% Attendance), mean teacher salary in dollars (Salaries), and
instructional spending per pupil in dollars (Spending) of 47 schools in the state.
Following is the multiple regression output with Y = % Passing as the dependent
variable, X1 = % Attendance, X2 = Salaries and X3 = Spending:
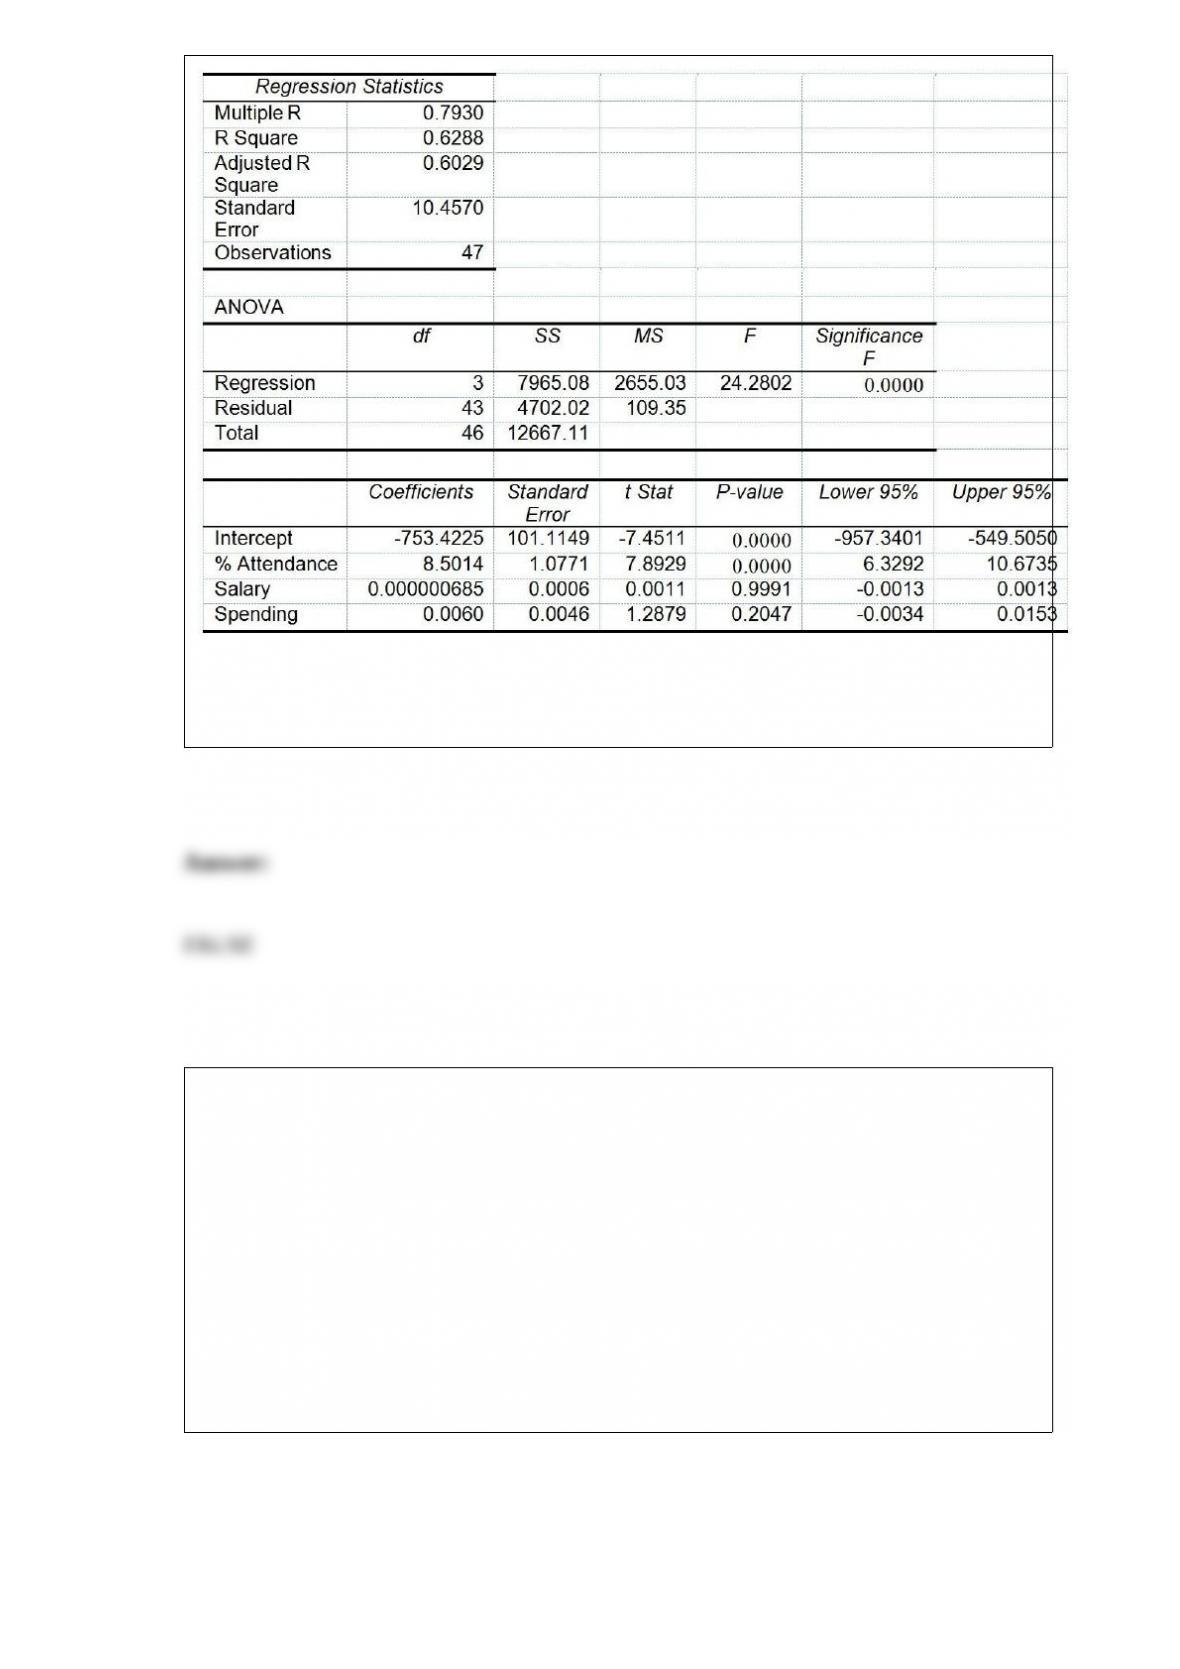
Referring to Table 17-8, the alternative hypothesis H1 : At least one of βj ≠0 for j =
1, 2, 3 implies that the percentage of students passing the proficiency test is affected by
all of the explanatory variables.
TABLE 14-15
The superintendent of a school district wanted to predict the
percentage of students passing a sixth-grade proficiency test. She
obtained the data on percentage of students passing the proficiency
test (% Passing), mean teacher salary in thousands of dollars
(Salaries), and instructional spending per pupil in thousands of dollars
(Spending) of 47 schools in the state.
Following is the multiple regression output with Y = % Passing as the
dependent variable, X1 = Salaries and X2 = Spending:

True or False: Referring to Table 14-15, the alternative hypothesis H1 :
At least one of βj ≠0 for j = 1, 2 implies that percentage of
students passing the proficiency test is affected by both of the
explanatory variables.
True or False: As a general rule, a value is considered an extreme value if its Z score is
less than -3.
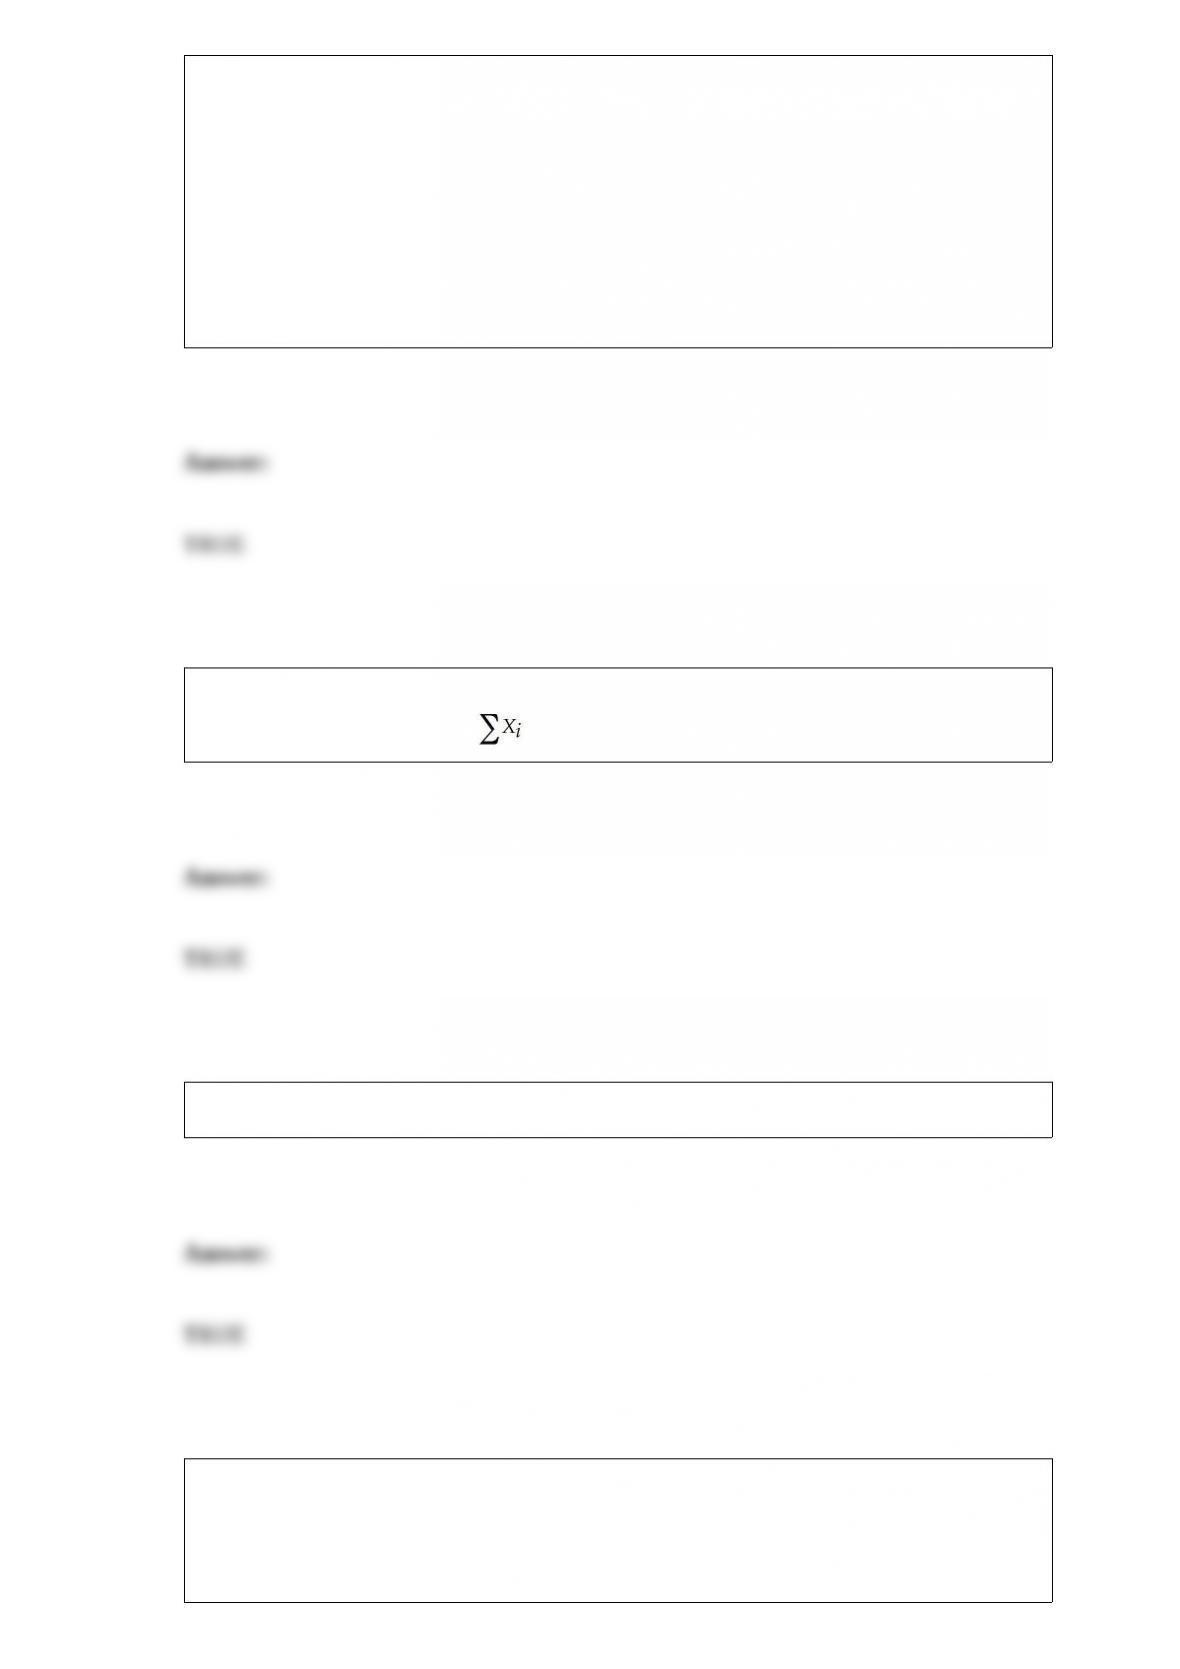
TABLE 8-15
The president of a university is concerned that illicit drug use on campus is higher than
the 5% targeted level. A random sample of 250 students from a population of 2,000
revealed that 7 of them had used illicit drugs during the last 12 months.
True or False: Referring to Table 8-15, the president can be 90% confident that no more
than 5% of the students at the university had used illicit drugs during the last 12
months.
True or False: In a sample size of 40, the sample mean is 15. In this case, the sum of all
observations in the sample is = 600.
True or False: When r = -1, it indicates a perfect relationship between X and Y.
True or False: TABLE 17-9
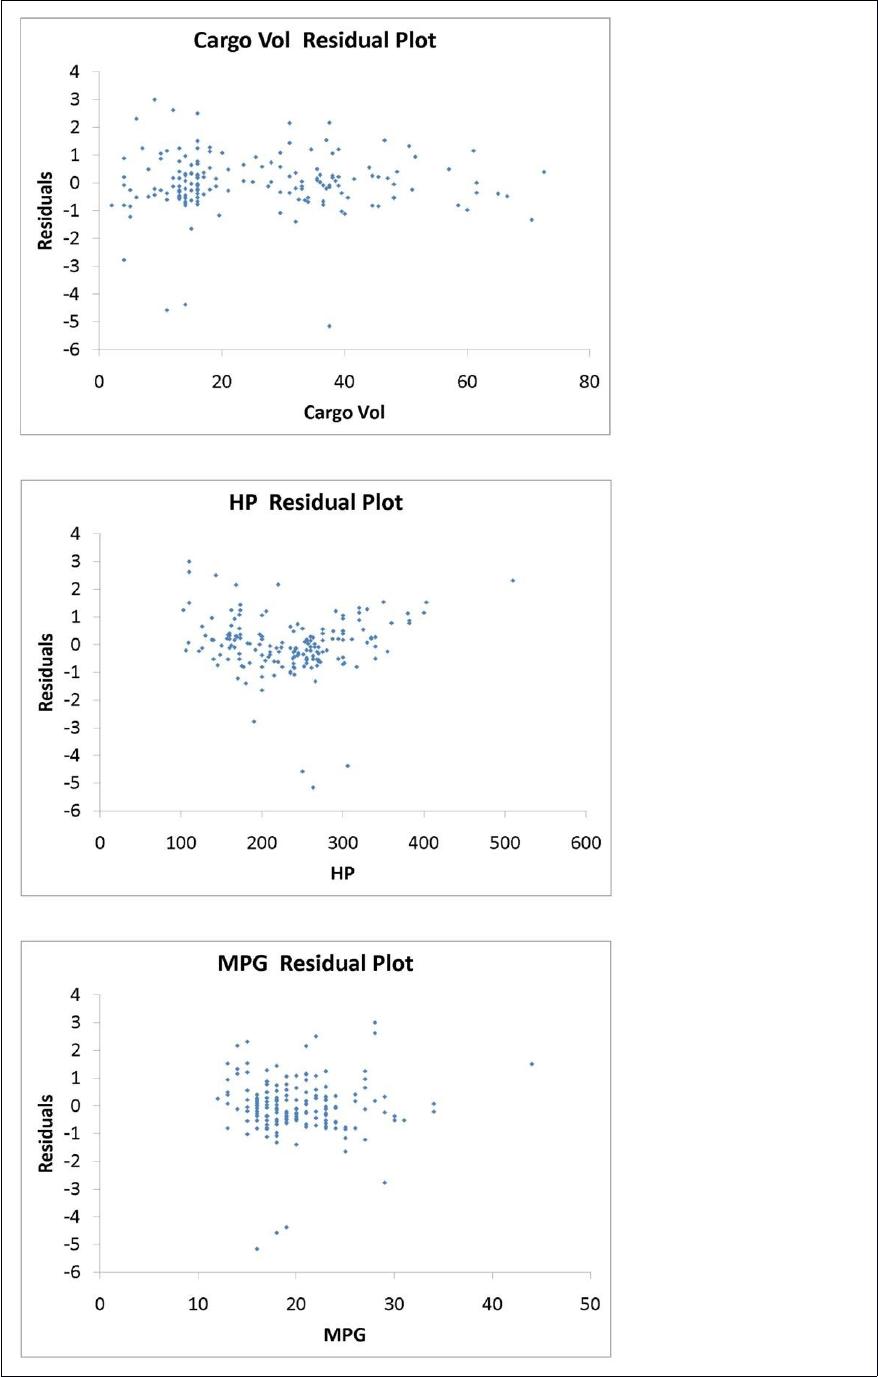
What are the factors that determine the acceleration time (in sec.) from 0 to 60 miles per
hour of a car? Data on the following variables for 171 different vehicle models were
collected:
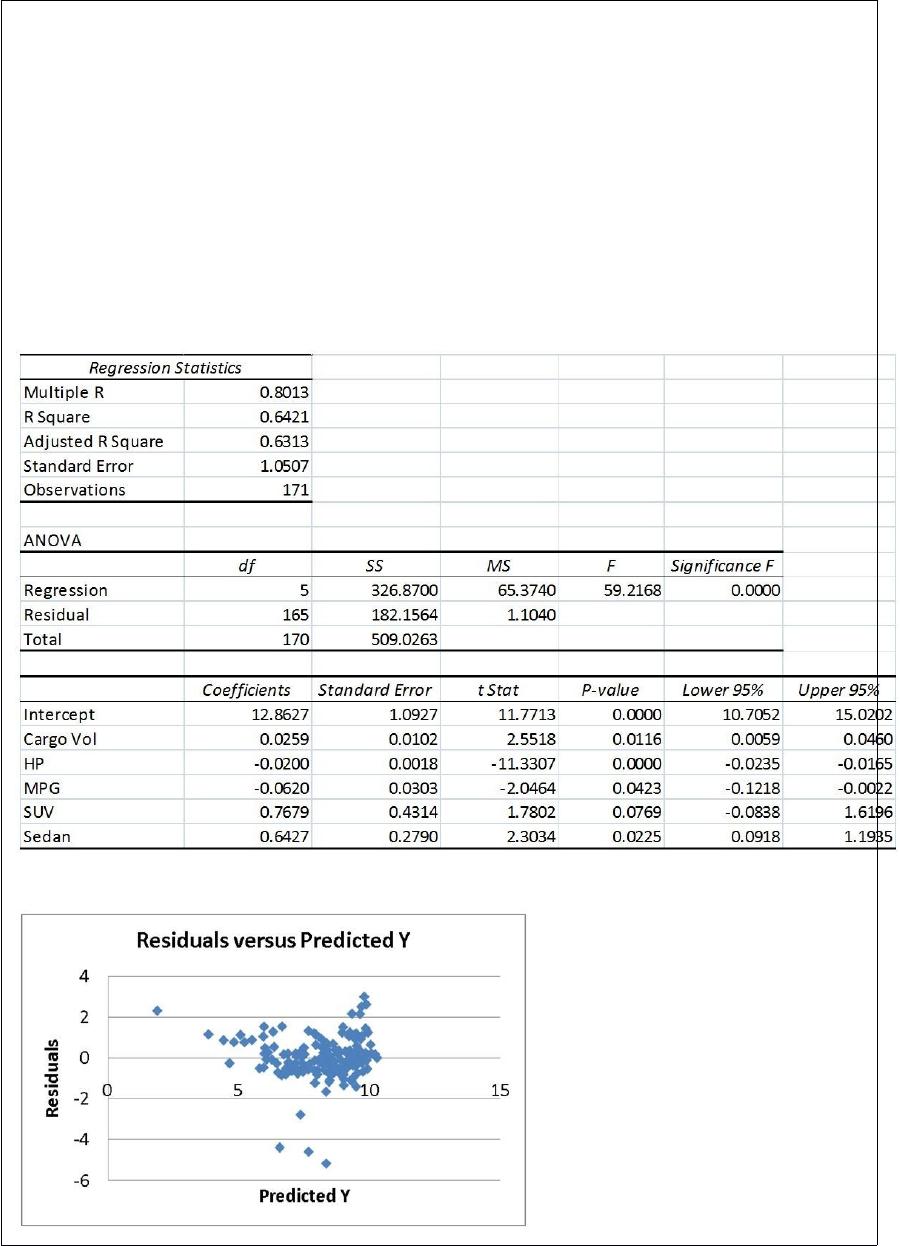
Accel Time: Acceleration time in sec.
Cargo Vol: Cargo volume in cu. ft.
HP: Horsepower
MPG: Miles per gallon
SUV: 1 if the vehicle model is an SUV with Coupe as the base when SUV and Sedan
are both 0
Sedan: 1 if the vehicle model is a sedan with Coupe as the base when SUV and Sedan
are both 0
The regression results using acceleration time as the dependent variable and the
remaining variables as the independent variables are presented below.
The various residual plots are as shown below.
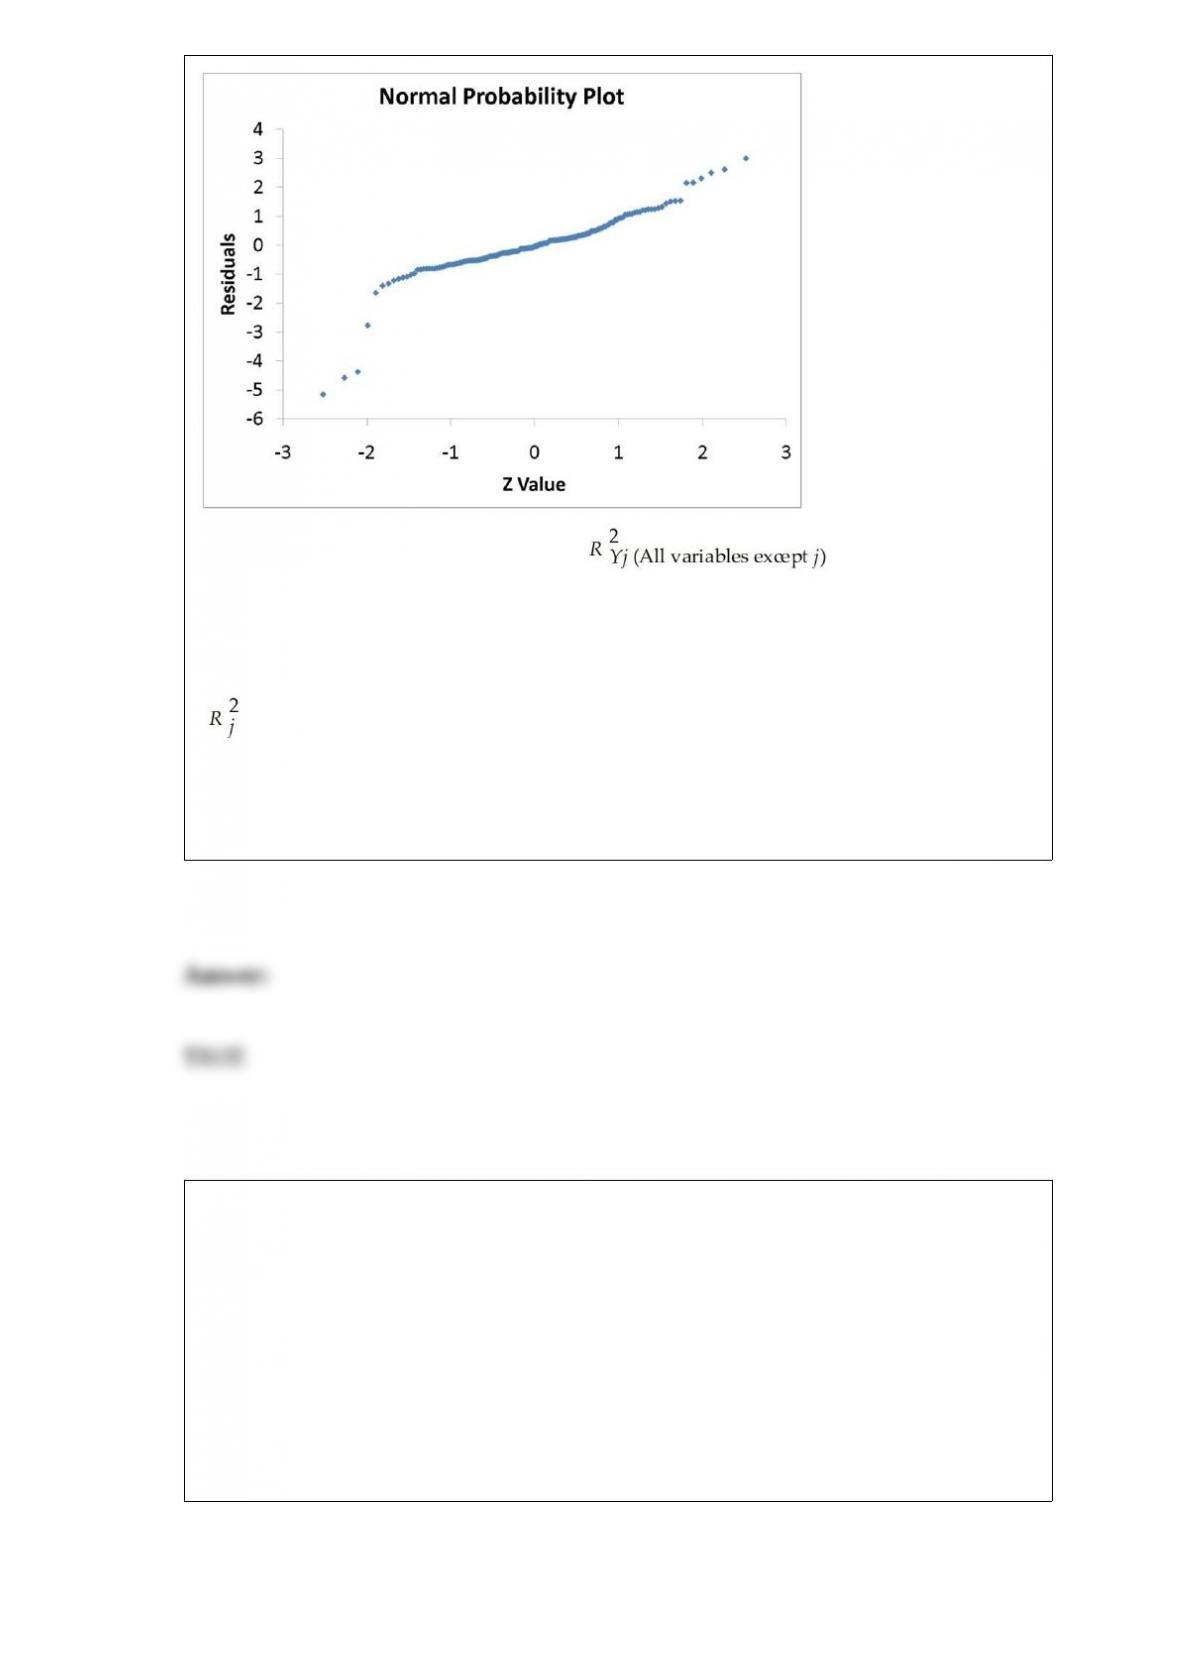
The coefficient of partial determination ( ) of each of the 5
predictors are, respectively, 0.0380, 0.4376, 0.0248, 0.0188, and 0.0312.
The coefficient of multiple determination for the regression model using each of the 5
variables Xj as the dependent variable and all other X variables as independent variables
( ) are, respectively, 0.7461, 0.5676, 0.6764, 0.8582, 0.6632.
Referring to Table 17-9, there is enough evidence to conclude that MPG makes a
significant contribution to the regression model in the presence of the other independent
variables at a 5% level of significance.
TABLE 8-2
A quality control engineer is interested in the mean length of sheet insulation being cut
automatically by machine. The desired mean length of the insulation is 12 feet. It is
known that the standard deviation in the cutting length is 0.15 feet. A sample of 70 cut
sheets yields a mean length of 12.14 feet. This sample will be used to obtain a 99%
confidence interval for the mean length cut by machine.
True or False: Referring to Table 8-2, the confidence interval is valid only if the lengths
cut are normally distributed.
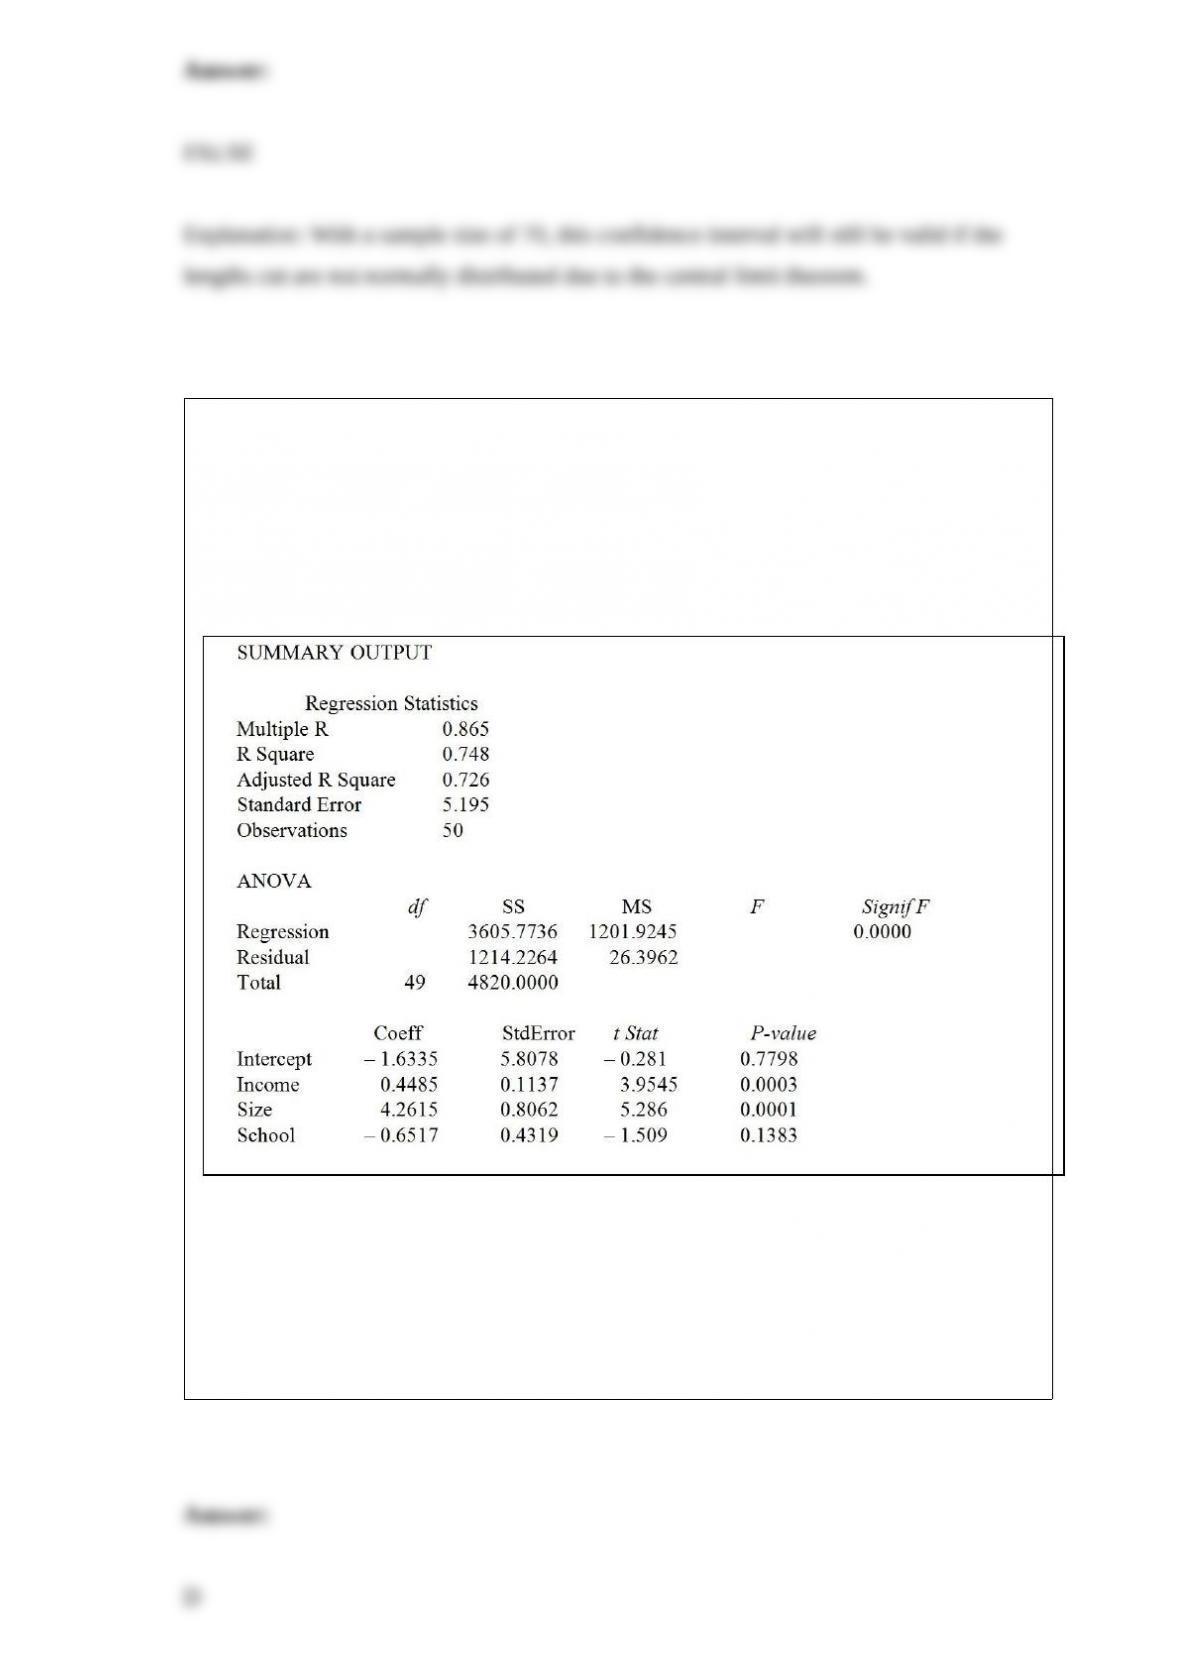
TABLE 17-1
A real estate builder wishes to determine how house size (House) is influenced by
family income (Income), family size (Size), and education of the head of household
(School). House size is measured in hundreds of square feet, income is measured in
thousands of dollars, and education is in years. The builder randomly selected 50
families and ran the multiple regression. Microsoft Excel output is provided below:
Referring to Table 17-1, what minimum annual income would an individual with a
family size of 4 and 16 years of education need to attain a predicted 10,000 square foot
home (House = 100)?
A) $44.14 thousand
B) $56.75 thousand
C) $178.33 thousand
D) $211.85 thousand

TABLE 9-9
The president of a university claimed that the entering class this year appeared to be
larger than the entering class from previous years but their mean SAT score is lower
than previous years. He took a sample of 20 of this year’s entering students and found
that their mean SAT score is 1,501 with a standard deviation of 53. The university’s
record indicates that the mean SAT score for entering students from previous years is
1,520. He wants to find out if his claim is supported by the evidence at a 5% level of
significance.
Referring to Table 9-9, the population the president is interested in is
A) all entering students to all universities in the United States this year.
B) all entering students to his university this year.
C) all SAT test centers in the United States this year.
D) the SAT scores of all students entering universities in the United States this year.
In a multiple regression model, the adjusted r2
A) cannot be negative.
B) can sometimes be negative.
C) can sometimes be greater than +1.
D) has to fall between 0 and +1.
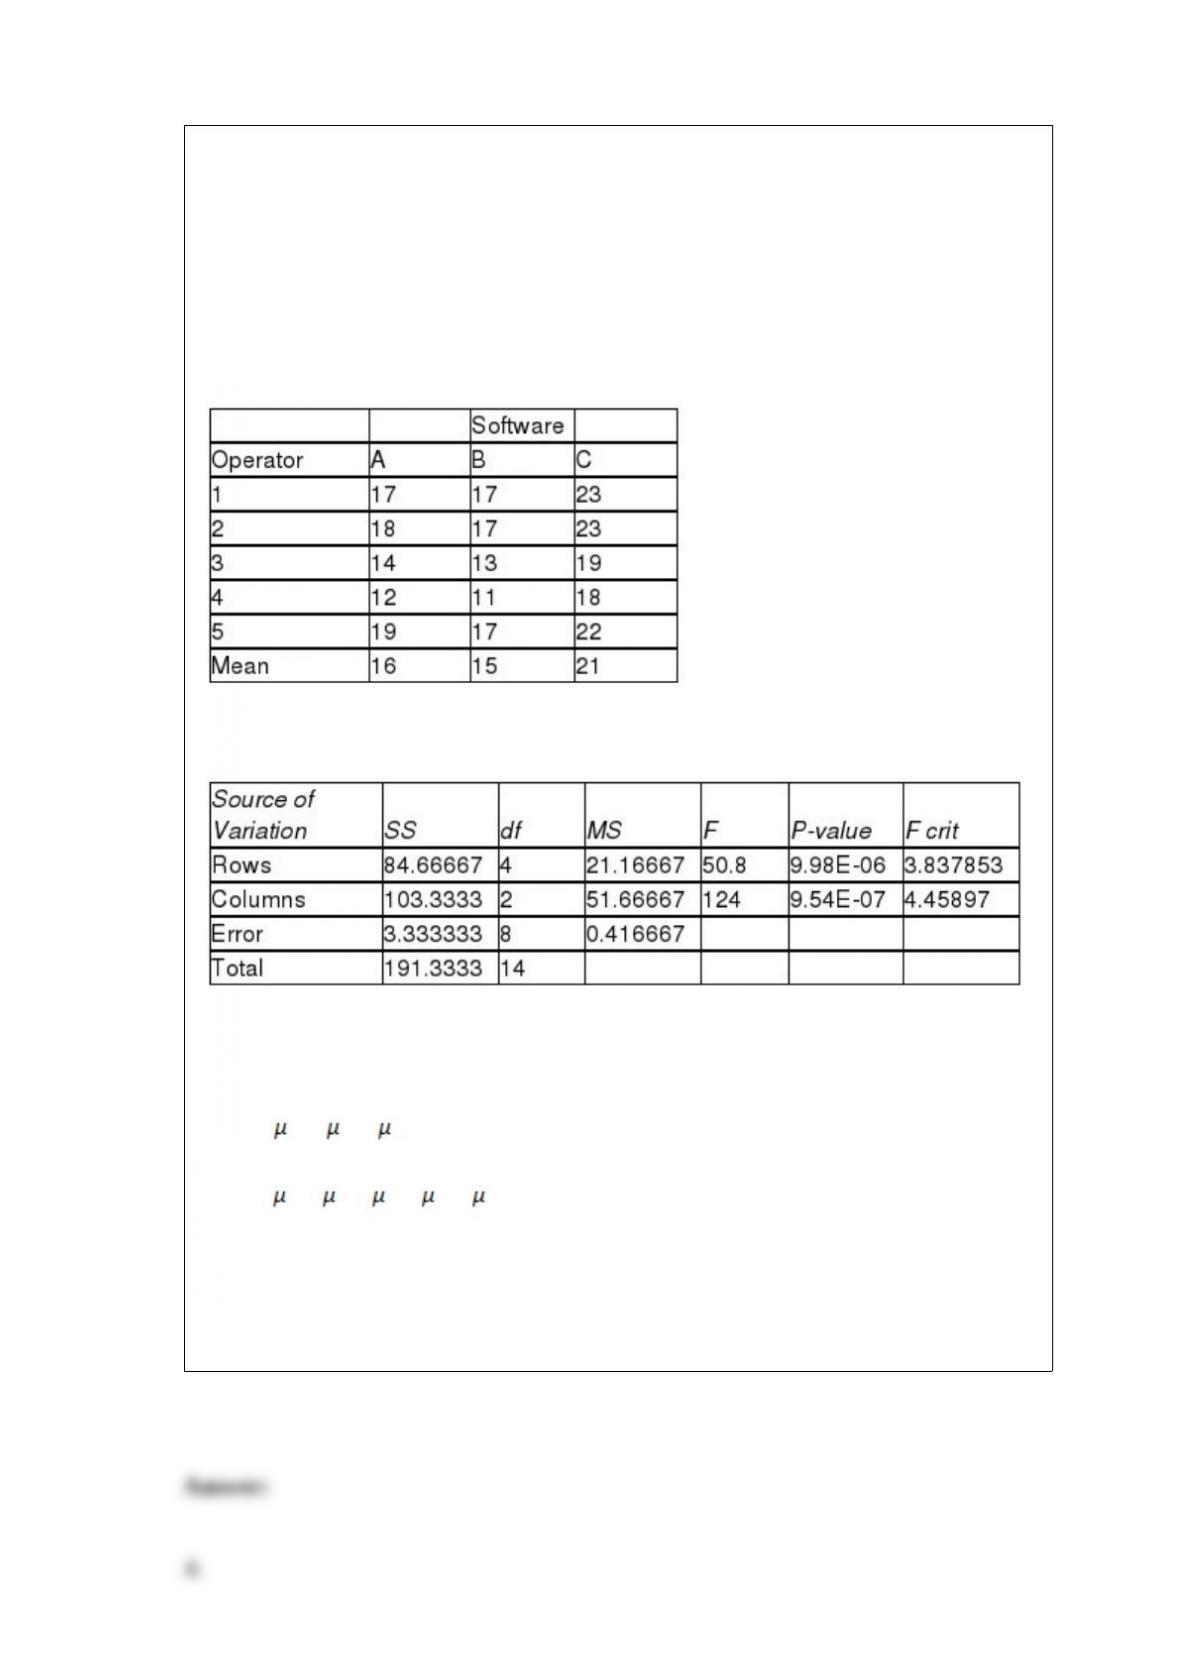
TABLE 11-8
An important factor in selecting database software is the time required for a user to
learn how to use the system. To evaluate three potential brands (A, B and C) of database
software, a company designed a test involving five different employees. To reduce
variability due to differences among employees, each of the five employees is trained
on each of the three different brands. The amount of time (in hours) needed to learn
each of the three different brands is given below:
Below is the Excel output for the randomized block design:
Referring to Table 11-8, the null hypothesis for the randomized block F test for the
difference in the means is
A) H0 : A = B = C
B) H0 : 1 = 2 = 3 = 4 = 5
C) H0 : MA = MB = MC
D) H0 : M1 = M2 = M3 = M4 = M5
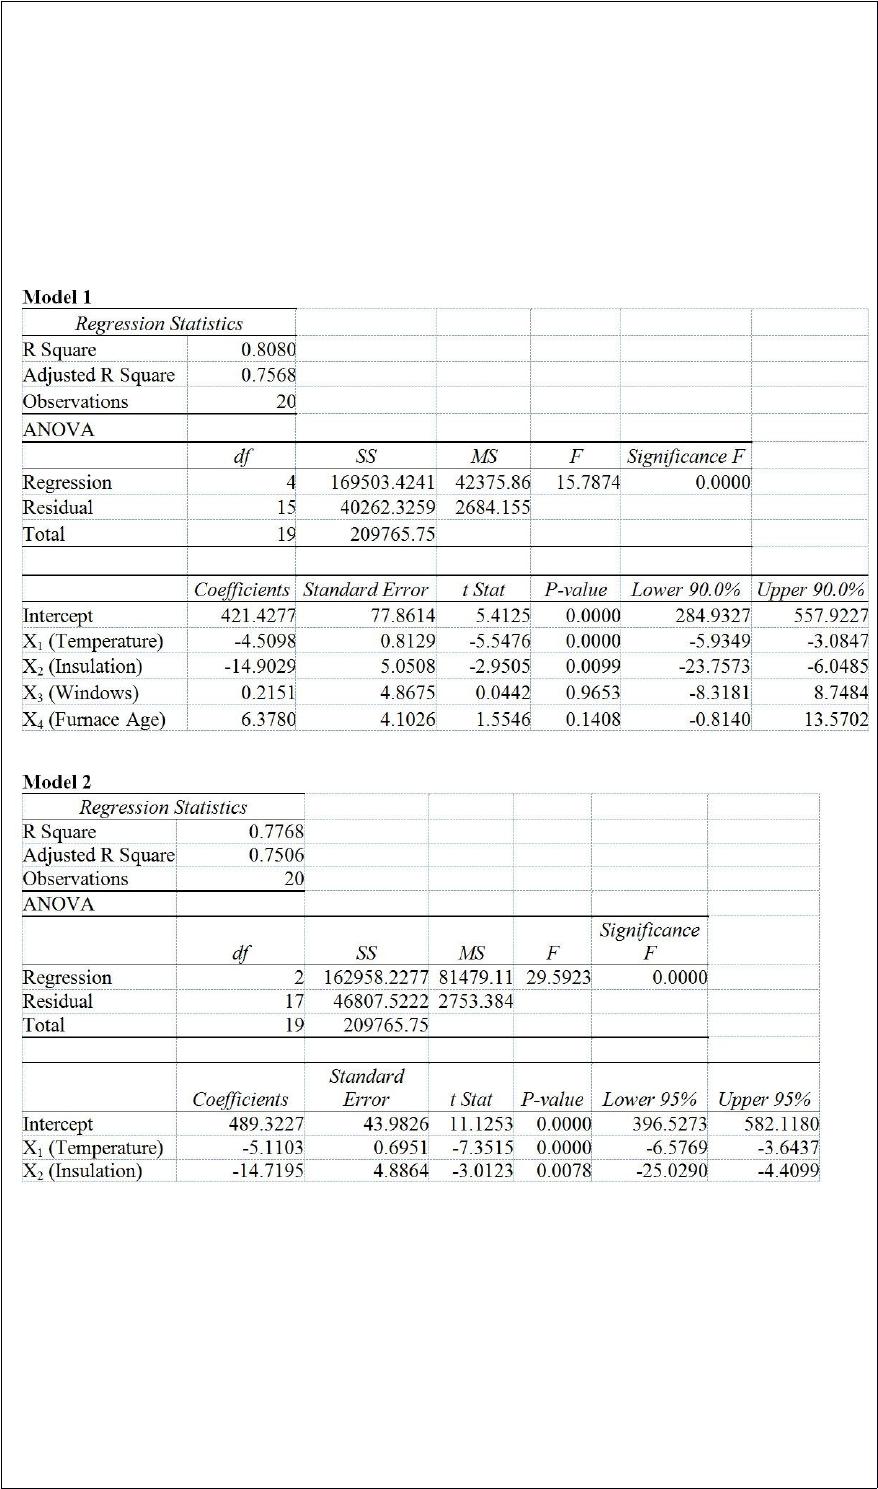
TABLE 17-2
One of the most common questions of prospective house buyers pertains to the cost of
heating in dollars (Y). To provide its customers with information on that matter, a large
real estate firm used the following 4 variables to predict heating costs: the daily
minimum outside temperature in degrees of Fahrenheit (X1), the amount of insulation in
inches (X2), the number of windows in the house (X3), and the age of the furnace in
years (X4). Given below are the EXCEL outputs of two regression models.
Referring to Table 17-2 and allowing for a 1% probability of committing a type I error,
what is the decision and conclusion for the test H0 : β1 = β2 = β3 = β4 = 0 vs. H1 : At
least one βj ≠0, j = 1, 2, …, 4 using Model 1?
A) Do not reject H0 and conclude that the 4 independent variables have significant
individual linear effects on heating costs.
B) Reject H0 and conclude that the 4 independent variables taken as a group have
significant linear effects on heating costs.
C) Do not reject H0 and conclude that the 4 independent variables taken as a group do

not have significant linear effects on heating costs.
D) Reject H0 and conclude that the 4 independent variables taken as a group do not
have significant linear effects on heating costs.
When constructing charts, the following is plotted at the class midpoints:
A) frequency histograms.
B) percentage polygons.
C) cumulative percentage polygon (ogives).
D) All of the above.
Referring to Table 14-15, which of the following is the correct null
hypothesis to test whether instructional spending per pupil has any
effect on percentage of students passing the proficiency test, taking
into account the effect of mean teacher salary?
TABLE 14-15
The superintendent of a school district wanted to predict the
percentage of students passing a sixth-grade proficiency test. She
obtained the data on percentage of students passing the proficiency
test (% Passing), mean teacher salary in thousands of dollars
(Salaries), and instructional spending per pupil in thousands of dollars
(Spending) of 47 schools in the state.
Following is the multiple regression output with Y = % Passing as the

dependent variable, X1 = Salaries and X2 = Spending:
A) H0 : β0 = 0
B) H0 : β1 = 0
C) H0 : β2 = 0
D) H0 : β3 = 0
If two events are collectively exhaustive, what is the probability that one or the other
occurs?
A) 0
B) 0.50
C) 1.00
D) Cannot be determined from the information given.

The head librarian at the Library of Congress has asked her assistant for an interval
estimate of the mean number of books checked out each day. The assistant provides the
following interval estimate: from 740 to 920 books per day. If the head librarian knows
that the population standard deviation is 150 books checked out per day, approximately
how large a sample did her assistant use to determine the interval estimate?
A) 2
B) 3
C) 12
D) It cannot be determined from the information given.
TABLE 17-11
A logistic regression model was estimated in order to predict the probability that a
randomly chosen university or college would be a private university using information
on mean total Scholastic Aptitude Test score (SAT) at the university or college, the
room and board expense measured in thousands of dollars (Room/Brd), and whether the
TOEFL criterion is at least 550 (Toefl550 = 1 if yes, 0 otherwise.) The dependent
variable, Y, is school type (Type = 1 if private and 0 otherwise).
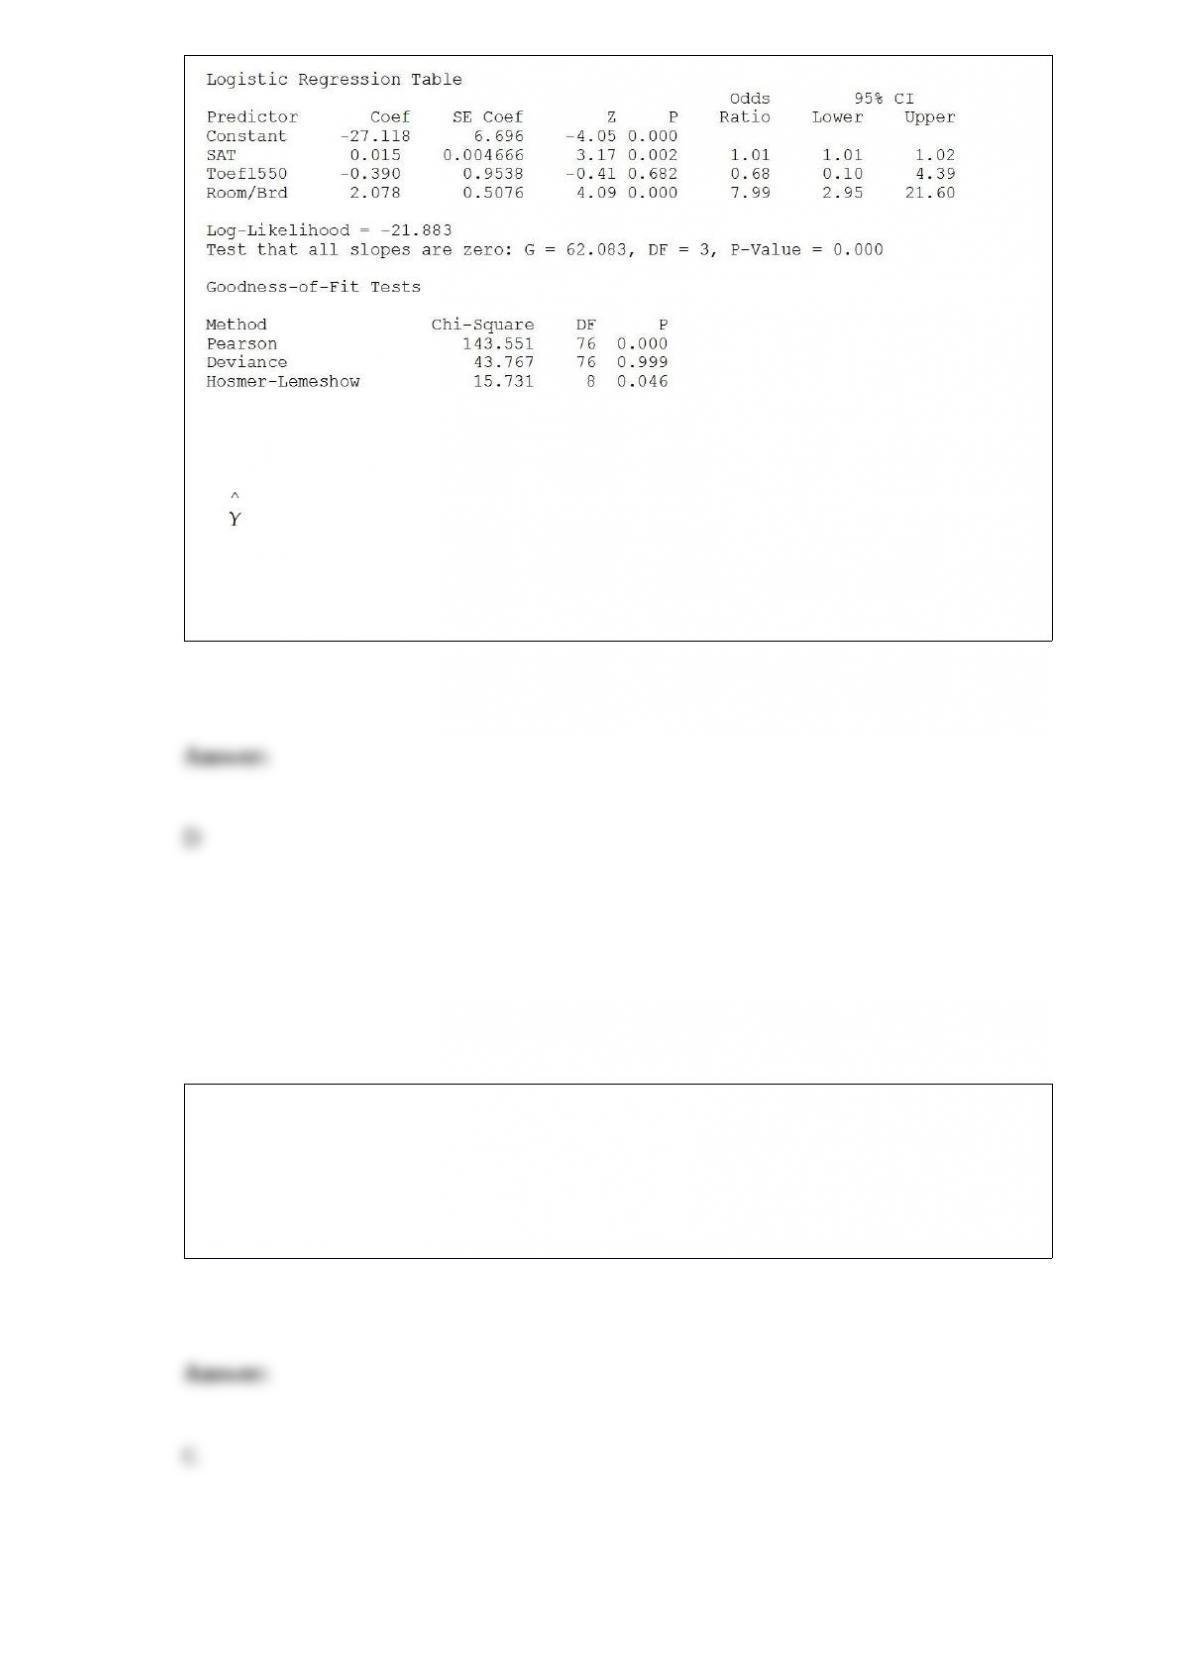
Referring to Table 17-11, which of the following is the correct expression for the
estimated model?
A)Y= -27.118 + 0.015SAT– 0.390Toefl550 + 2.078Room / Brd
B) = -27.118 + 0.015 SAT – 0.390 Toefl550 + 2.078 Room / Brd
C) ln (odds ratio) = -27.118 + 0.015 SAT – 0.390 Toefl550 + 2.078 Room / Brd
D) ln (estimated odds ratio) = -27.118 + 0.015 SAT – 0.390 Toefl550 + 2.078 Room /
Brd
The method of least squares is used on time-series data for
A) eliminating irregular movements.
B) deseasonalizing the data.
C) obtaining the trend equation.
D) exponentially smoothing a series.
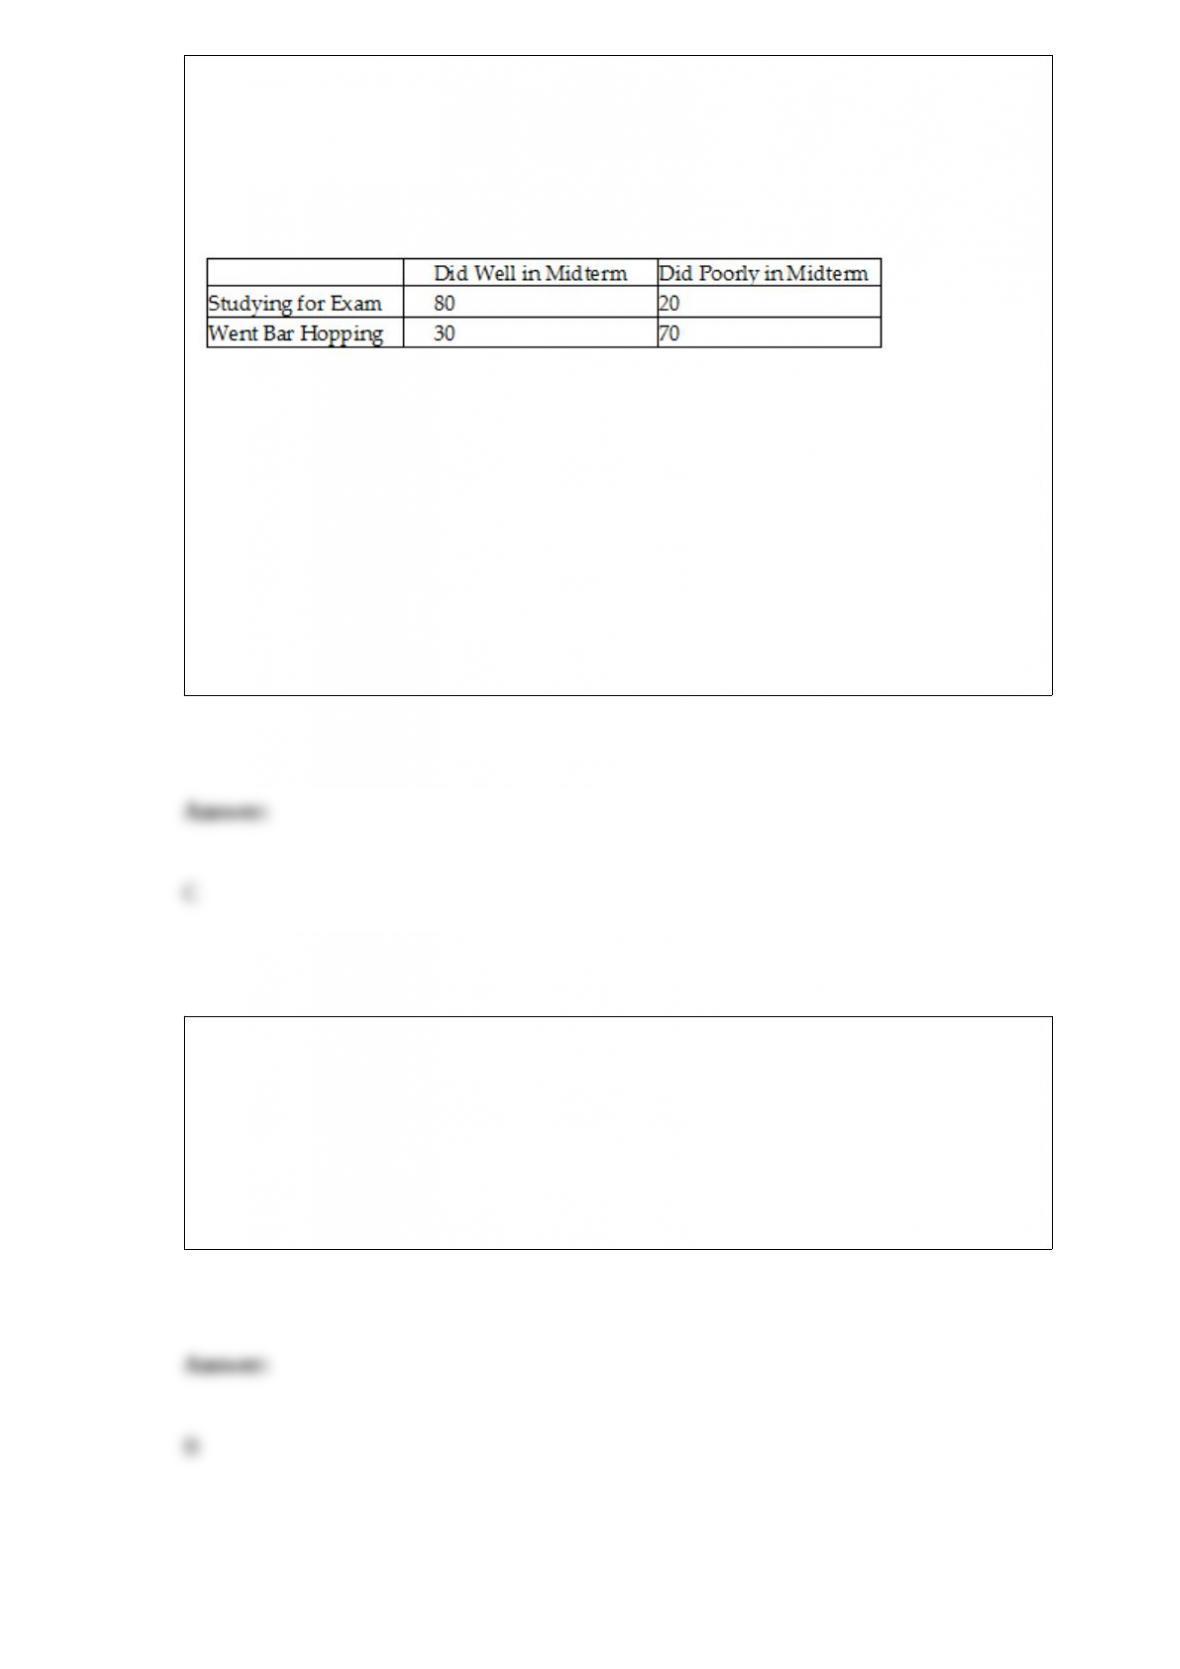
TABLE 2-6
A sample of 200 students at a Big-Ten university was taken after the midterm to ask
them whether they went bar hopping the weekend before the midterm or spent the
weekend studying, and whether they did well or poorly on the midterm. The following
table contains the result.
Referring to Table 2-6, of those who went bar hopping the weekend before the midterm
in the sample, ________ percent of them did well on the midterm.
A) 15
B) 27.27
C) 30
D) 55
A survey claims that 9 out of 10 doctors recommend aspirin for their patients with
headaches. To test this claim, a random sample of 100 doctors results in 83 who
indicate that they recommend aspirin. Which of the following tests will you perform?
A) t test for the mean
B) Z test for the proportion
C) Pooled-variance t test
D) Separate-variance t test
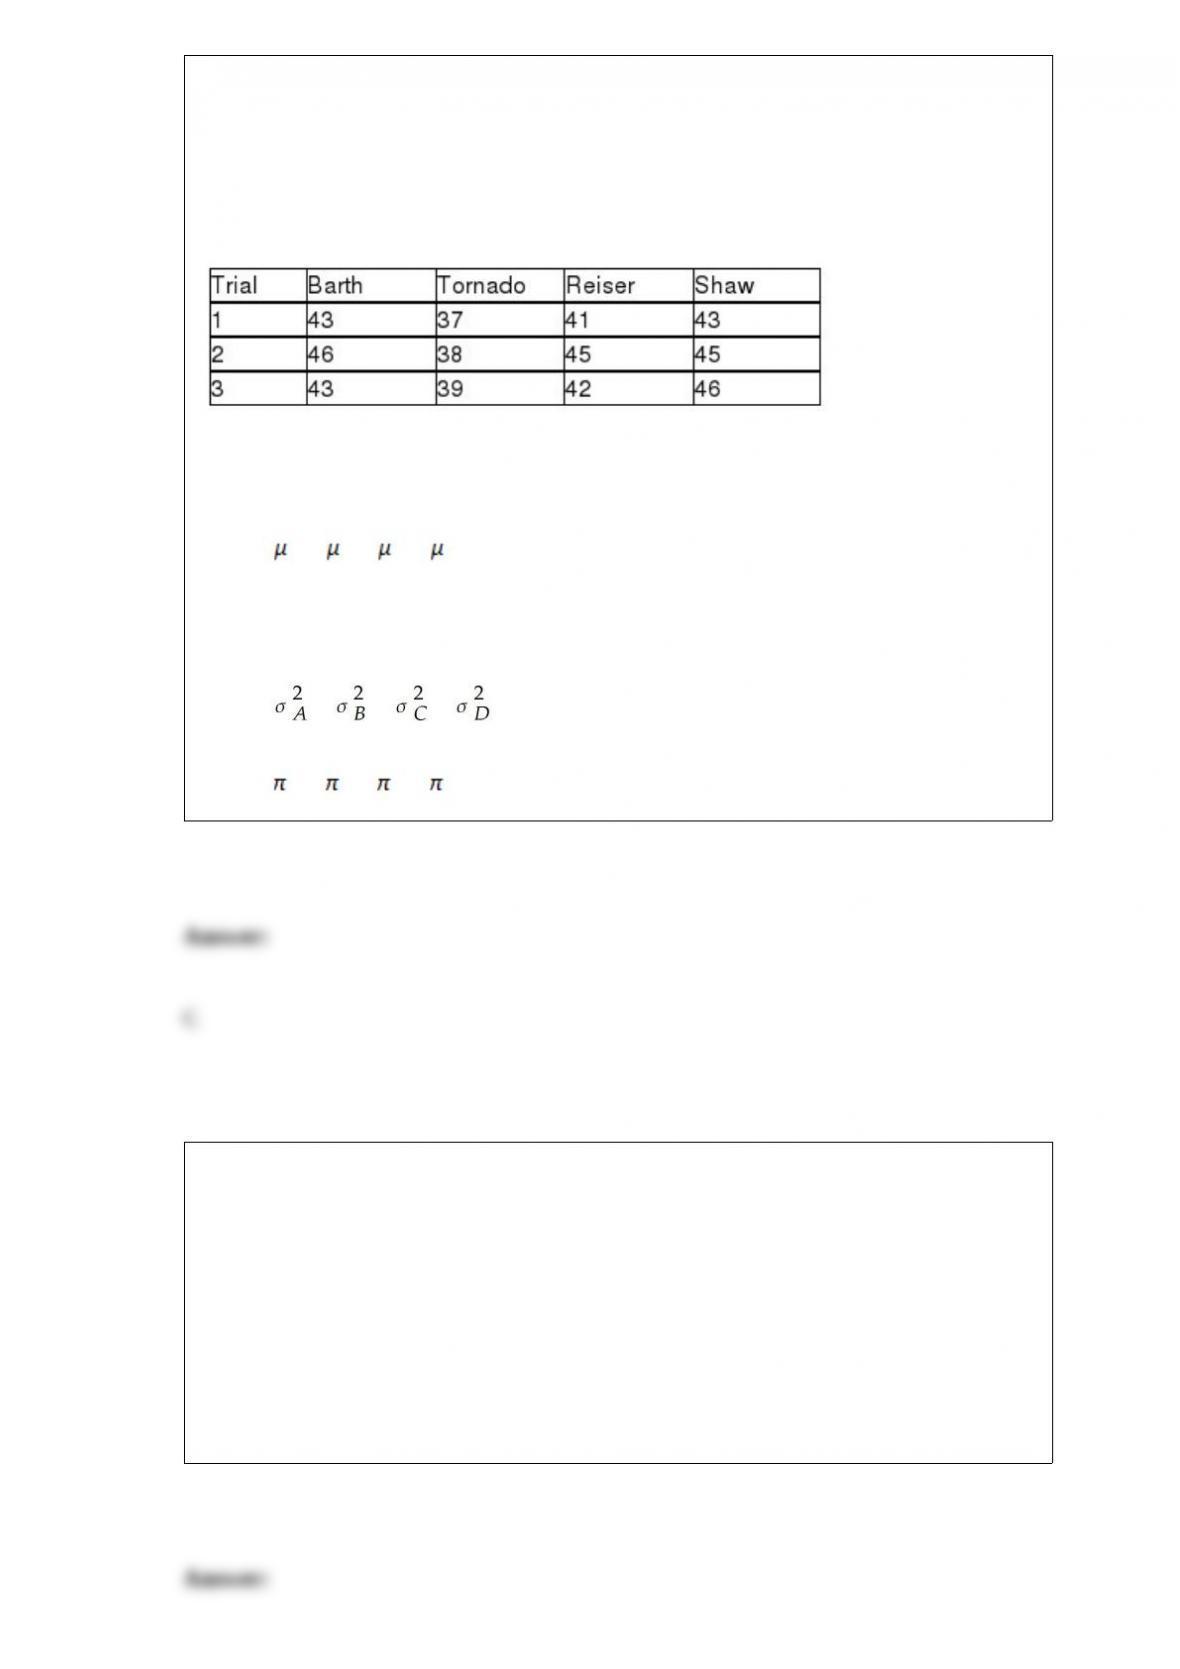
TABLE 11-3
As part of an evaluation program, a sporting goods retailer wanted to compare the
downhill coasting speeds of 4 brands of bicycles. She took 3 of each brand and
determined their maximum downhill speeds. The results are presented in miles per hour
in the table below.
Referring to Table 11-3, the null hypothesis for Levene’s test for homogeneity of
variances is
A) H0 : A = B = C = D.
B) H0 : MA = MB = MC = MD.
C) H0 : = = = .
D) H0 : A = B = C = D.
If an economist wishes to determine whether there is evidence that mean family income
in a community exceeds $50,000,
A) either a one-tail or two-tail test could be used with equivalent results.
B) a one-tail test should be utilized.
C) a two-tail test should be utilized.
D) None of the above.

Suppose the light bulbs in a factory burn out at a rate of 50 bulbs per month. Which of
the following distributions would you use to determine the probability that the next two
light bulbs will burn out 2 days apart?
A) Hypergeometric distribution
B) Poisson distribution
C) Uniform distribution
D) Exponential distribution
TABLE 1-2
A Wall Street Journal poll asked 2,150 adults in the United States a series of questions
to find out their view on the U.S. economy.
Referring to Table 1-2, the possible responses to the question “In which year do you
think the last recession in the United States started?” result in
A) a nominal scale variable.
B) an ordinal scale variable.
C) an interval scale variable.
D) a ratio scale variable.
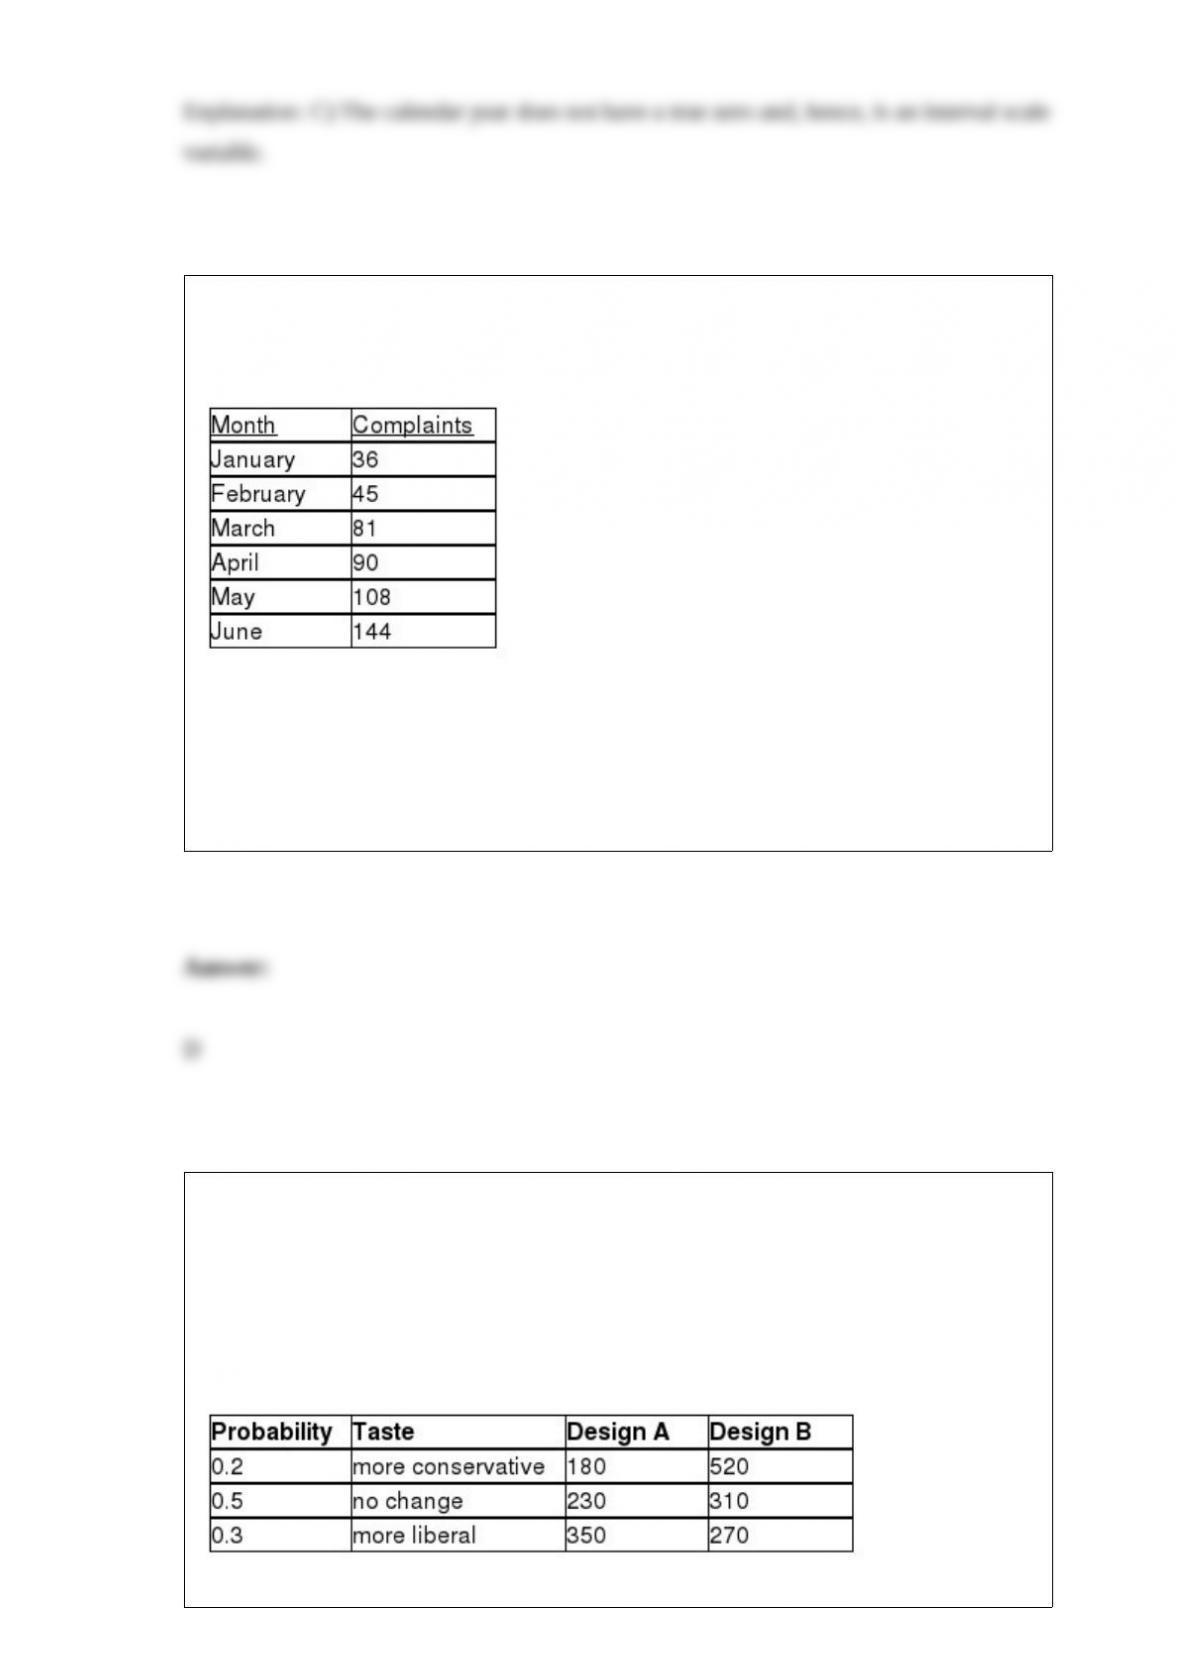
TABLE 16-3
The following table contains the number of complaints received in a department store
for the first 6 months of last year.
Referring to Table 16-3, if a three-month moving average is used to smooth this series,
what would be the second calculated value?
A) 36
B) 40.5
C) 54
D) 72
TABLE 5-8
Two different designs on a new line of winter jackets for the coming winter are
available for your manufacturing plants. Your profit (in thousands of dollars) will
depend on the taste of the consumers when winter arrives. The probability of the three
possible different tastes of the consumers and the corresponding profits are presented in
the following table.
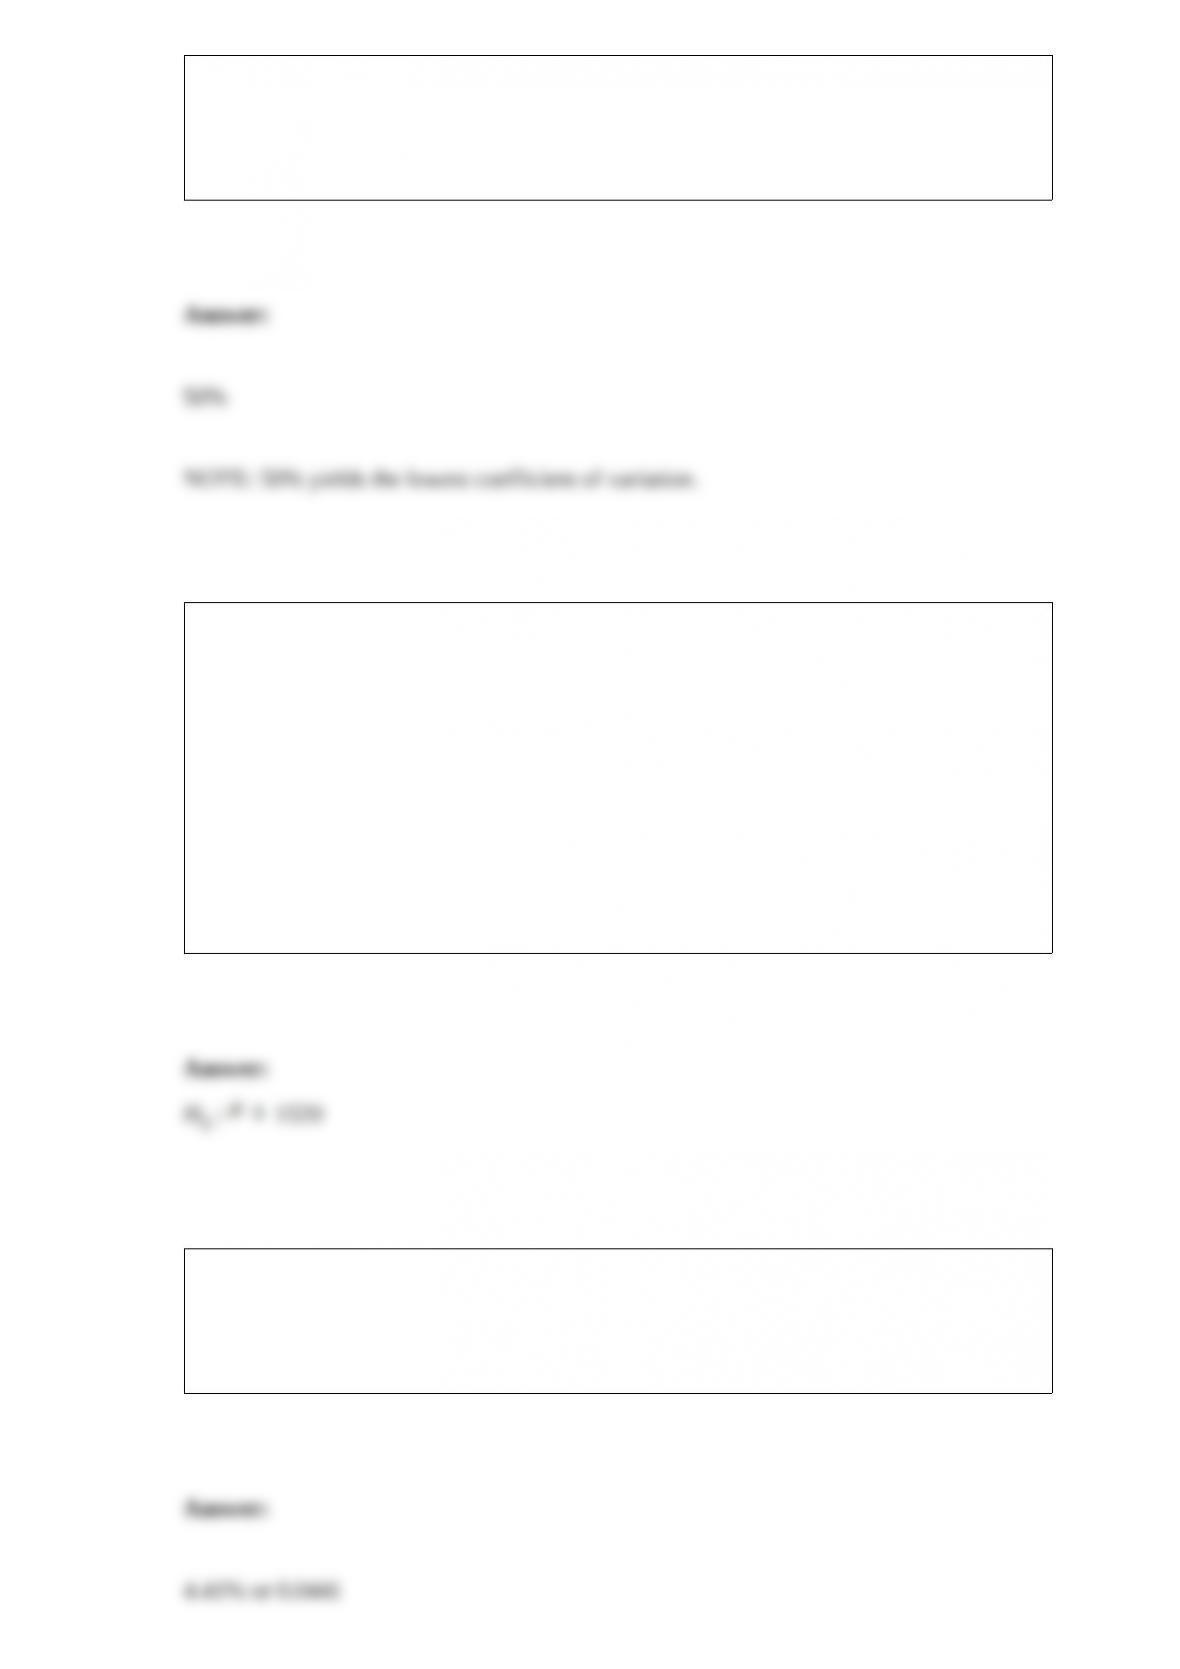
Referring to Table 5-8, if your investment preference is to maximize your expected
profit while exposing yourself to the minimal amount of risk, will you choose a
production mix that will consist of 10%, 30%, 50%, 70%, or 90% of your production
lines for Design A and the remaining for Design B?
TABLE 9-9
The president of a university claimed that the entering class this year appeared to be
larger than the entering class from previous years but their mean SAT score is lower
than previous years. He took a sample of 20 of this year’s entering students and found
that their mean SAT score is 1,501 with a standard deviation of 53. The university’s
record indicates that the mean SAT score for entering students from previous years is
1,520. He wants to find out if his claim is supported by the evidence at a 5% level of
significance.
Referring to Table 9-9, state the null hypothesis for this study.
You were told that the mean score on a statistics exam is 75 with the scores normally
distributed. In addition, you know the probability of a score between 55 and 60 is
4.41% and that the probability of a score greater than 90 is 6.68%. What is the
probability of a score between 90 and 95?
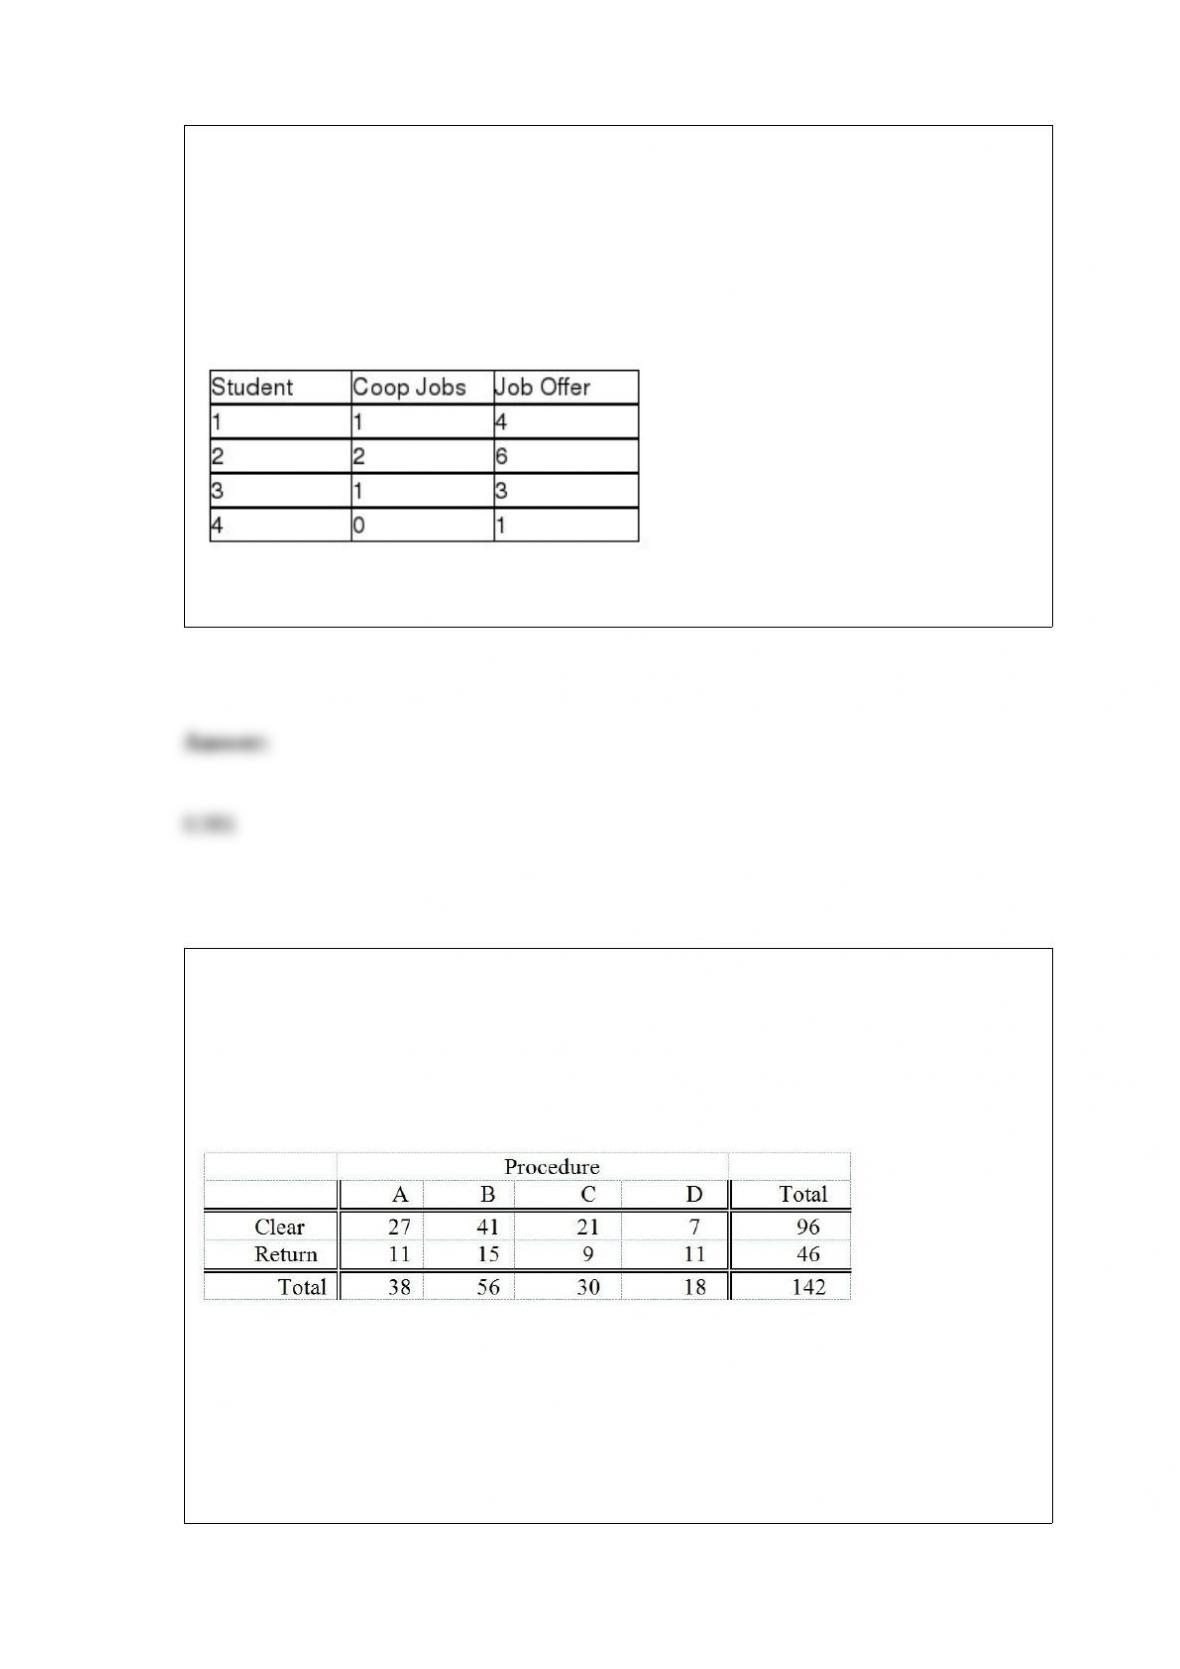
TABLE 13-3
The director of cooperative education at a state college wants to examine the effect of
cooperative education job experience on marketability in the work place. She takes a
random sample of 4 students. For these 4, she finds out how many times each had a
cooperative education job and how many job offers they received upon graduation.
These data are presented in the table below.
Referring to Table 13-3, the coefficient of correlation is ________.
TABLE 12-5
Four surgical procedures currently are used to install pacemakers. If the patient does not
need to return for follow-up surgery, the operation is called a “clear” operation. A heart
center wants to compare the proportion of clear operations for the 4 procedures, and
collects the following numbers of patients from their own records:
They will use this information to test for a difference among the proportion of clear
operations using a chi-square test with a level of significance of 0.05.
Referring to Table 12-5, what is the value of the critical range for the Marascuilo
procedure to test for the difference in proportions between procedure C and procedure
D using a 0.05 level of significance?
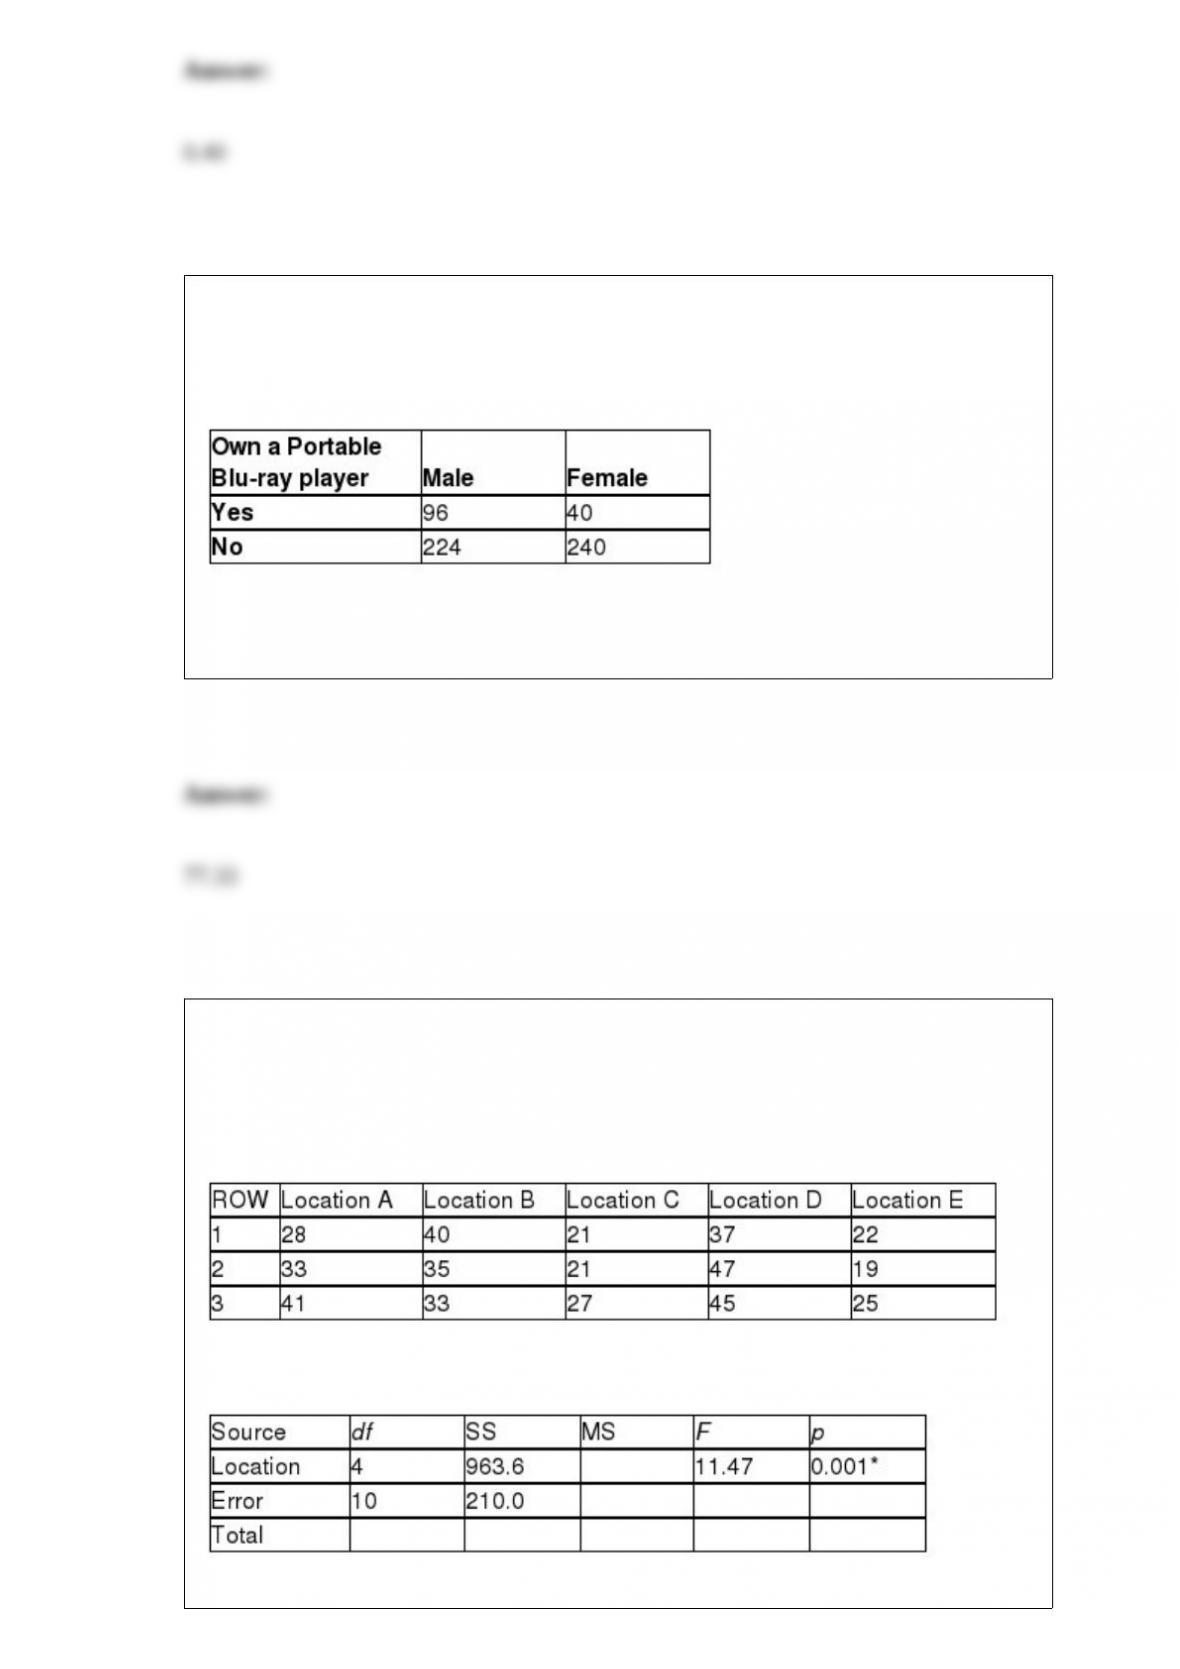
TABLE 2-14
The table below contains the number of people who own a portable Blu-ray player in a
sample of 600 broken down by gender.
Referring to Table 2-14, ________ percent of the 600 did not own a portable Blu-ray
player.
TABLE 11-5
A hotel chain has identically small sized resorts in 5 locations in different small islands.
The data that follow resulted from analyzing the hotel occupancies on randomly
selected days in the 5 locations.
Analysis of Variance

* or p < 0.005, tabular value
Referring to Table 11-5, the within-group variation or SSW is ________.