TABLE 16-6
The president of a chain of department stores believes that her stores’ total sales have
been showing a linear trend since 1993. She uses Microsoft Excel to obtain the partial
output below. The dependent variable is sales (in millions of dollars), while the
independent variable is coded years, where 1993 is coded as 0, 1994 is coded as 1, etc.
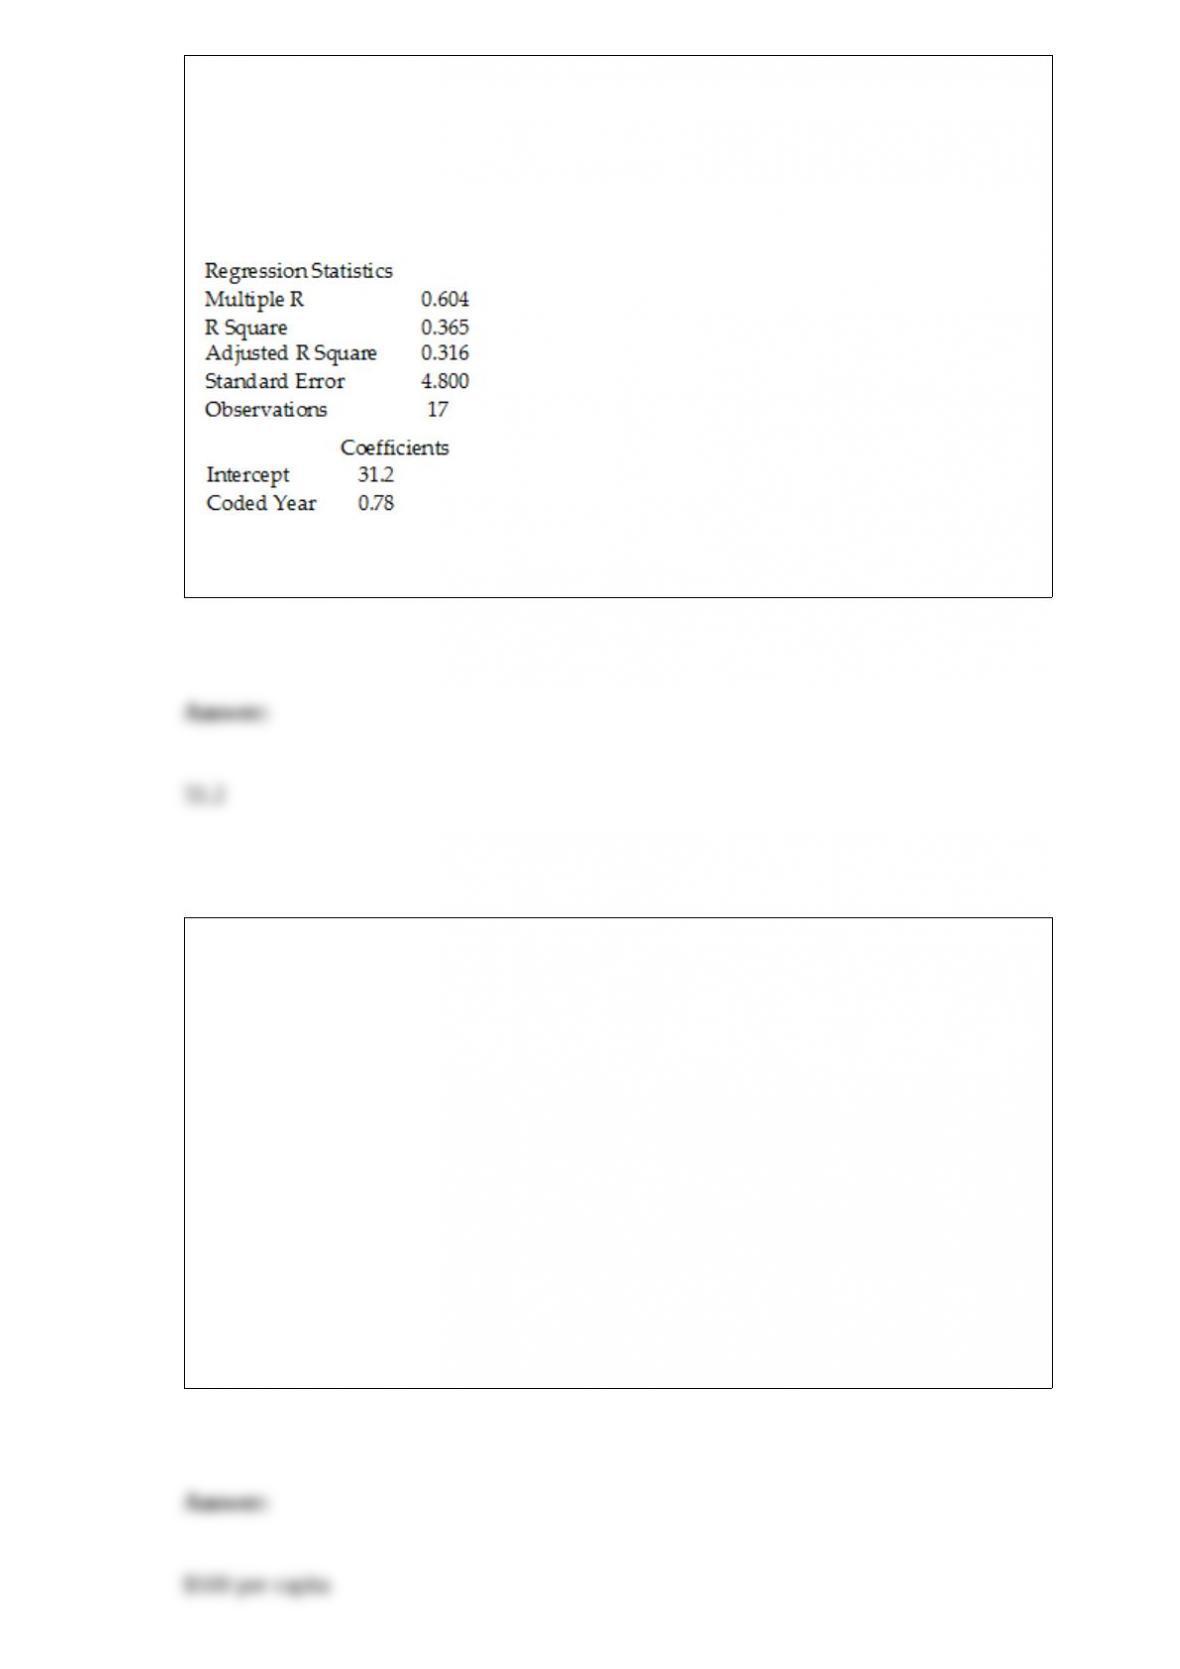
SUMMARY OUTPUT
Referring to Table 16-6, the fitted trend value (in millions of dollars) for 1993 is
________.
Referring to Table 14-13, holding constant the effect of city, each
additional increase of 1% in the mortgage rate would lead to an
estimated increase of ________ in the mean demand.
TABLE 14-13
An econometrician is interested in evaluating the relationship of
demand for building materials to mortgage rates in Los Angeles and
San Francisco. He believes that the appropriate model is
Y = 10 + 5X1 + 8X2
where X1 = mortgage rate in %
X2 = 1 if SF, 0 if LA
Y = demand in $100 per capita
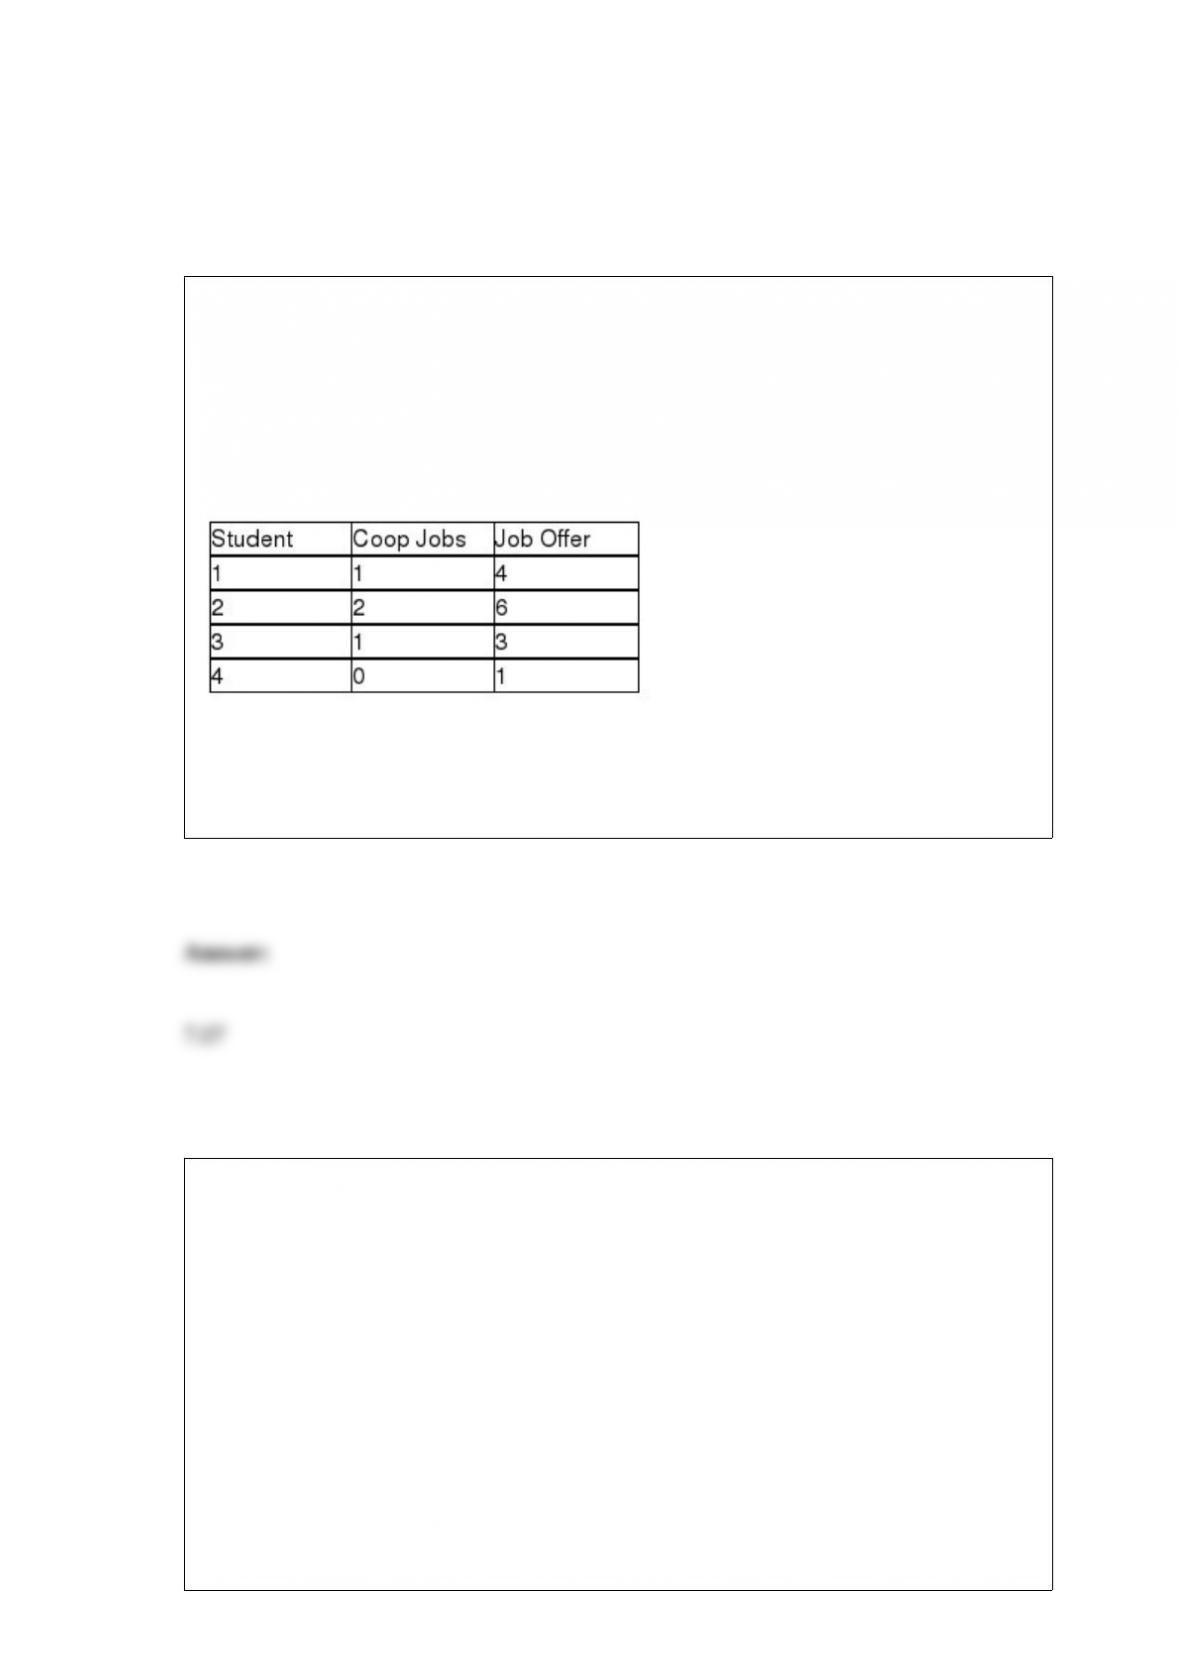
TABLE 13-3
The director of cooperative education at a state college wants to examine the effect of
cooperative education job experience on marketability in the work place. She takes a
random sample of 4 students. For these 4, she finds out how many times each had a
cooperative education job and how many job offers they received upon graduation.
These data are presented in the table below.
Referring to Table 13-3, the director of cooperative education wanted to test the
hypothesis that the population slope was equal to 0. The value of the test statistic is
________.
Referring to Table 14-16, ________ of the variation in Accel Time can be
explained by engine size while controlling for the other independent
variable.
TABLE 14-16
What are the factors that determine the acceleration time (in sec.)
from 0 to 60 miles per hour of a car? Data on the following variables
for 30 different vehicle models were collected:
Y (Accel Time): Acceleration time in sec.
X1 (Engine Size): c.c.
X2 (Sedan): 1 if the vehicle model is a sedan and 0 otherwise

The regression results using acceleration time as the dependent
variable and the remaining variables as the independent variables are
presented below.
The various residual plots are as shown below.

The coefficient of partial determinations and are 0.3301,
and 0.0594, respectively.
The coefficient of determination for the regression model using each
of the 2 independent variables as the dependent variable and the
other independent variable as independent variables ( ) are,
respectively 0.0077, and 0.0077.

TABLE 5-2
A certain type of new business succeeds 60% of the time. Suppose that 3 such
businesses open (where they do not compete with each other, so it is reasonable to
believe that their relative successes would be independent).
Referring to Table 5-2, the probability that exactly 1 business succeeds is ________.
TABLE 10-6
To investigate the efficacy of a diet, a random sample of 16 male patients is selected
from a population of adult males using the diet. The weight of each individual in the
sample is taken at the start of the diet and at a medical follow-up 4 weeks later.
Assuming that the population of differences in weight before versus after the diet
follow a normal distribution, the t-test for related samples can be used to determine if
there was a significant decrease in the mean weight during this period. Suppose the
mean decrease in weights over all 16 subjects in the study is 3.0 pounds with the
standard deviation of differences computed as 6.0 pounds.
Referring to Table 10-6, the critical value for a one-tail test of the null hypothesis of no
difference at the = 0.05 level of significance is ________.
TABLE 6-1
The number of column inches of classified advertisements appearing on Mondays in a

certain daily newspaper is normally distributed with a population mean of 320 and a
population standard deviation of 20 inches.
Referring to Table 6-1, for a randomly chosen Monday the probability is 0.1 that there
will be less than how many column inches of classified advertisements?