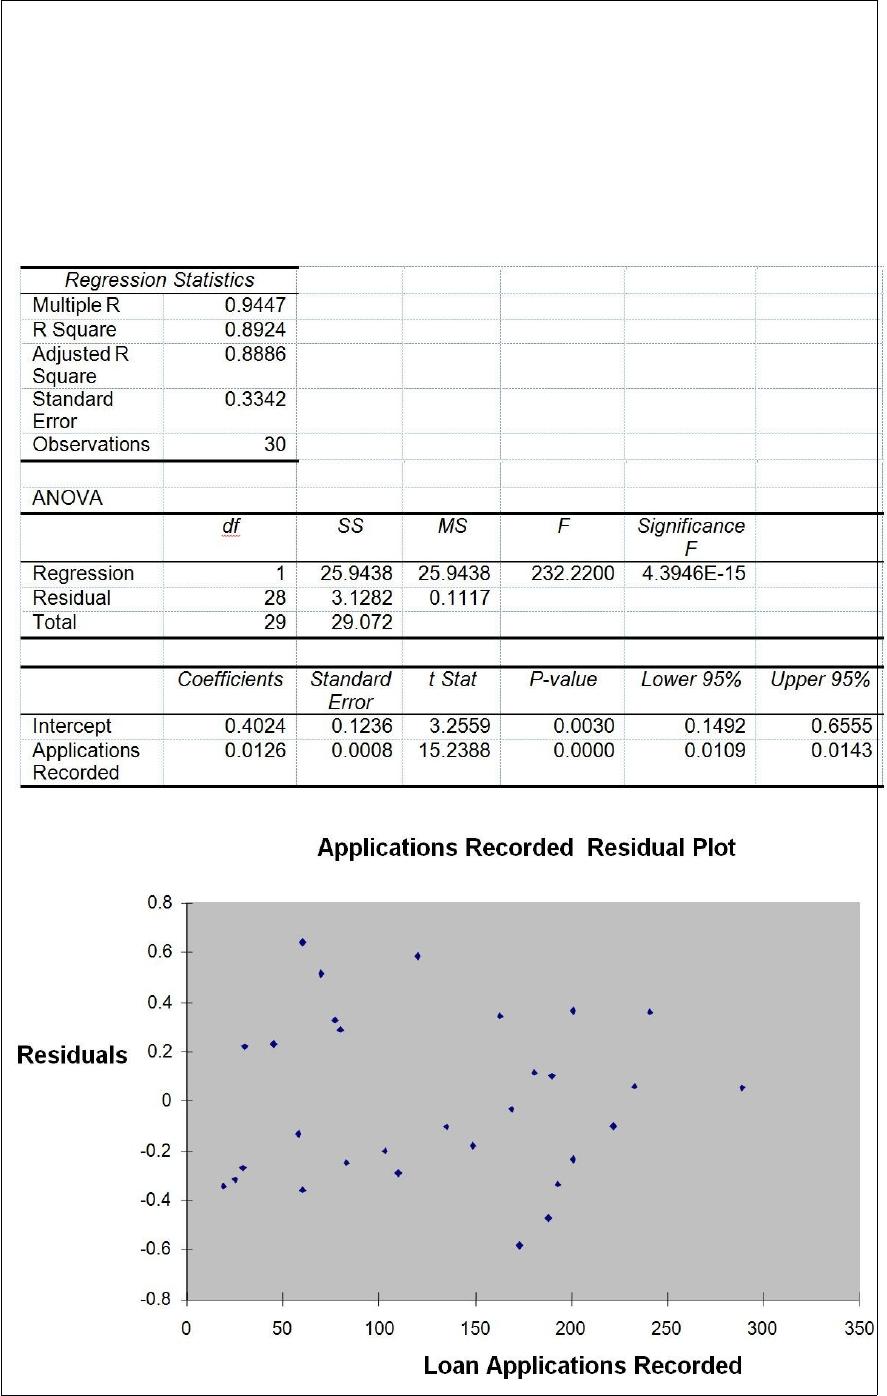
TABLE 13-12
The manager of the purchasing department of a large saving and loan organization
would like to develop a model to predict the amount of time (measured in hours) it
takes to record a loan application. Data are collected from a sample of 30 days, and the
number of applications recorded and completion time in hours is recorded. Below is the
regression output:
Referring to Table 13-12, what are the critical values of the Durbin-Watson test statistic
using the 5% level of significance to test for evidence of positive autocorrelation?
TABLE 17-9
What are the factors that determine the acceleration time (in sec.) from 0 to 60 miles per
hour of a car? Data on the following variables for 171 different vehicle models were
collected:
Accel Time: Acceleration time in sec.
Cargo Vol: Cargo volume in cu. ft.
HP: Horsepower
MPG: Miles per gallon
SUV: 1 if the vehicle model is an SUV with Coupe as the base when SUV and Sedan
are both 0
Sedan: 1 if the vehicle model is a sedan with Coupe as the base when SUV and Sedan
are both 0
The regression results using acceleration time as the dependent variable and the
remaining variables as the independent variables are presented below.
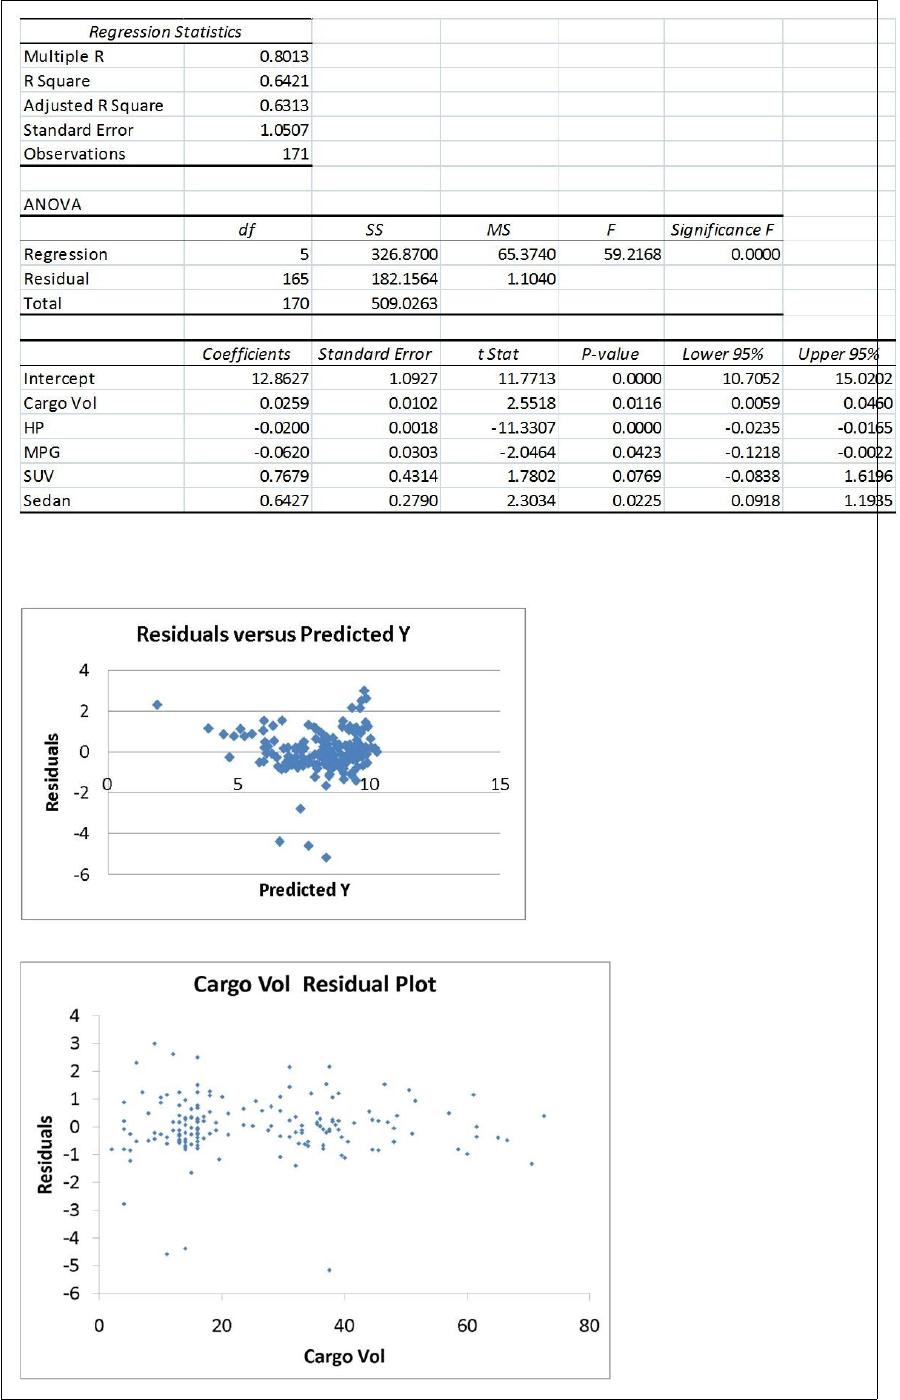
The various residual plots are as shown below.
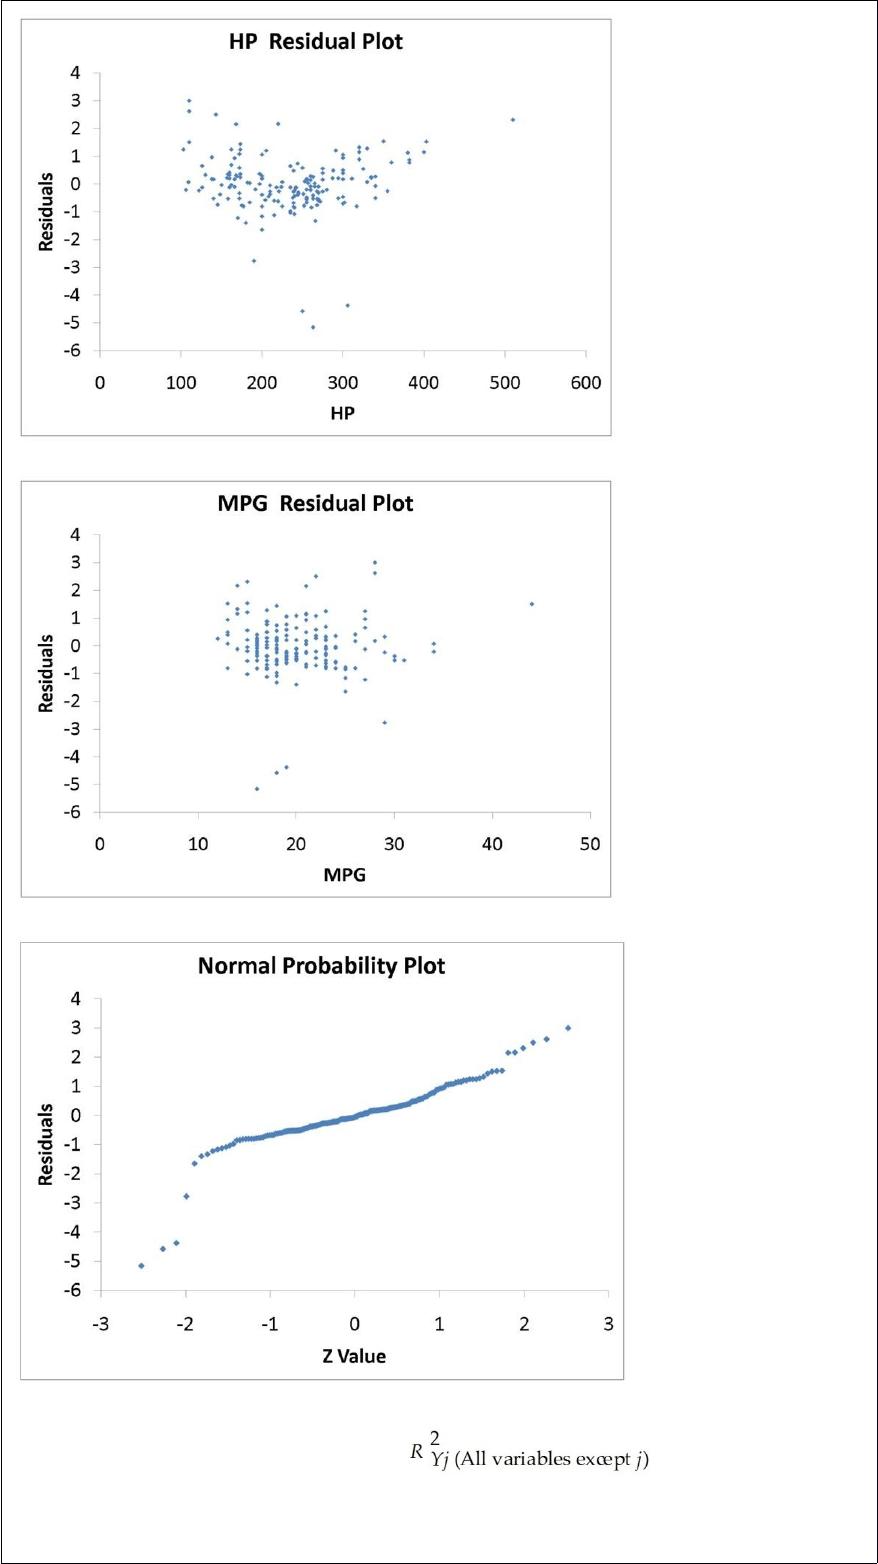
The coefficient of partial determination ( ) of each of the 5
predictors are, respectively, 0.0380, 0.4376, 0.0248, 0.0188, and 0.0312.
The coefficient of multiple determination for the regression model using each of the 5
variables Xj as the dependent variable and all other X variables as independent variables
( ) are, respectively, 0.7461, 0.5676, 0.6764, 0.8582, 0.6632.
Referring to Table 17-9, ________ of the variation in Accel Time can be explained by
Cargo Vol while controlling for the other independent variables.
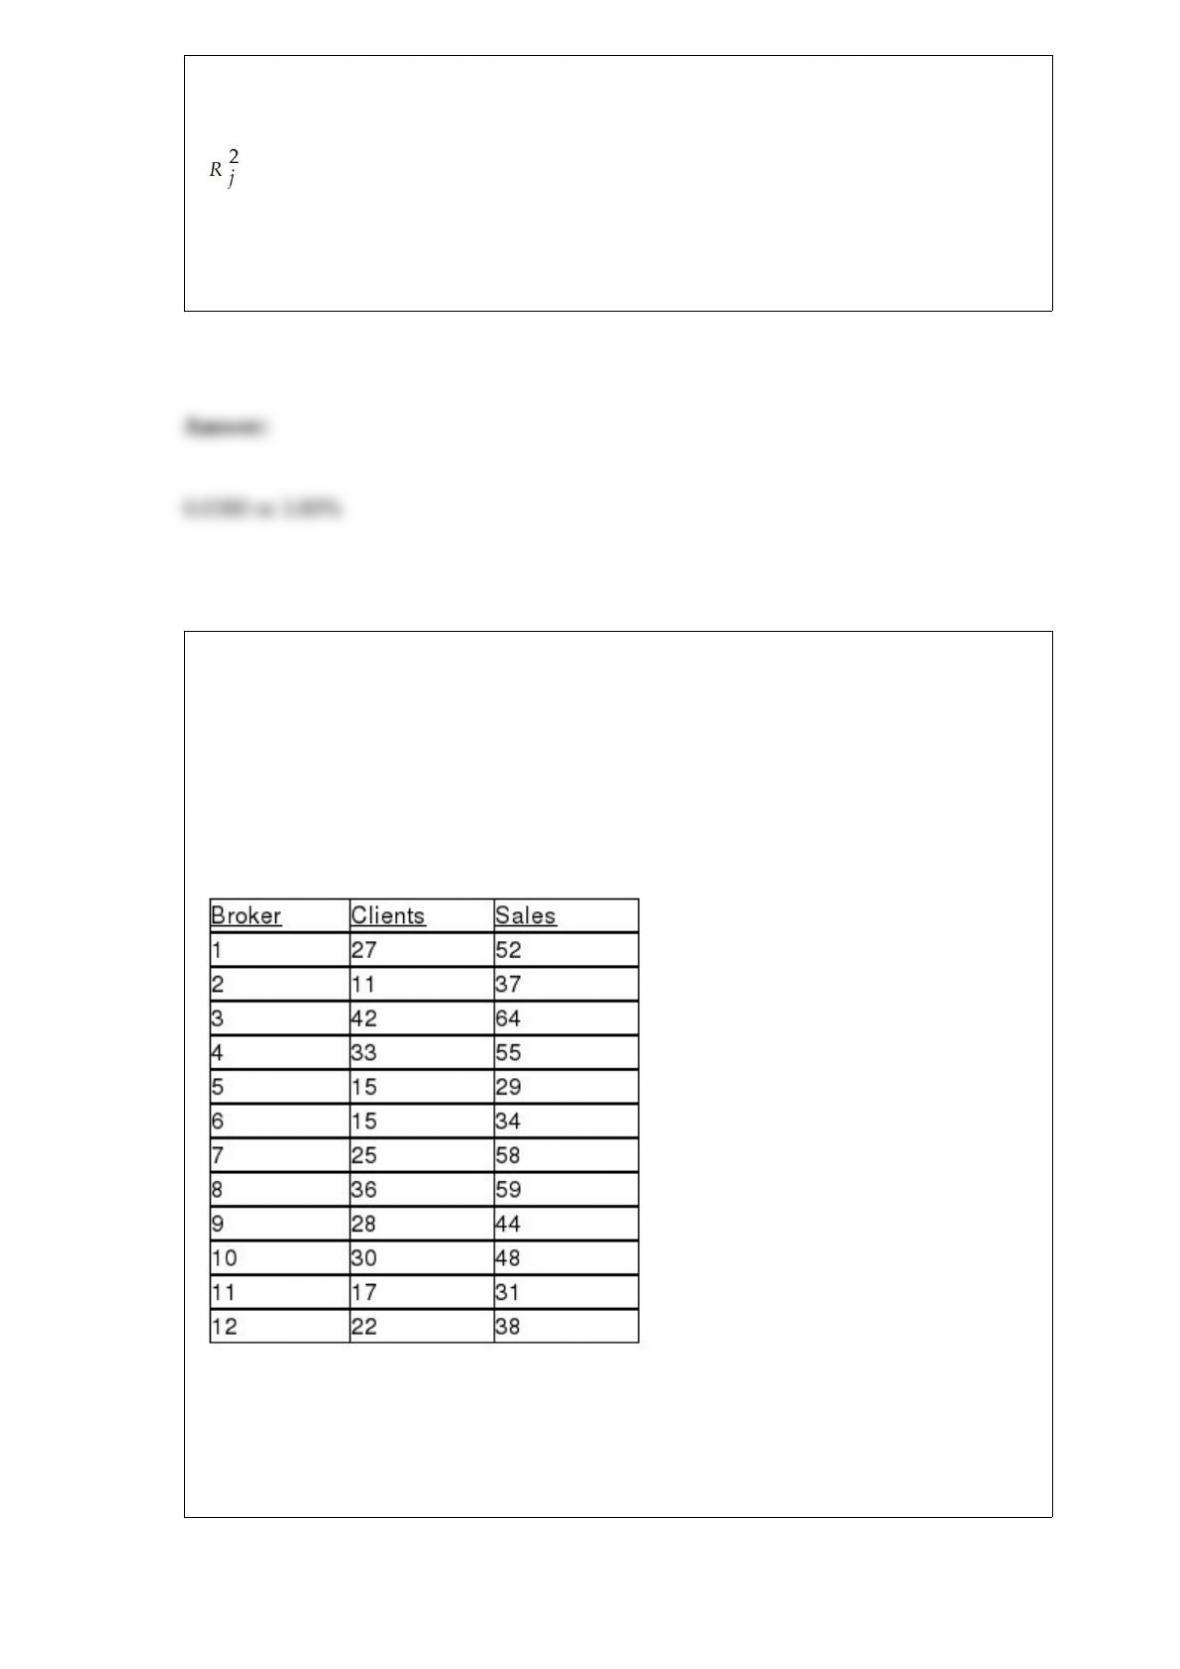
TABLE 13-4
The managers of a brokerage firm are interested in finding out if the number of new
clients a broker brings into the firm affects the sales generated by the broker. They
sample 12 brokers and determine the number of new clients they have enrolled in the
last year and their sales amounts in thousands of dollars. These data are presented in the
table that follows.
Referring to Table 13-4, the managers of the brokerage firm wanted to test the
hypothesis that the number of new clients brought in had a positive impact on the
amount of sales generated. For a test with a level of significance of 0.01, the null
hypothesis should be rejected if the value of the test statistic is ________.

TABLE 2-11
The ordered array below resulted from selecting a sample of 25 batches of 500
computer chips and determining how many in each batch were defective.
Defects
Referring to Table 2-11, if a frequency distribution for the defects data is constructed,
using “0 but less than 5” as the first class, the relative frequency of the “15 but less than
20″ class would be ________.
TABLE 4-3
A survey is taken among customers of a fast-food restaurant to determine preference for
hamburger or chicken. Of 200 respondents selected, 75 were children and 125 were
adults. 120 preferred hamburger and 80 preferred chicken. 55 of the children preferred
hamburger.
Referring to Table 4-3, the probability that a randomly selected individual is an adult
and prefers chicken is ________.
You were told that the 1st, 2nd and 3rd quartiles of female students’ weight at a major
university are 95 lbs, 125 lbs, and 138 lbs. What percentage of the students weigh more
than 125 lbs?
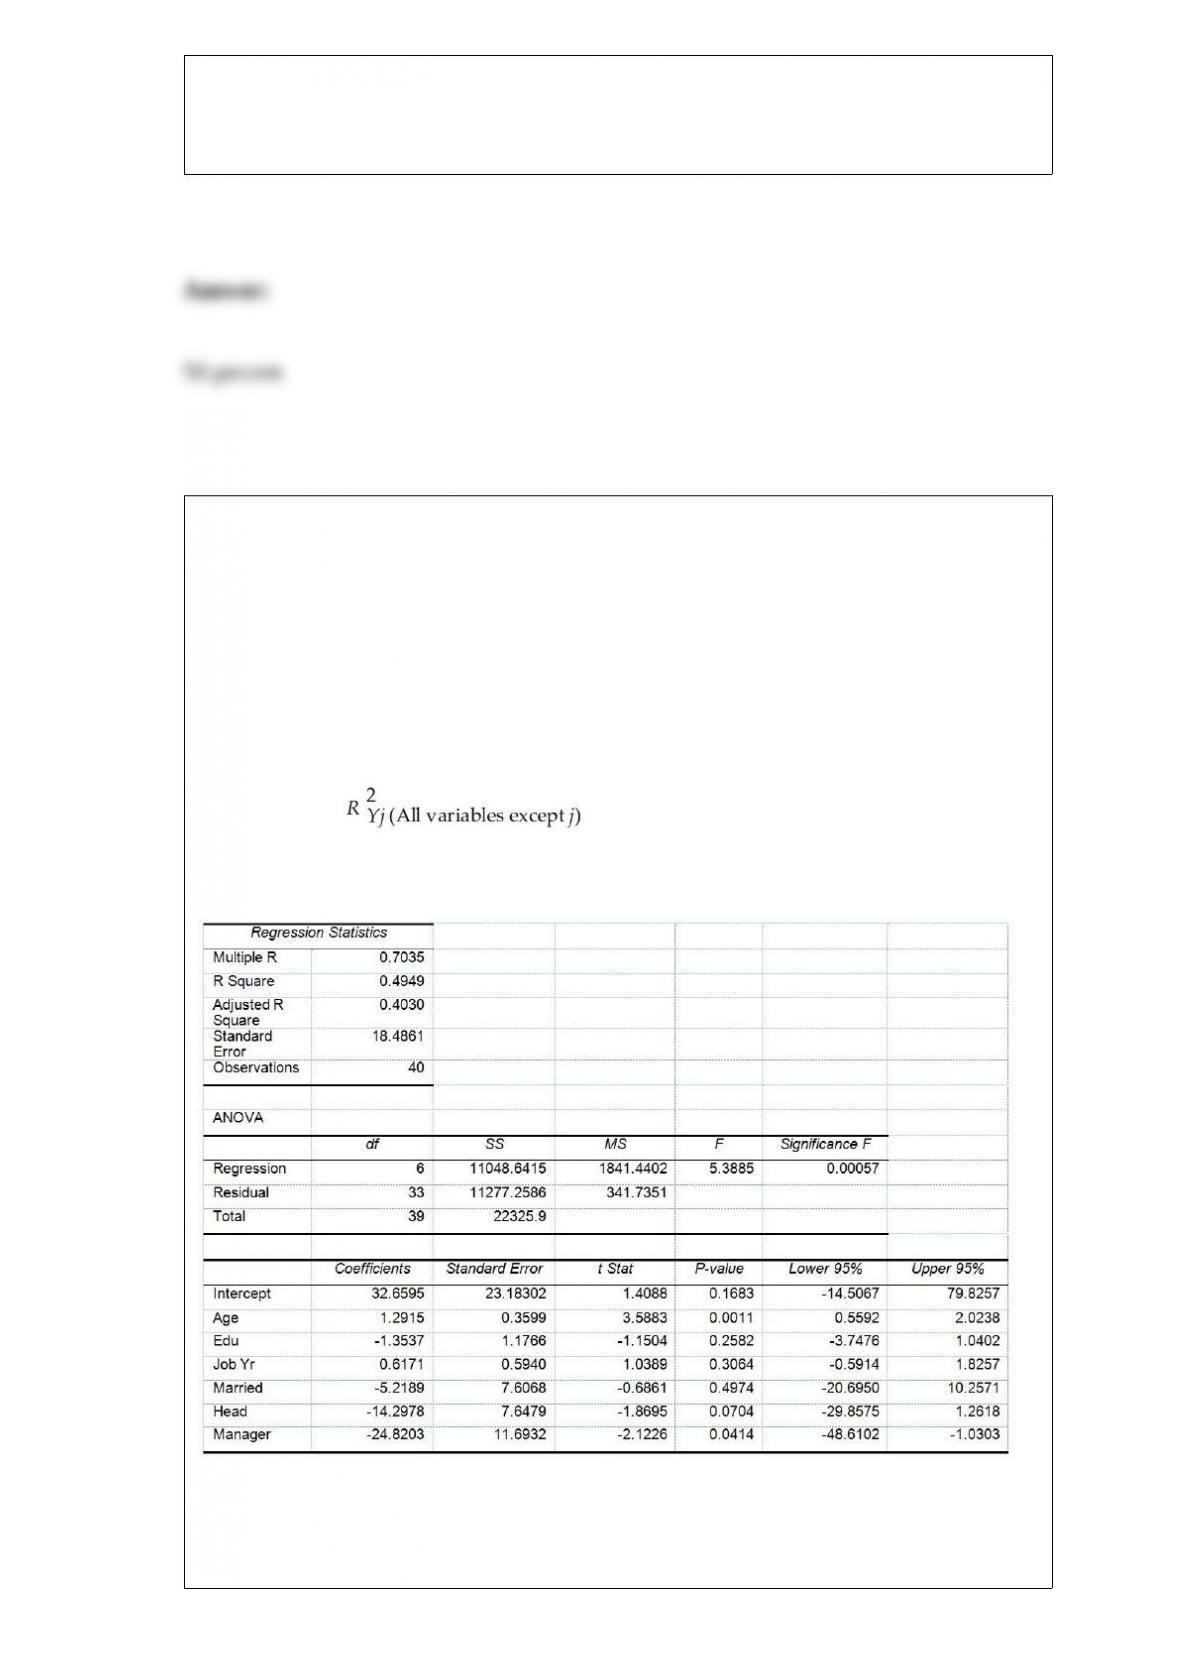
TABLE 17-10
Given below are results from the regression analysis where the dependent variable is
the number of weeks a worker is unemployed due to a layoff (Unemploy) and the
independent variables are the age of the worker (Age), the number of years of education
received (Edu), the number of years at the previous job (Job Yr), a dummy variable for
marital status (Married: 1 = married, 0 = otherwise), a dummy variable for head of
household (Head: 1 = yes, 0 = no) and a dummy variable for management position
(Manager: 1 = yes, 0 = no). We shall call this Model 1. The coefficient of partial
determination ( ) of each of the 6 predictors are, respectively,
0.2807, 0.0386, 0.0317, 0.0141, 0.0958, and 0.1201.
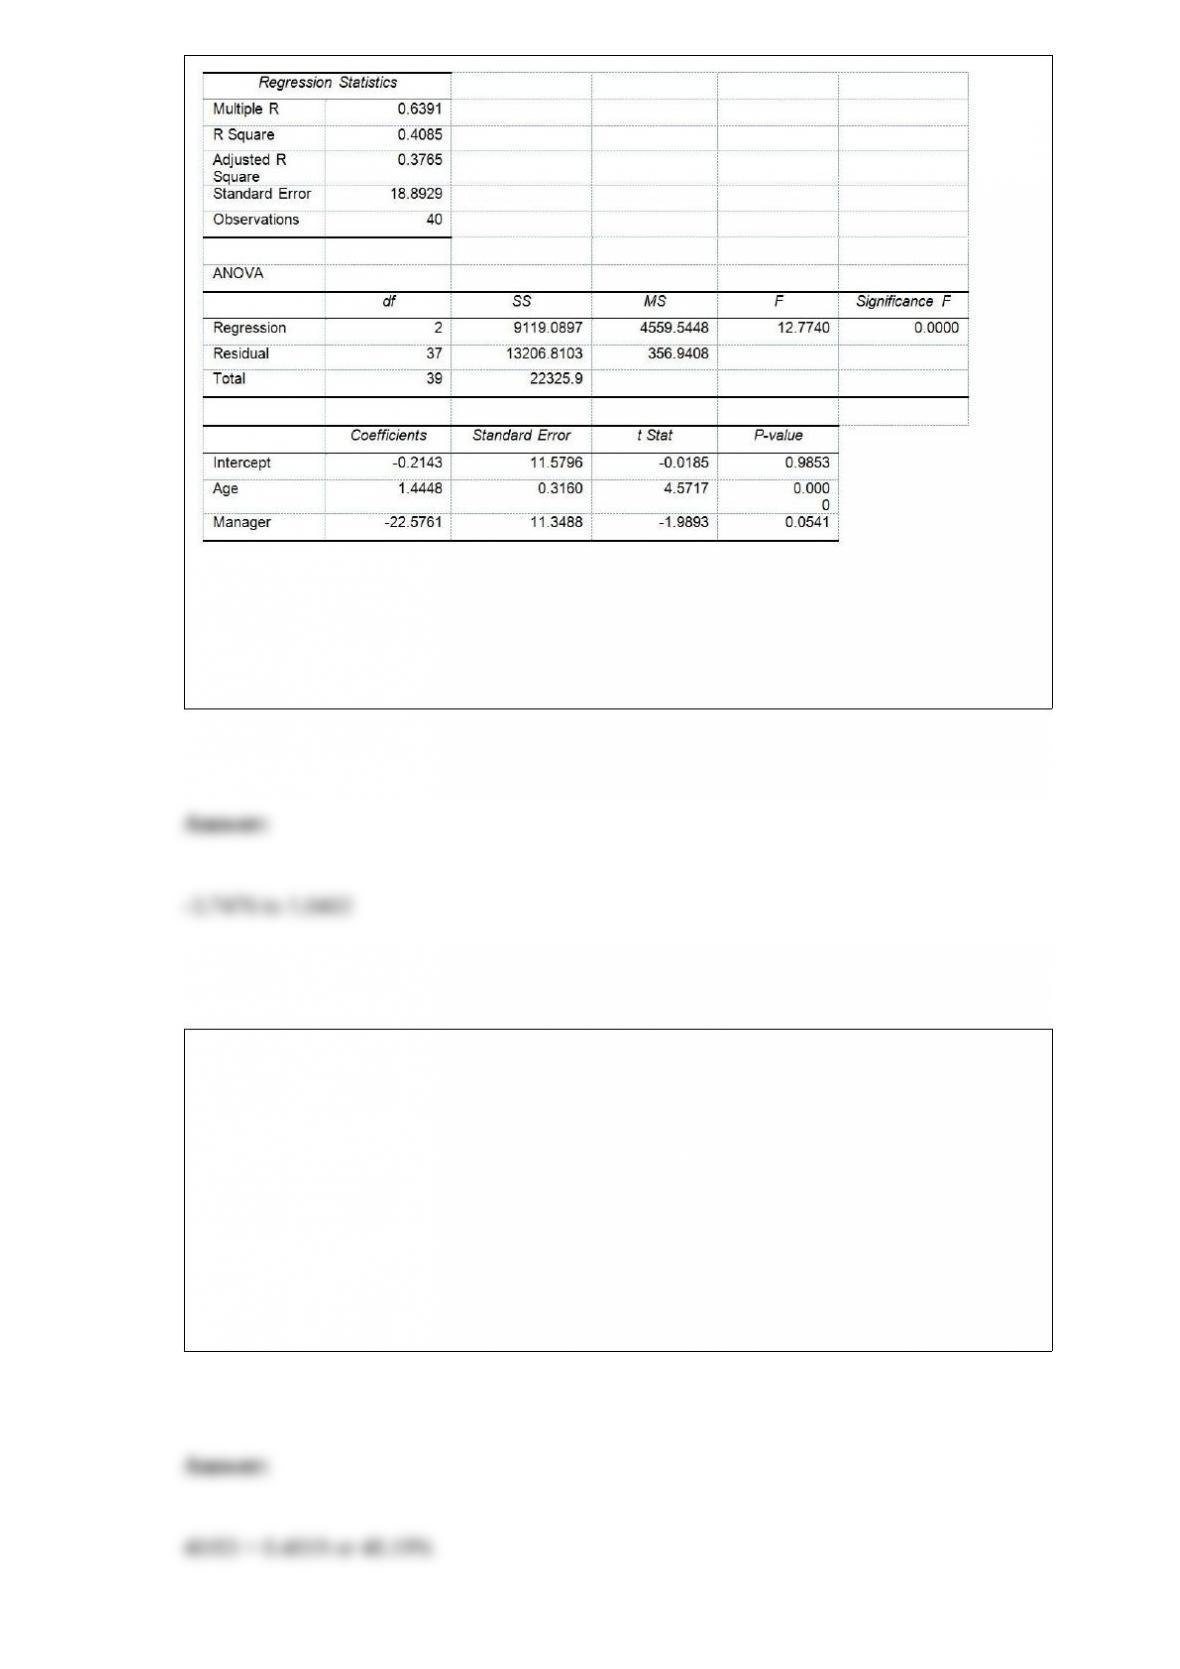
Model 2 is the regression analysis where the dependent variable is Unemploy and the
independent variables are Age and Manager. The results of the regression analysis are
given below:
Referring to Table 17-10, Model 1, what are the lower and upper limits of the 95%
confidence interval estimate for the effect of a one year increase in education received
on the mean number of weeks a worker is unemployed due to a layoff after taking into
consideration the effect of all the other independent variables?
TABLE 4-9
A survey conducted by the Segal Company of New York found that in a sample of 189
large companies, 40 offered stock options to their board members as part of their
noncash compensation packages. For small- to mid-sized companies, 43 of the 180
surveyed indicated that they offer stock options as part of their noncash compensation
packages to their board members.
Referring to Table 4-9, if a randomly selected company offered stock options to their
board members, what is the probability that it is a large company?