
TABLE 8-10
A sales and marketing management magazine conducted a survey on salespeople
cheating on their expense reports and other unethical conduct. In the survey on 200
managers, 58% of the managers have caught salespeople cheating on an expense report,
50% have caught salespeople working a second job on company time, 22% have caught
salespeople listing a ‘strip bar” as a restaurant on an expense report, and 19% have
caught salespeople giving a kickback to a customer.
True or False: Referring to Table 8-10, it is possible that the 95% confidence interval
calculated from the data will not contain the population proportion of managers who
have caught salespeople cheating on an expense report.
TABLE 14-17
Given below are results from the regression analysis where the
dependent variable is the number of weeks a worker is unemployed
due to a layo! (Unemploy) and the independent variables are the age
of the worker (Age) and a dummy variable for management position
(Manager: 1 = yes, 0 = no).
The results of the regression analysis are given below:
True or False: Referring to Table 14-17, the alternative hypothesis H1 :
At least one of βj ≠0 for j = 1, 2 implies that the number of weeks
a worker is unemployed due to a layo! is related to all of the
explanatory variables.
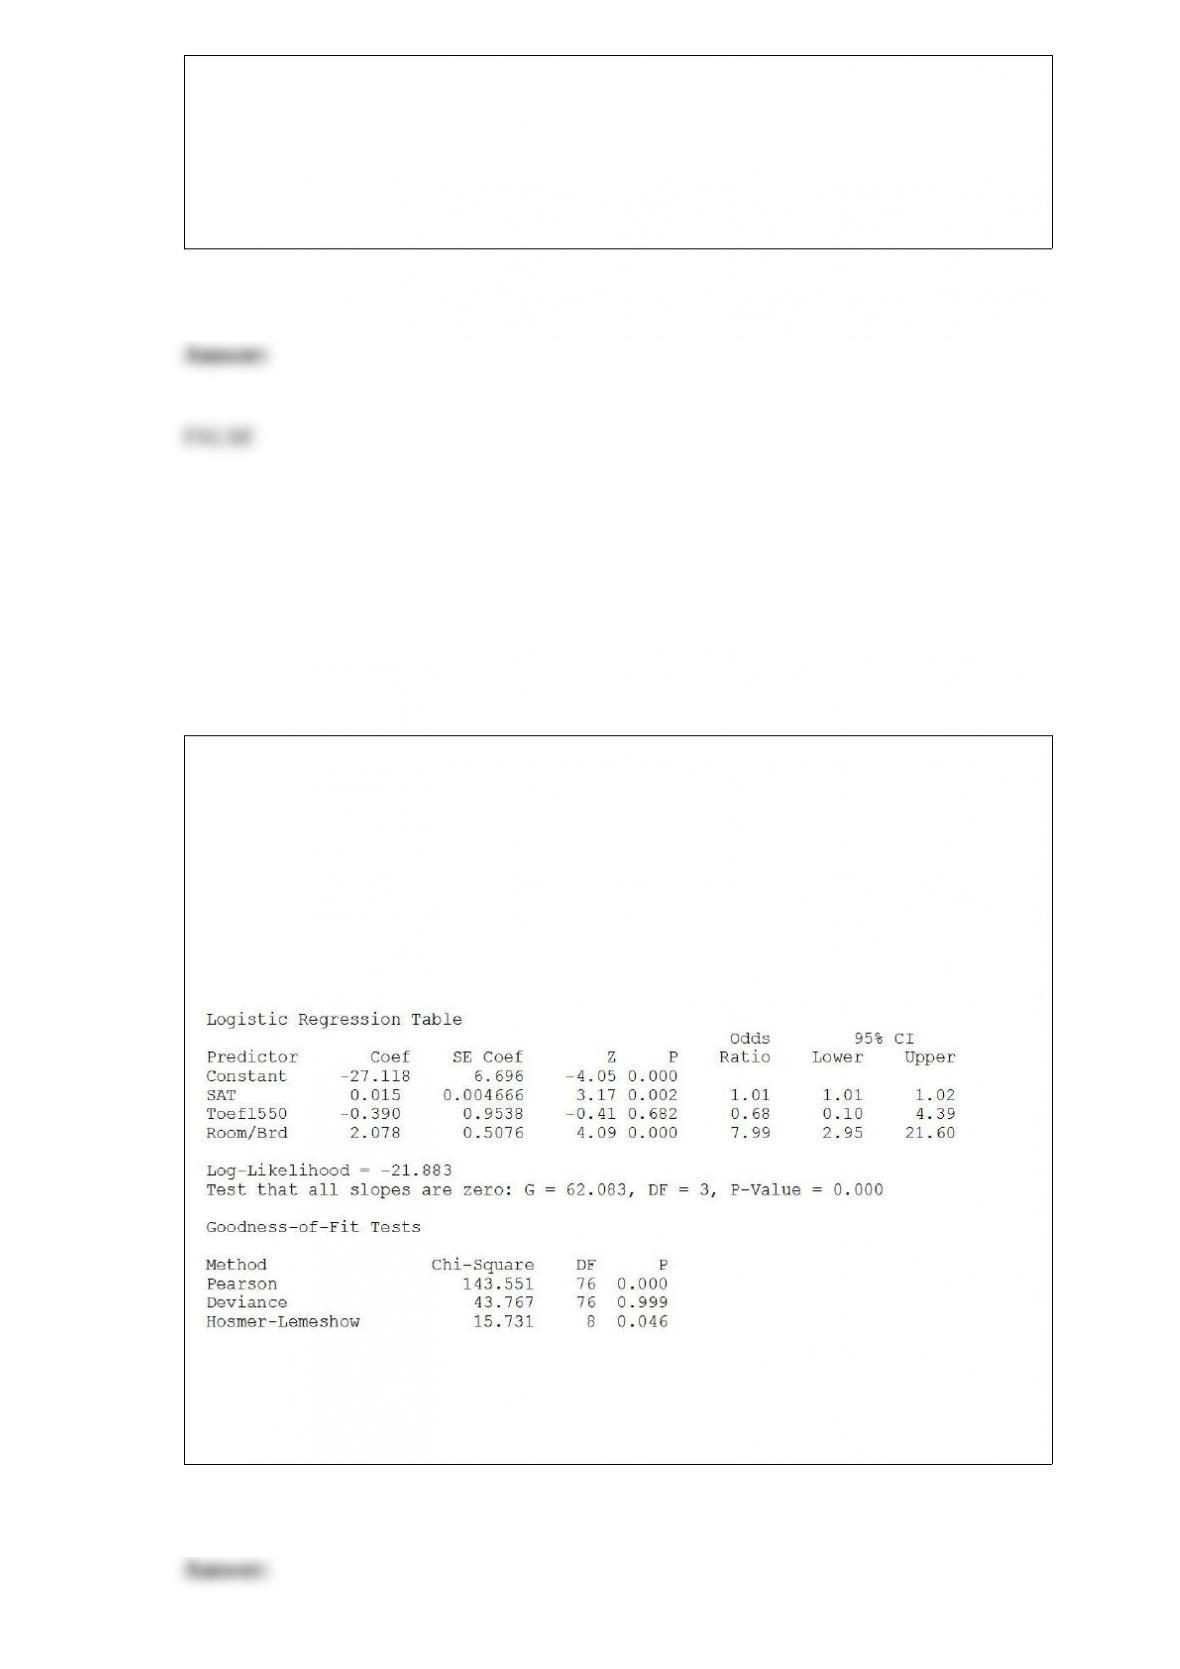
True or False: TABLE 17-11
A logistic regression model was estimated in order to predict the probability that a
randomly chosen university or college would be a private university using information
on mean total Scholastic Aptitude Test score (SAT) at the university or college, the
room and board expense measured in thousands of dollars (Room/Brd), and whether the
TOEFL criterion is at least 550 (Toefl550 = 1 if yes, 0 otherwise.) The dependent
variable, Y, is school type (Type = 1 if private and 0 otherwise).
Referring to Table 17-11, there is not enough evidence to conclude that Toefl500 makes
a significant contribution to the model in the presence of the other independent
variables at a 0.05 level of significance.
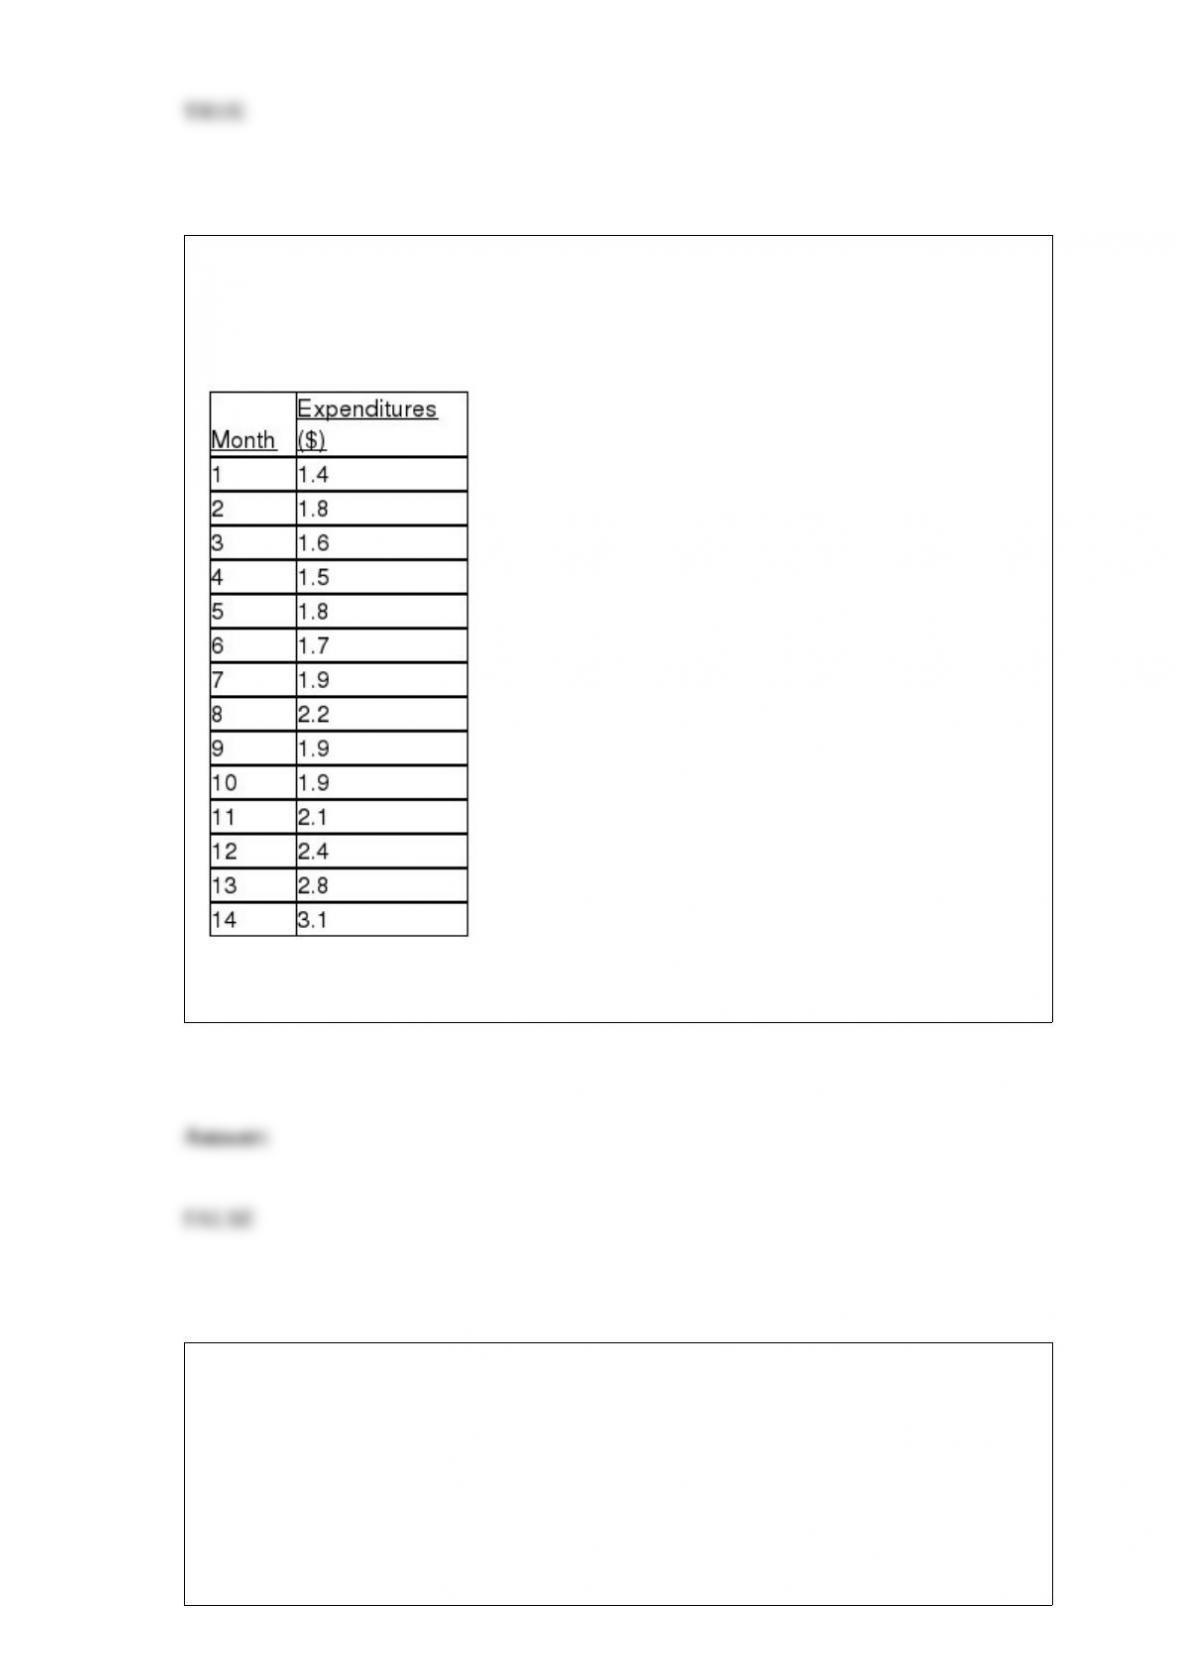
TABLE 16-2
The monthly advertising expenditures of a department store chain (in $1,000,000s)
were collected over the last decade. The last 14 months of this time series follows:
True or False: Referring to Table 16-2, advertising expenditures appear to be increasing
in a linear rather than curvilinear manner over time.
TABLE 9-1
Microsoft Excel was used on a set of data involving the number of defective items
found in a random sample of 46 cases of light bulbs produced during a morning shift at
a plant. A manager wants to know if the mean number of defective bulbs per case is
greater than 20 during the morning shift. She will make her decision using a test with a
level of significance of 0.10. The following information was extracted from the
Microsoft Excel output for the sample of 46 cases:
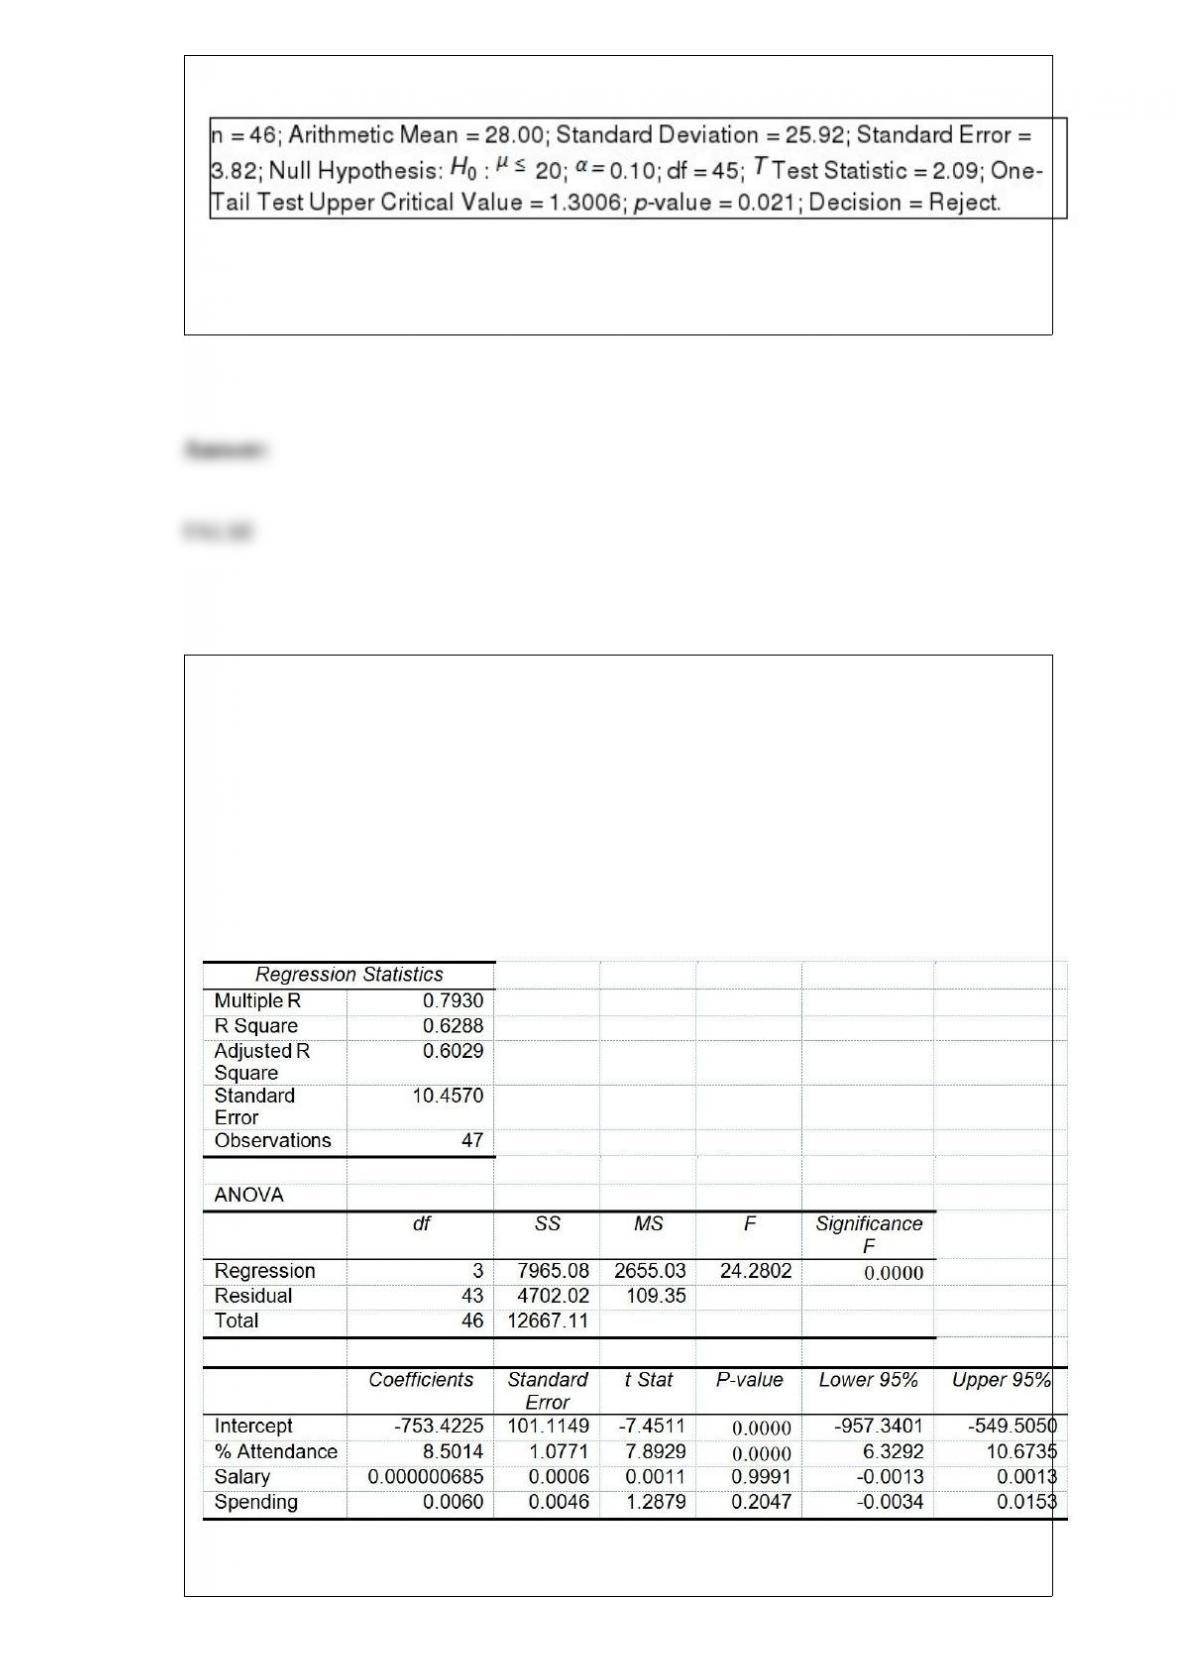
True or False: Referring to Table 9-1, the evidence proves beyond a doubt that the mean
number of defective bulbs per case is greater than 20 during the morning shift.
True or False: TABLE 17-8
The superintendent of a school district wanted to predict the percentage of students
passing a sixth-grade proficiency test. She obtained the data on percentage of students
passing the proficiency test (% Passing), daily mean of the percentage of students
attending class (% Attendance), mean teacher salary in dollars (Salaries), and
instructional spending per pupil in dollars (Spending) of 47 schools in the state.
Following is the multiple regression output with Y = % Passing as the dependent
variable, X1 = % Attendance, X2 = Salaries and X3 = Spending:
Referring to Table 17-8, there is sufficient evidence that instructional spending per pupil
has an effect on the percentage of students passing the proficiency test while holding
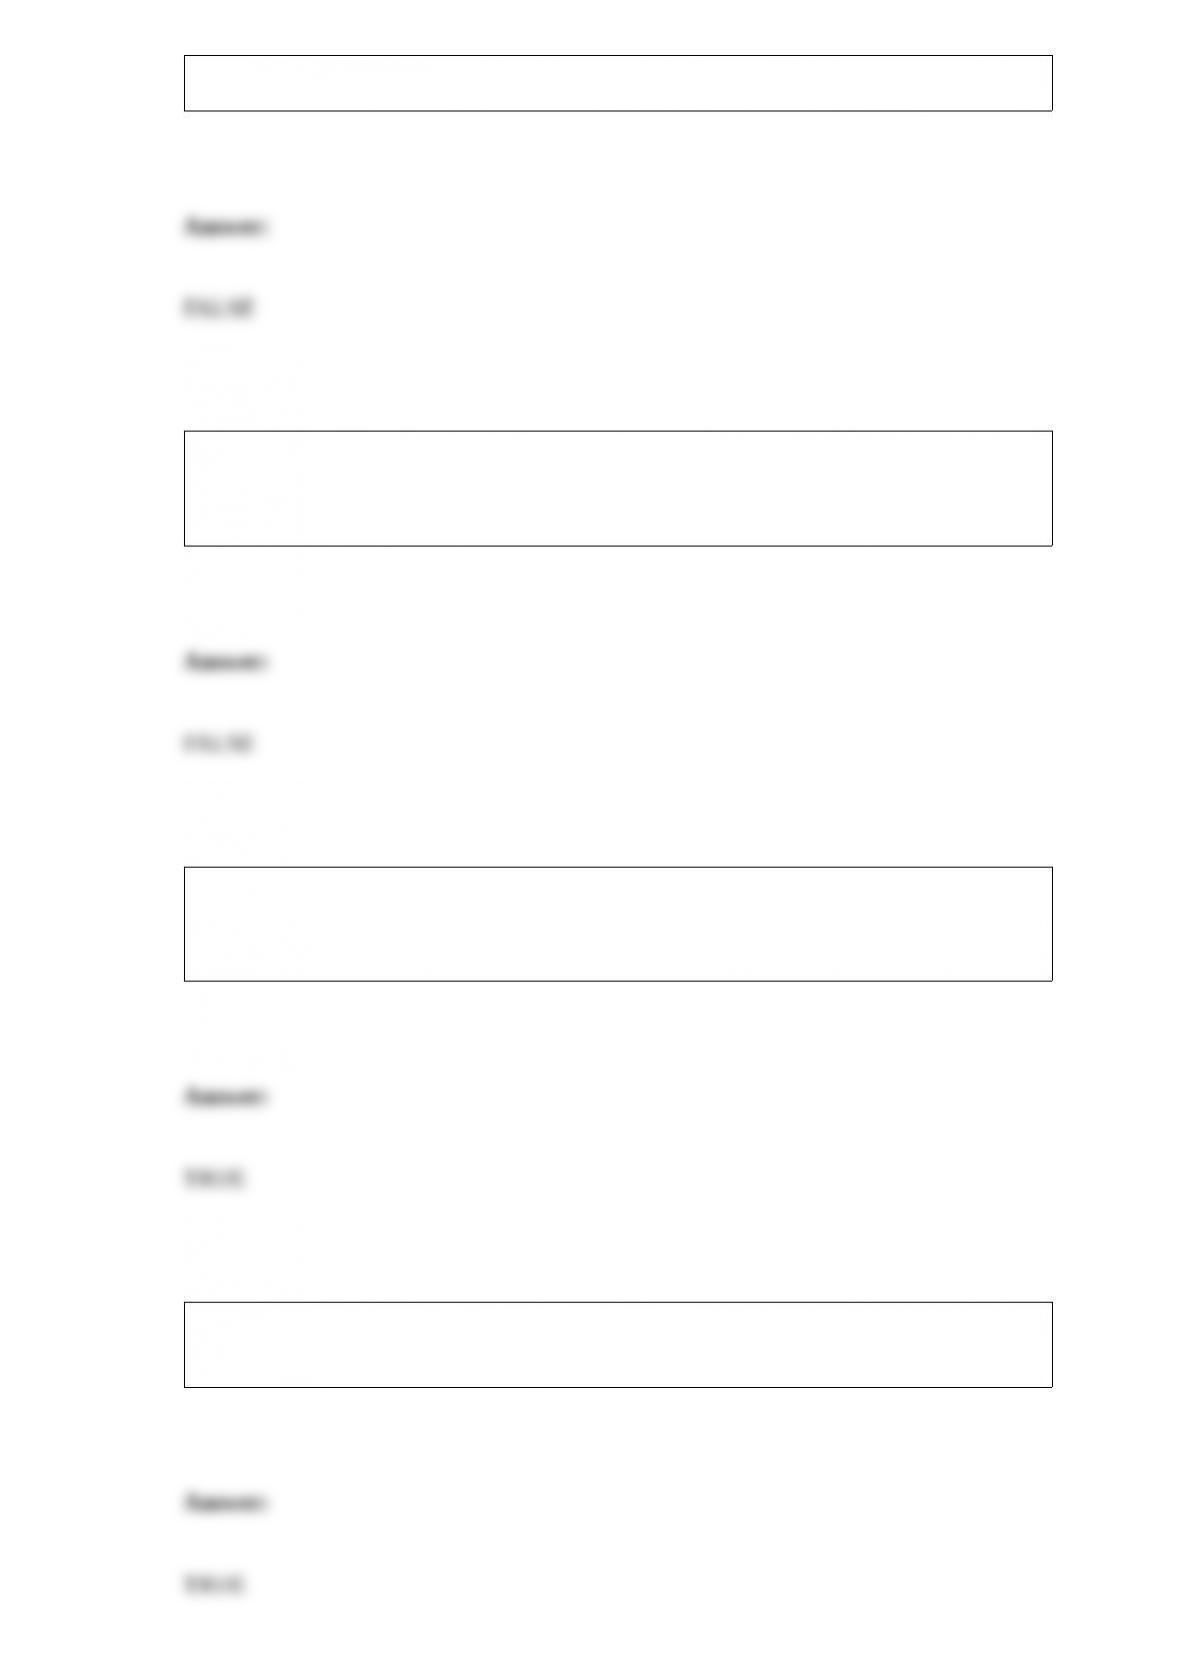
constant the effect of all the other independent variables at a 5% level of significance.
True or False: To determine the probability of getting fewer than 3 events of interest in
a binomial distribution, you will find the area under the normal curve for X = 3.5 and
below.
True or False: In a business statistics class students sit randomly without particular
preferences. A sample is selected by including everybody who sits in the first row. This
is an example of a cluster sample.
True or False: The slopes in a multiple regression model are called net regression
coefficients.
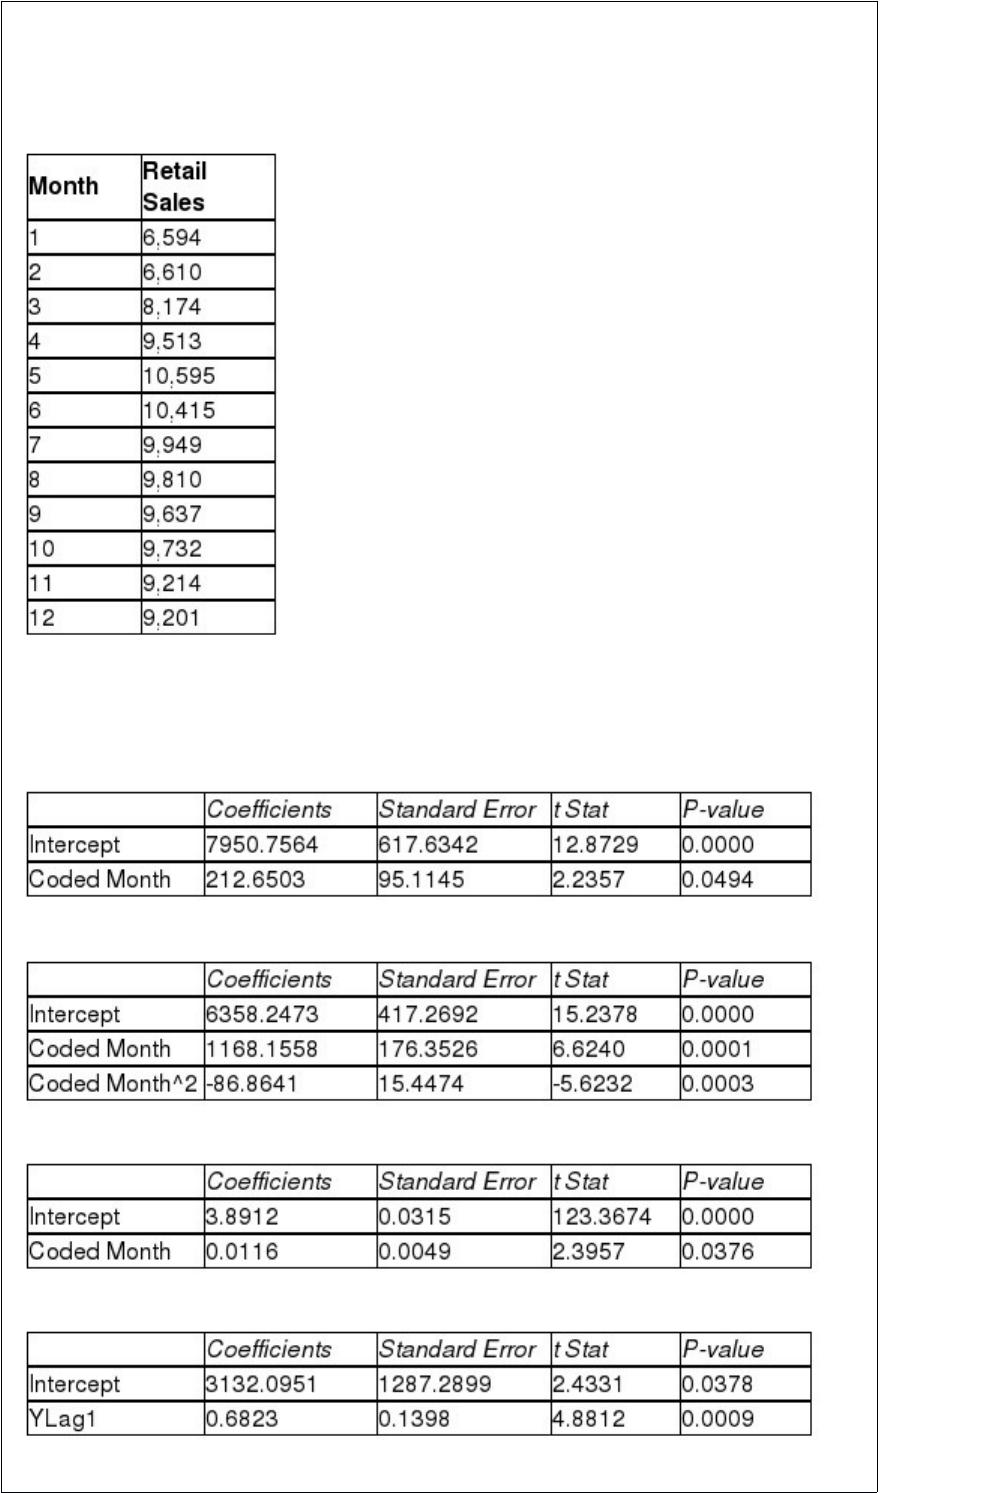
TABLE 16-13
Given below is the monthly time-series data for U.S. retail sales of building materials
over a specific year.
The results of the linear trend, quadratic trend, exponential trend, first-order
autoregressive, second-order autoregressive and third-order autoregressive model are
presented below in which the coded month for the 1st month is 0:
Linear trend model:
Quadratic trend model:
Exponential trend model:
First-order autoregressive:
Second-order autoregressive:
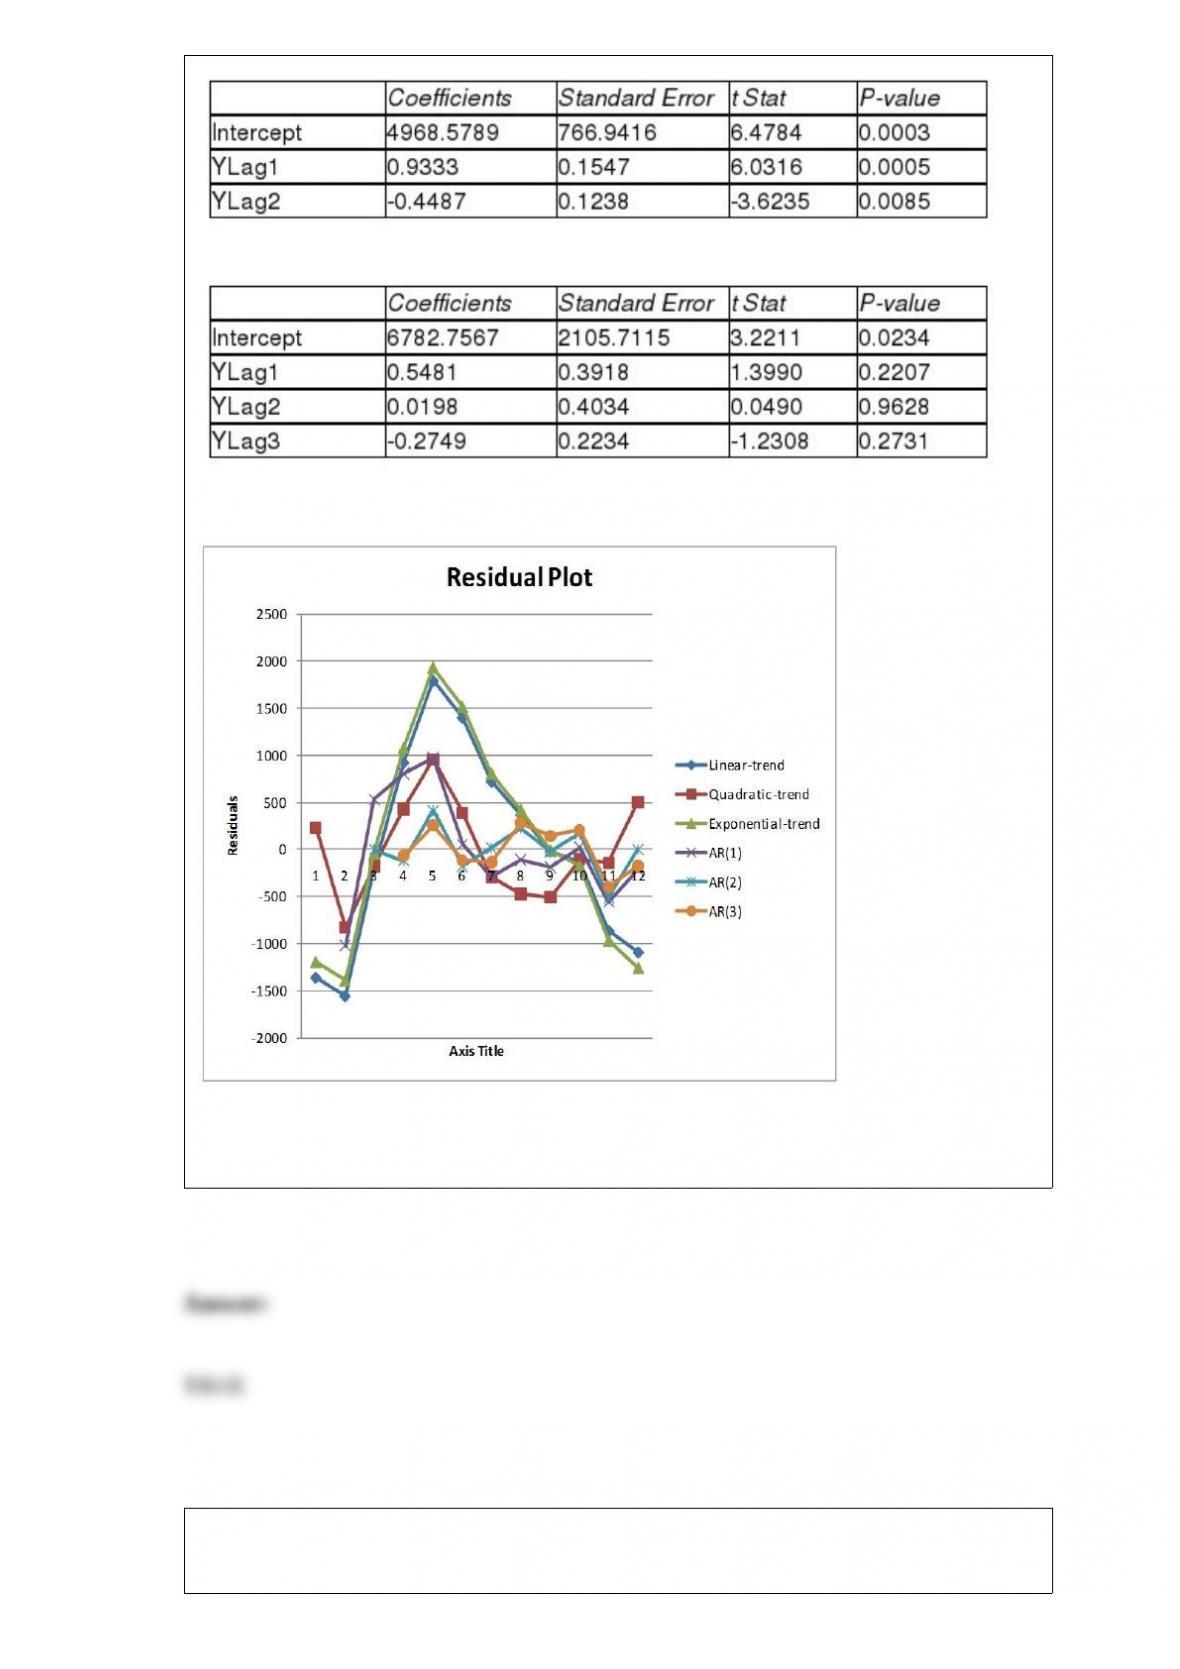
Third-order autoregressive:
Below is the residual plot of the various models:
True or False: Referring to Table 16-13, you can reject the null hypothesis for testing
the appropriateness of the second-order autoregressive model at the 5% level of
significance.
True or False: “Is the intended sample size large enough to achieve the desired power of
the test for the level of significance chosen?” should be among the questions asked
when performing a hypothesis test.
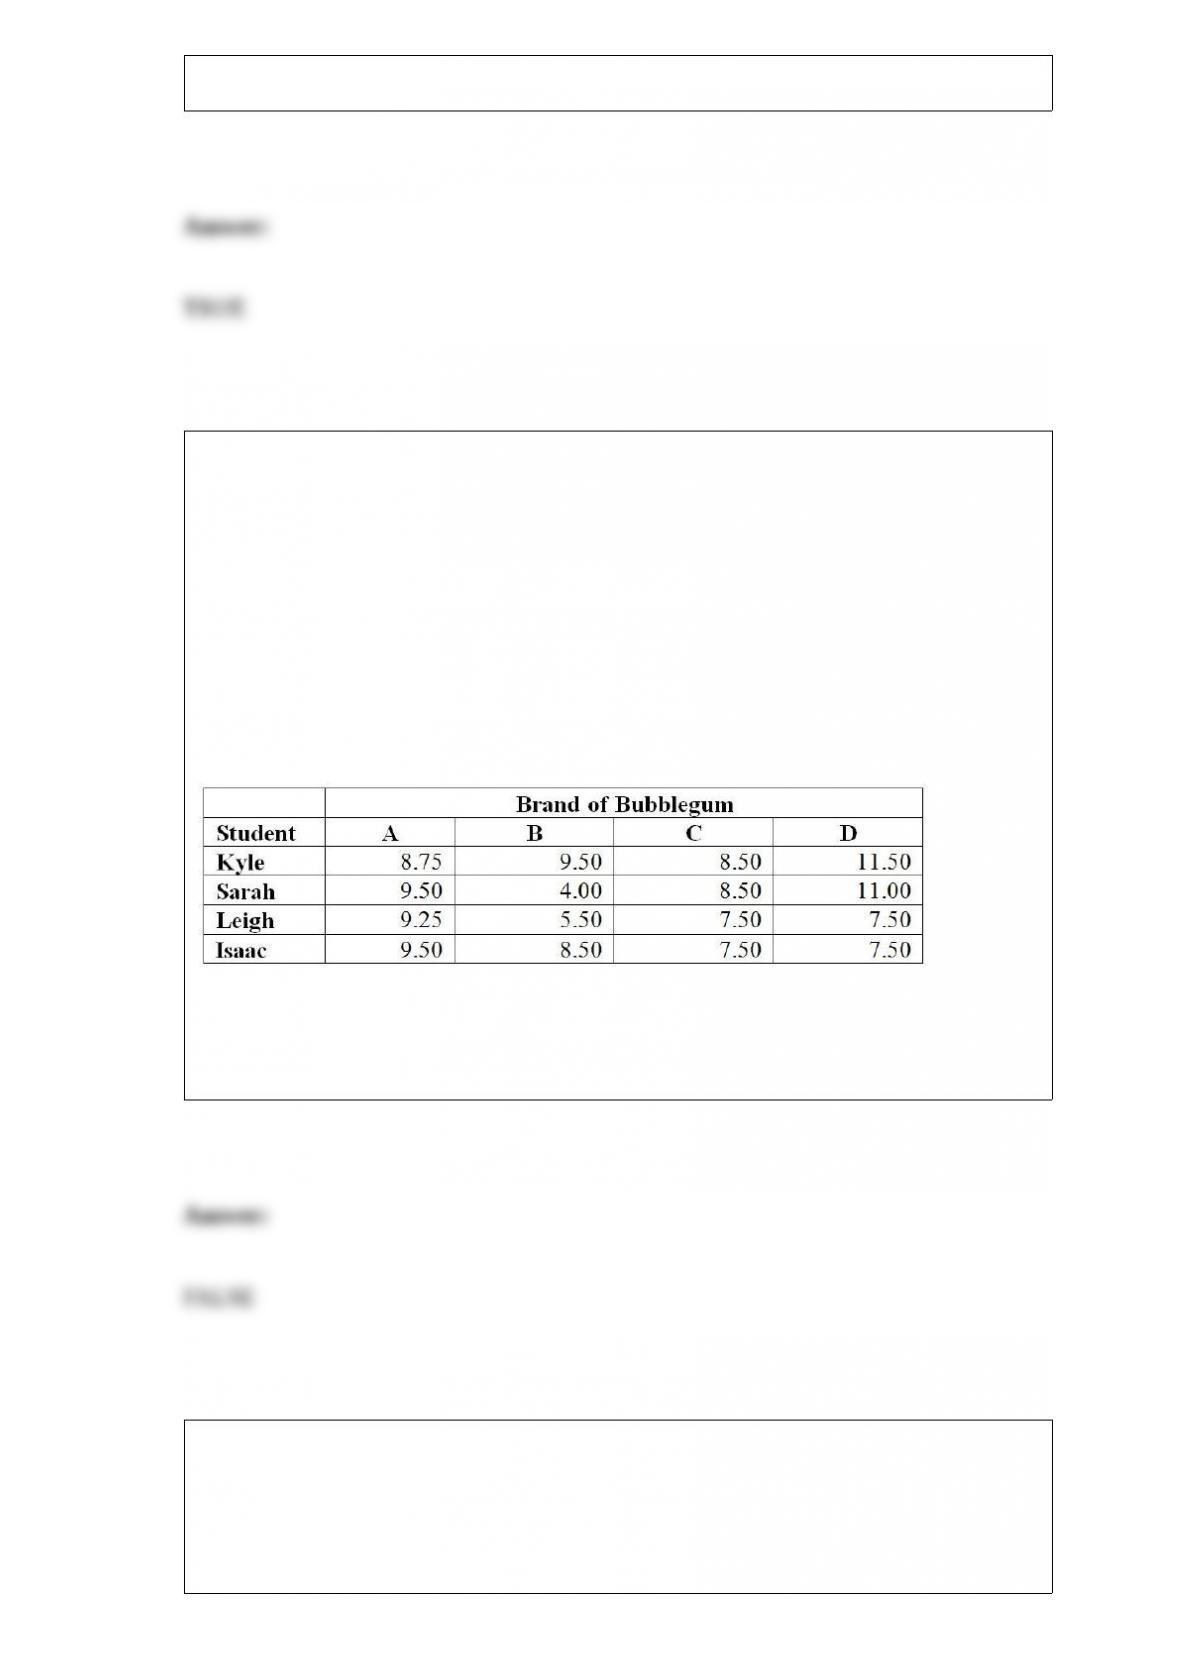
TABLE 11-11
A student team in a business statistics course designed an experiment to investigate
whether the brand of bubblegum used affected the size of bubbles they could blow. To
reduce the person-to-person variability, the students decided to use a randomized block
design using themselves as blocks.
Four brands of bubblegum were tested. A student chewed two pieces of a brand of gum
and then blew a bubble, attempting to make it as big as possible. Another student
measured the diameter of the bubble at its biggest point. The following table gives the
diameters of the bubbles (in inches) for the 16 observations.
True or False: Referring to Table 11-11, the decision made at a 0.05 level of
significance on the randomized block F test for the difference in means implies that all
4 means are significantly different.
TABLE 8-17
A random sample of 100 stores from a large chain of 500 garden supply stores was
selected to determine the mean number of lawnmowers sold at an end-of-season
clearance sale. The sample results indicated a mean of 6 and a standard deviation of 2
lawnmowers sold. A 95% confidence interval (5.623 to 6.377) was established based on
these results.
True or False: Referring to Table 8-17, if the population had consisted of 400 stores, the
confidence interval estimate of the mean with finite population correction would have
been wider in range.
True or False: TABLE 17-6
A weight-loss clinic wants to use regression analysis to build a model for weight loss of
a client (measured in pounds). Two variables thought to affect weight loss are client’s
length of time on the weight-loss program and time of session. These variables are
described below:
Y = Weight loss (in pounds)
X1 = Length of time in weight-loss program (in months)
X2 = 1 if morning session, 0 if not
X3 = 1 if afternoon session, 0 if not (Base level = evening session)
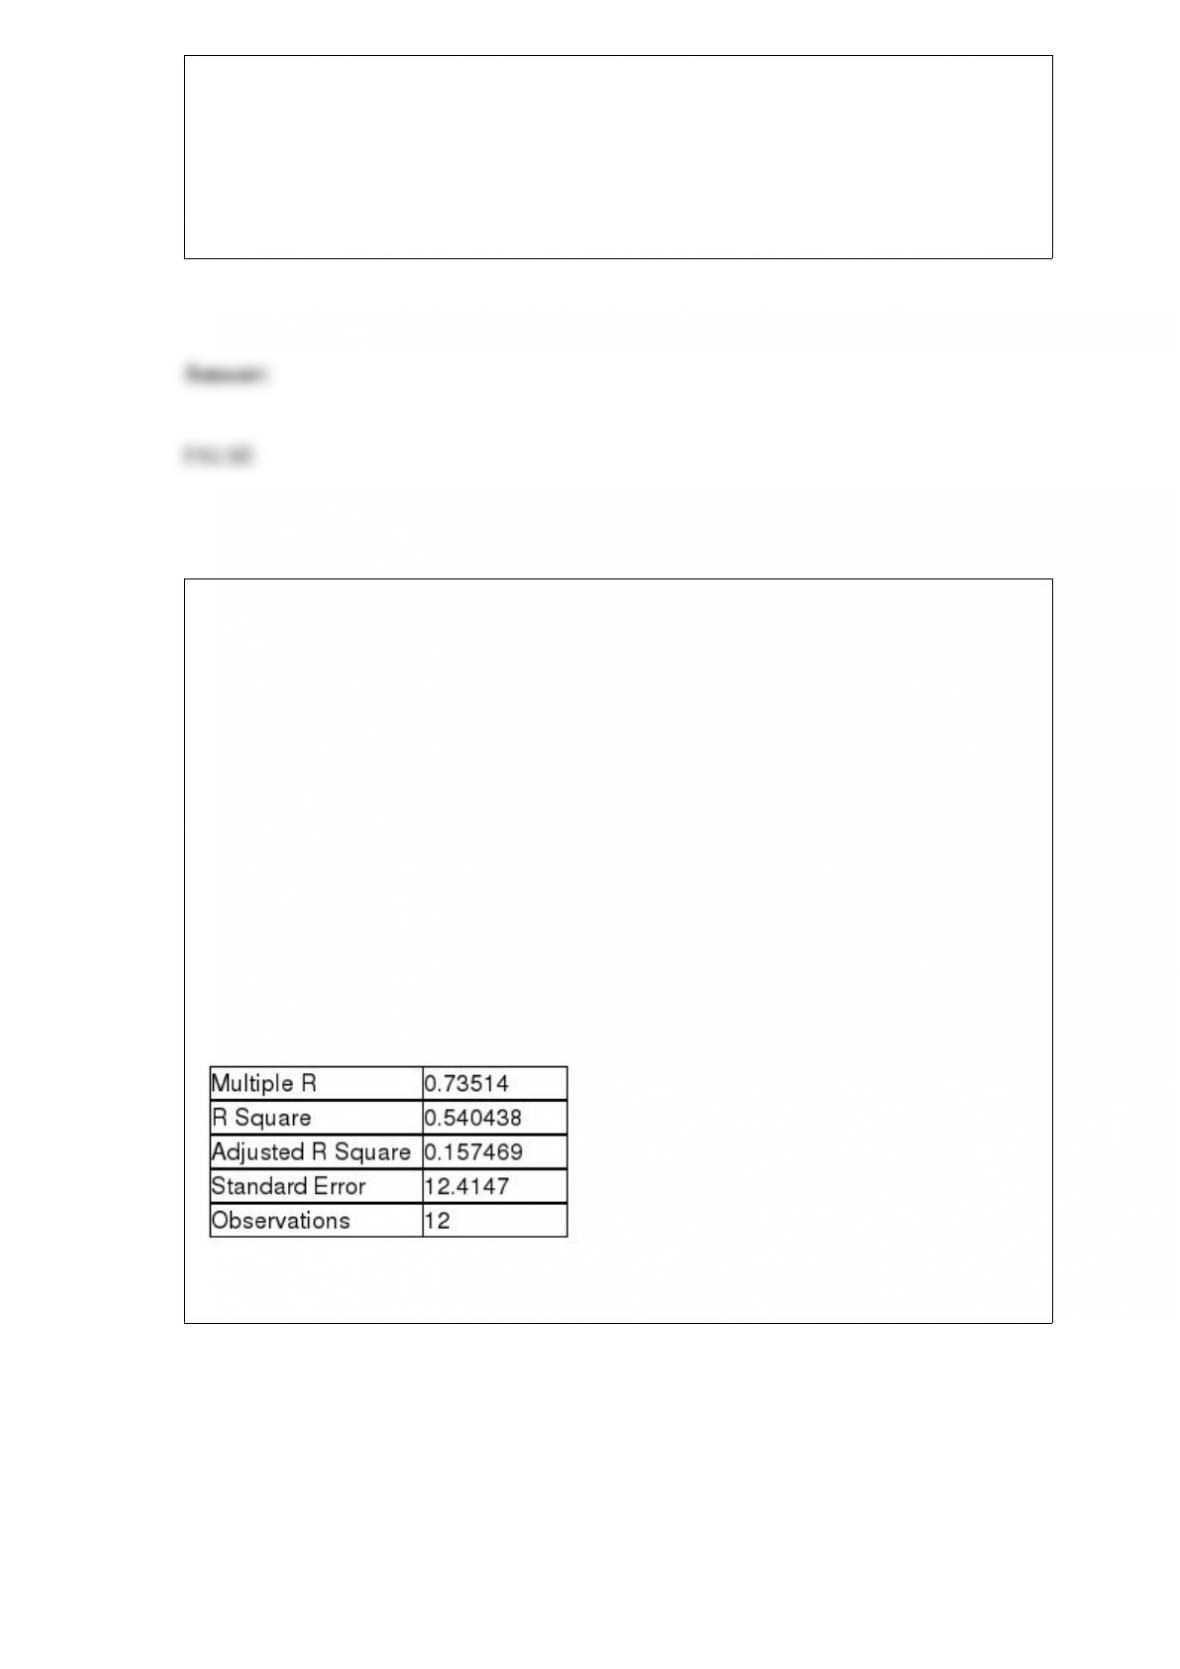
Data for 12 clients on a weight-loss program at the clinic were collected and used to fit
the interaction model:
Y = β0 + β1X1 + β2X2 + β3X3 + β4X1X2 + β5X1X3 + ε
Partial output from Microsoft Excel follows:
Regression Statistics
ANOVA
F = 5.41118 Significance F = 0.040201
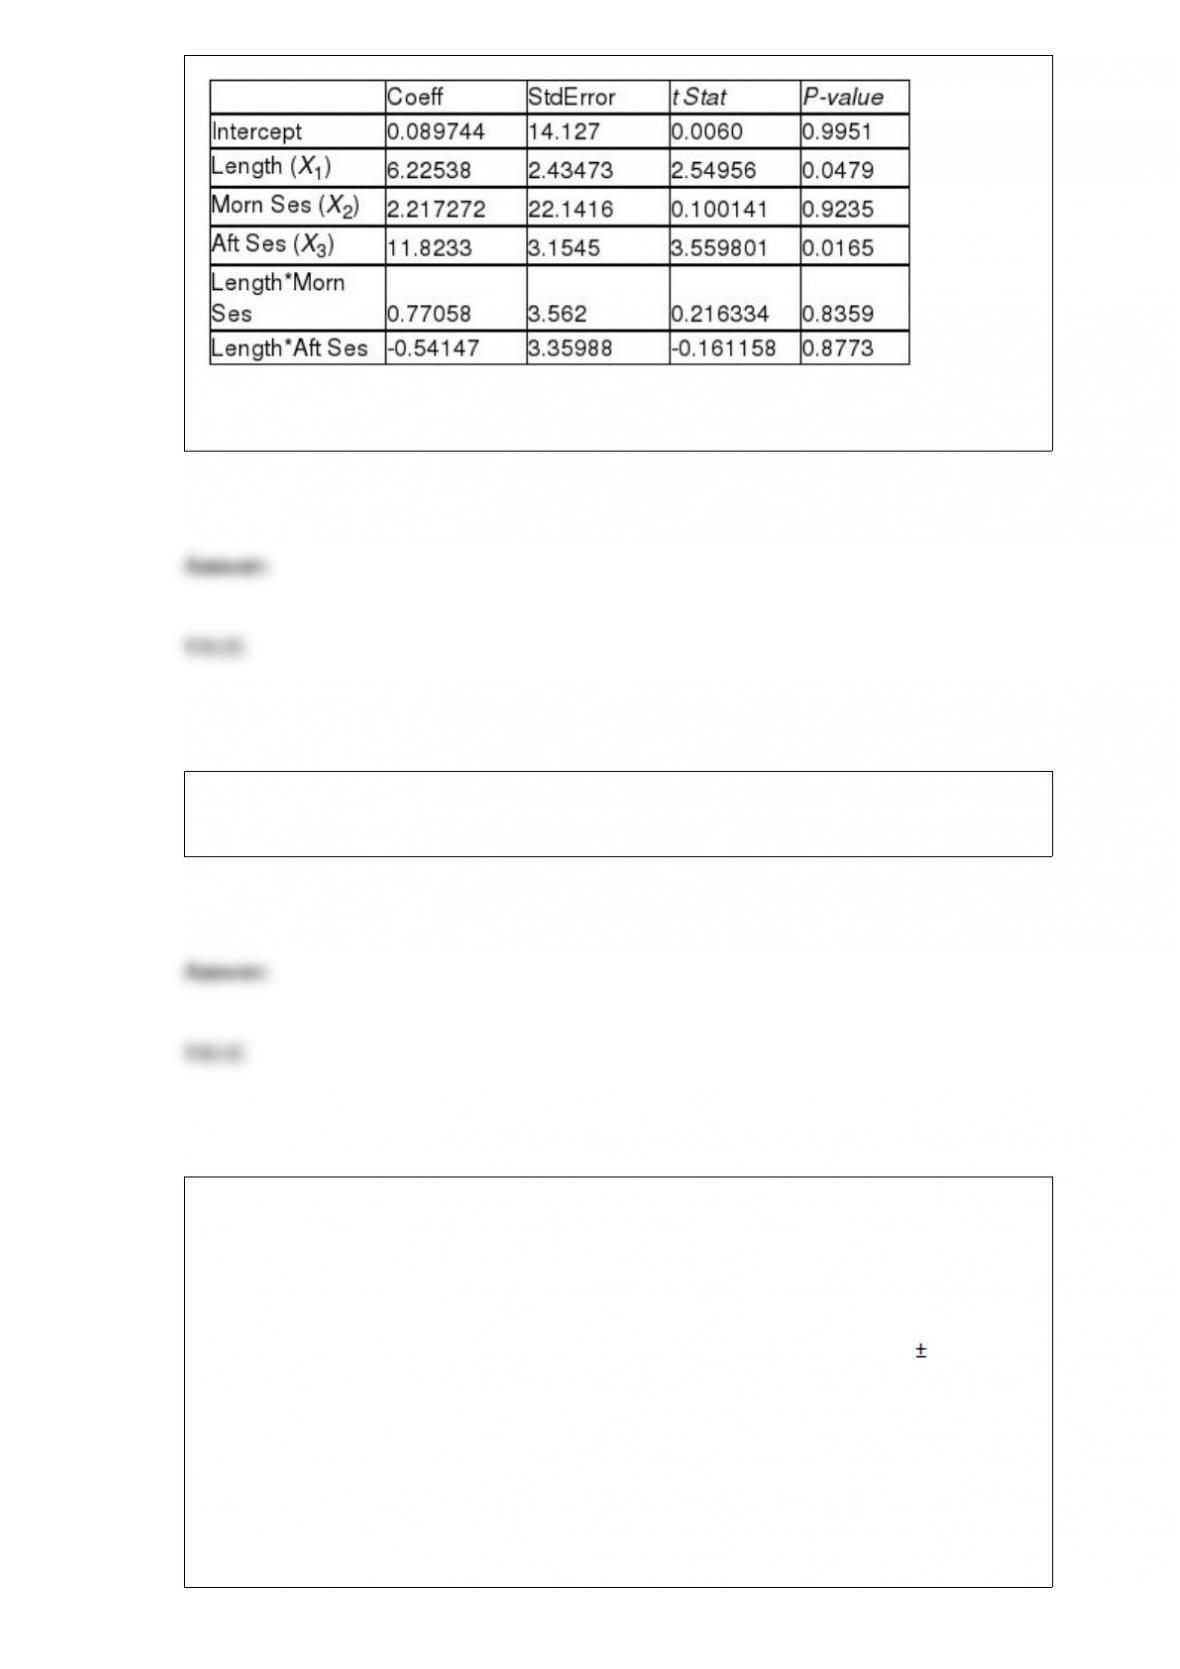
Referring to Table 17-6, the overall model for predicting weight loss (Y) is statistically
significant at the 0.05 level.
True or False: In a boxplot, the box portion represents the data between the first and
third quartile values.
TABLE 8-11
A poll was conducted by the marketing department of a video game company to
determine the popularity of a new game that was targeted to be launched in three
months. Telephone interviews with 1,500 young adults were conducted which revealed
that 49% said they would purchase the new game. The margin of error was 3
percentage points.
Referring to Table 8-11, 1,500 is the size of the
A) population.
B) sample.
C) frame.
D) proportion.
The director of admissions at a state college is interested in seeing if admissions status
(admitted, waiting list, denied admission) at his college is related to the type of
community (urban, rural, suburban) in which an applicant resides. Which of the
following tests will be the most appropriate?
A) χ2 test for independence
B) Two-way ANOVA F test for the type of community effect
C) Two-way ANOVA F test for interaction effect
D) McNemar test
Which of the following sampling methods will more likely be susceptible to ethical
violation?
A) simple random sample
B) cluster sample
C) convenience sample
D) stratified sample
A Paso Robles wine producer wanted to forecast the cases of Merlot wine sold. The
number of cases of merlot wine sold in a 28-year period was collected. Which of the
following would be the most appropriate analysis to perform?
A) The Marascuilo Procedure
B) The Tukey-Kramer Procedure
C) Least-squares forecasting with monthly or quarterly data
D) Moving averages modeling
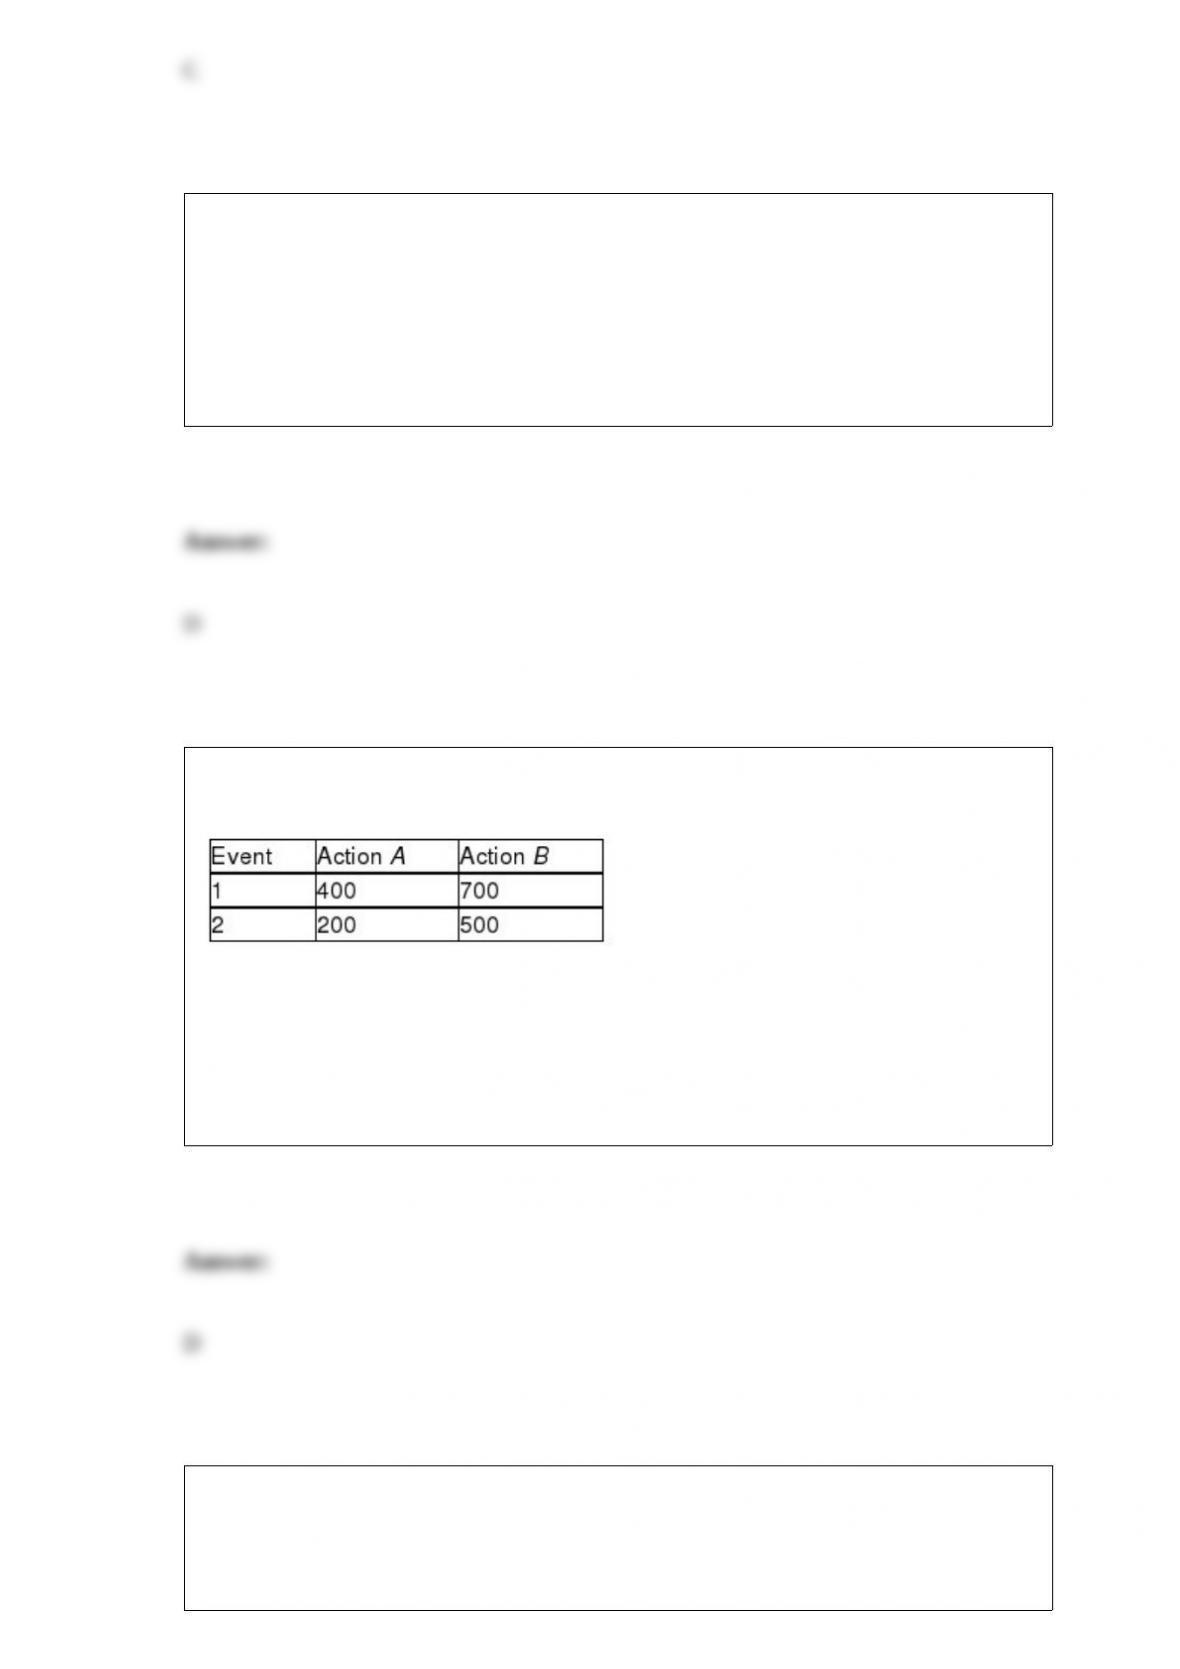
TABLE 19-2
The following payoff matrix is given in dollars.
Suppose the probability of Event 1 is 0.5 and Event 2 is 0.5.
Referring to Table 19-2, the expected profit under certainty (EPUC ) is
A) 0.
B) 300.
C) 500.
D) 600.
TABLE 12-13
Recent studies have found that American children are more obese than in the past. The
amount of time children spent watching television has received much of the blame. A
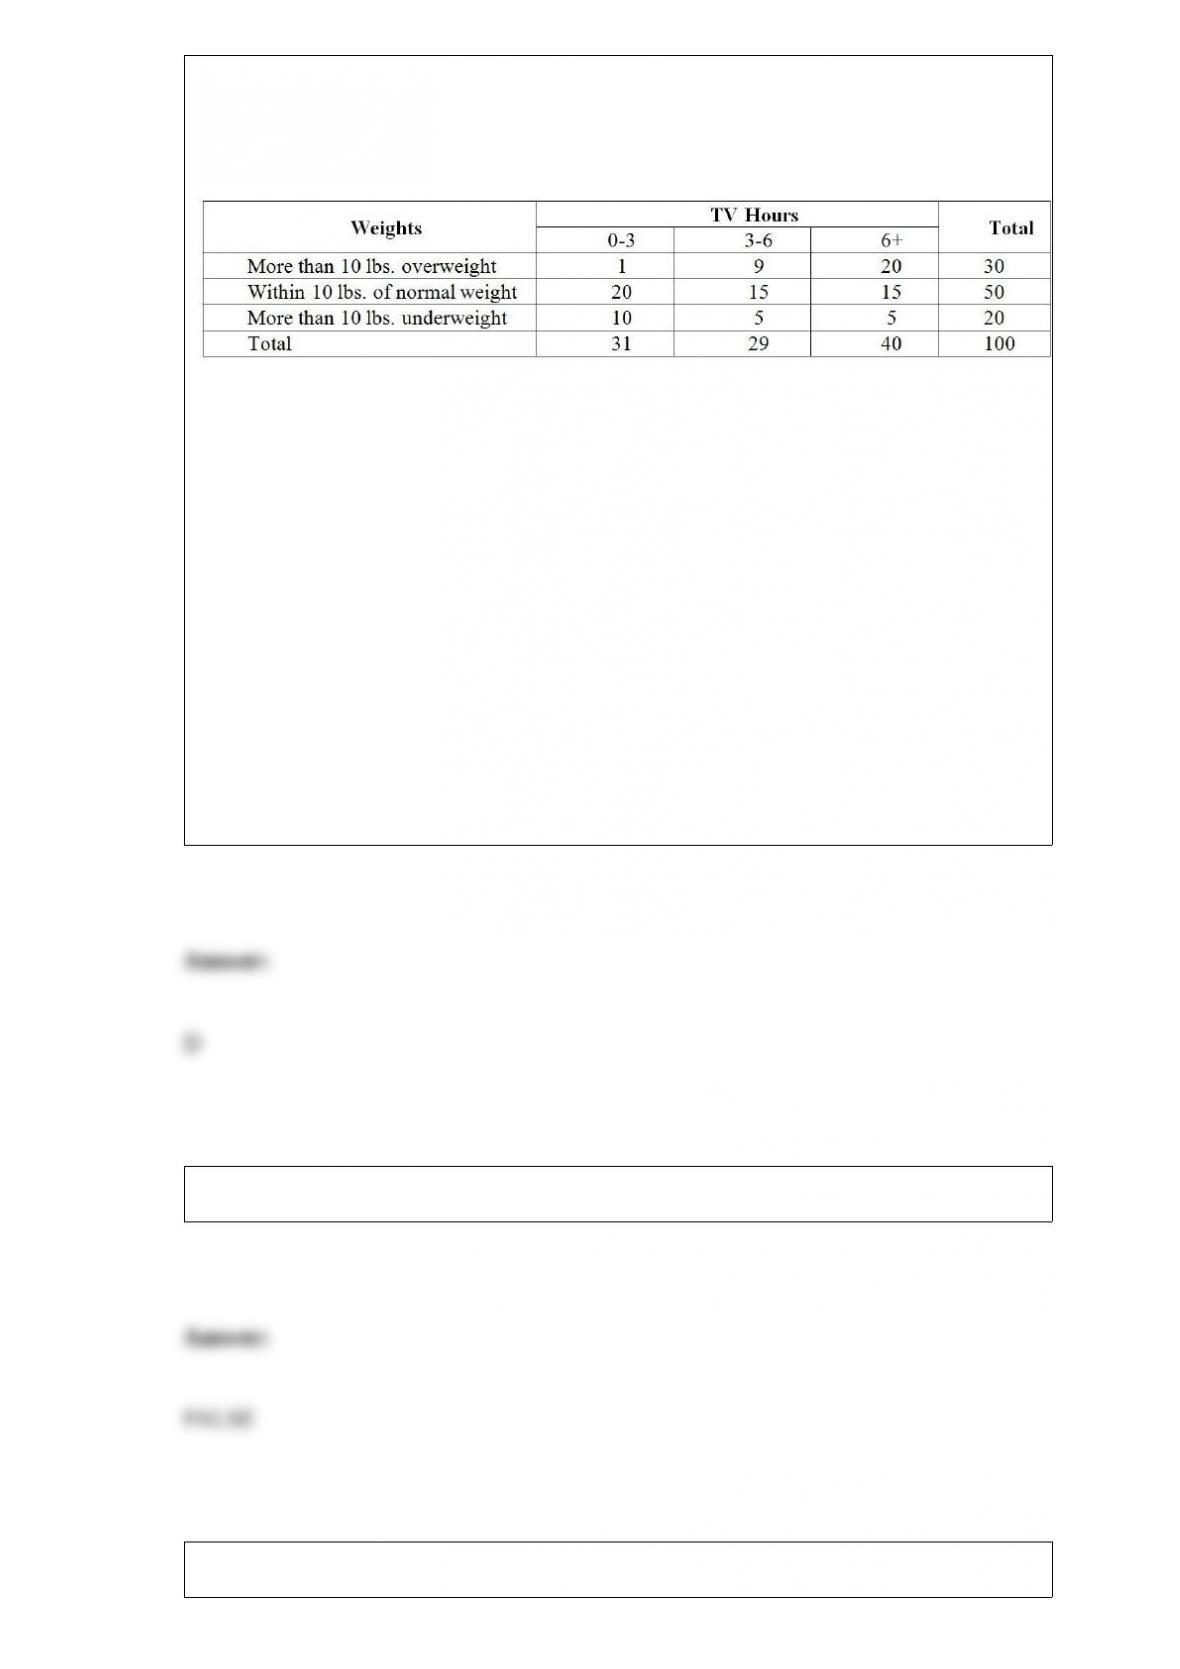
survey of 100 ten-year-olds revealed the following with regards to weights and average
number of hours a day spent watching television. We are interested in testing whether
the mean number of hours spent watching TV and weights are independent at 1% level
of significance.
Referring to Table 12-13, suppose the value of the test statistic was 30.00 (which is not
the correct value) and the critical value at 1% level of significance was 10.00 (which is
not the correct value), which of the following conclusions would be correct?
A) We will not reject the null and conclude that mean number of hours spent watching
TV and weights are independent.
B) We will reject the null and conclude that mean number of hours spent watching TV
and weights are independent.
C) We will not reject the null and conclude that mean number of hours spent watching
TV and weights are not independent.
D) We will reject the null and conclude that mean number of hours spent watching TV
and weights are not independent.
True or False: The coefficient of variation is a measure of central tendency in the data.
The standard error of the estimate is a measure of
A) total variation of the Y variable.
B) the variation around the sample regression line.
C) explained variation.
D) the variation of the X variable.
TABLE 4-4
Suppose that patrons of a restaurant were asked whether they preferred water or
whether they preferred soda. 70% said that they preferred water. 60% of the patrons
were male. 80% of the males preferred water.
True or False: Referring to Table 4-4, the two events “preferring water” and “preferring
soda” are independent.
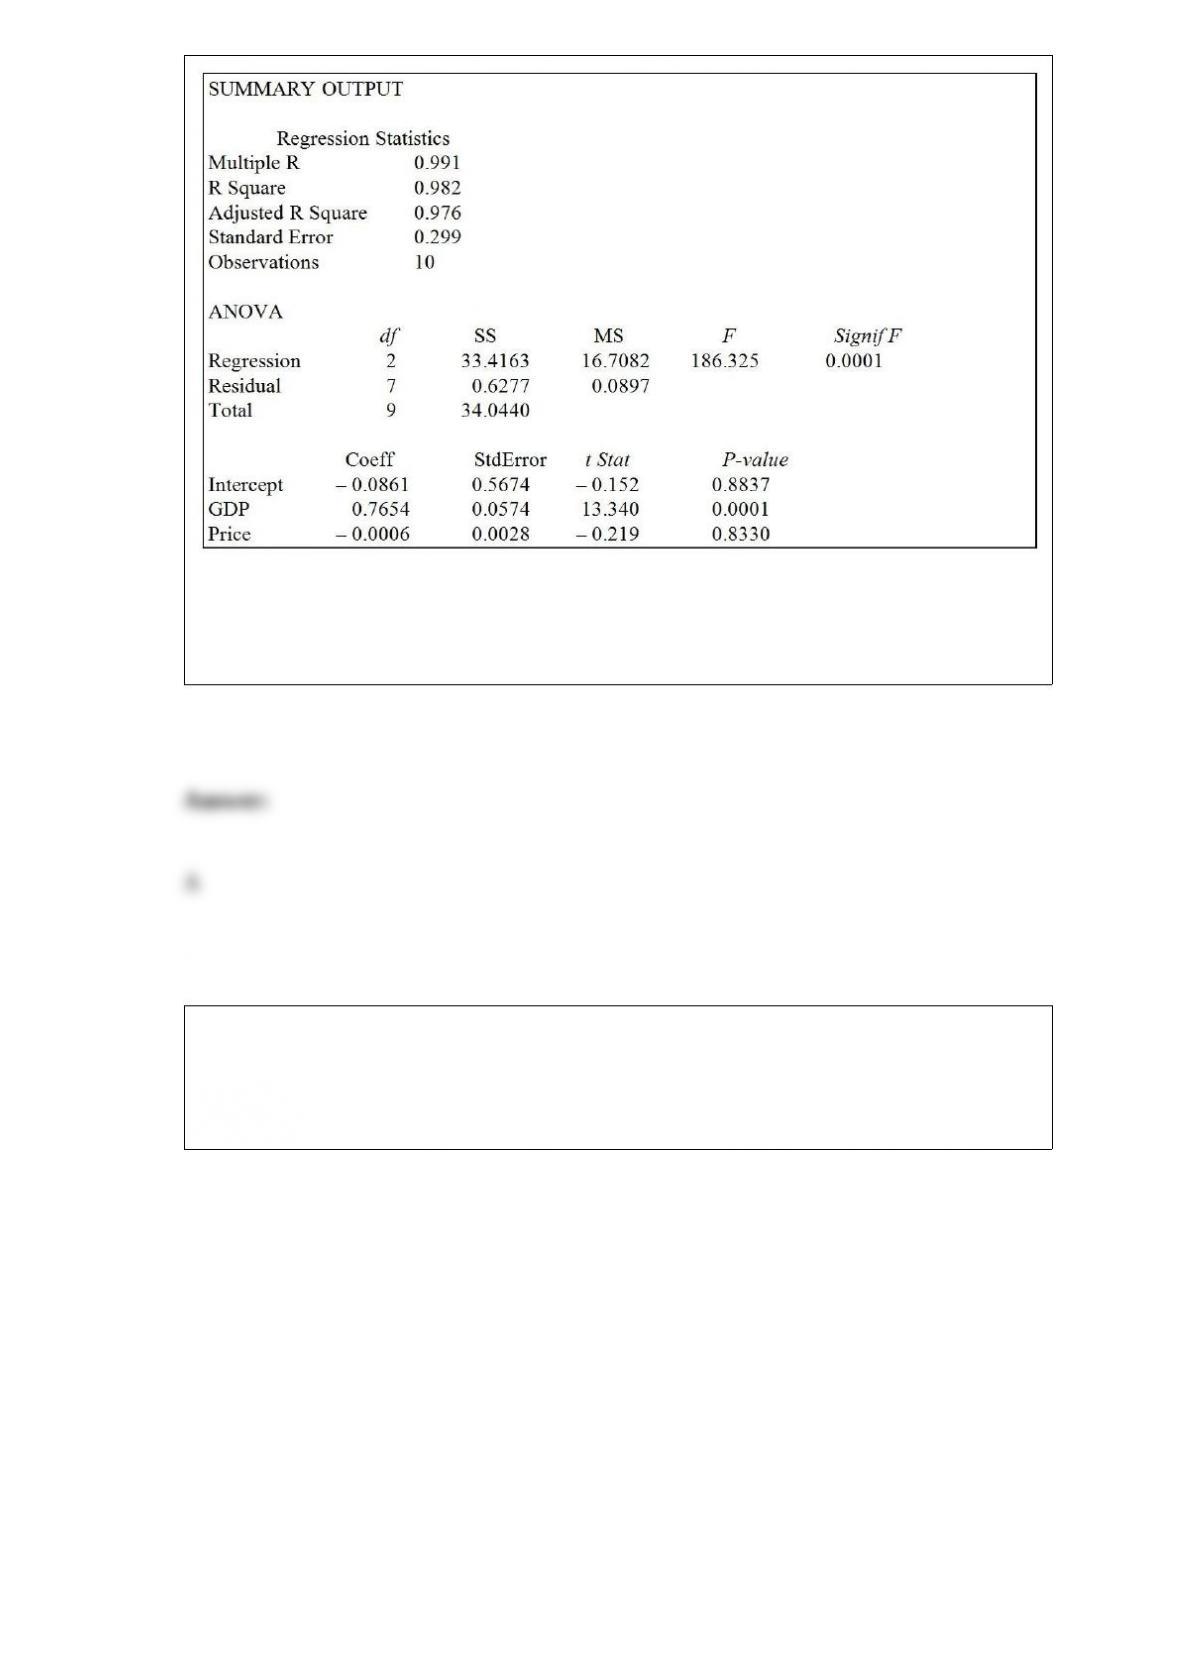
Referring to Table 14-3, what is the estimated mean consumption level for an economy
with GDP equal to $2 billion and an aggregate price index of 90?
TABLE 14-3
An economist is interested to see how consumption for an economy (in $ billions) is
influenced by gross domestic product ($ billions) and aggregate price (consumer price
index). The Microsoft Excel output of this regression is partially reproduced below.
A) $1.39 billion
B) $2.89 billion
C) $4.75 billion
D) $9.45 billion
TABLE 18-5
A manufacturer of computer disks took samples of 240 disks on 15 consecutive days.
The number of disks with bad sectors was determined for each of these samples. The
results are in the table that follows.
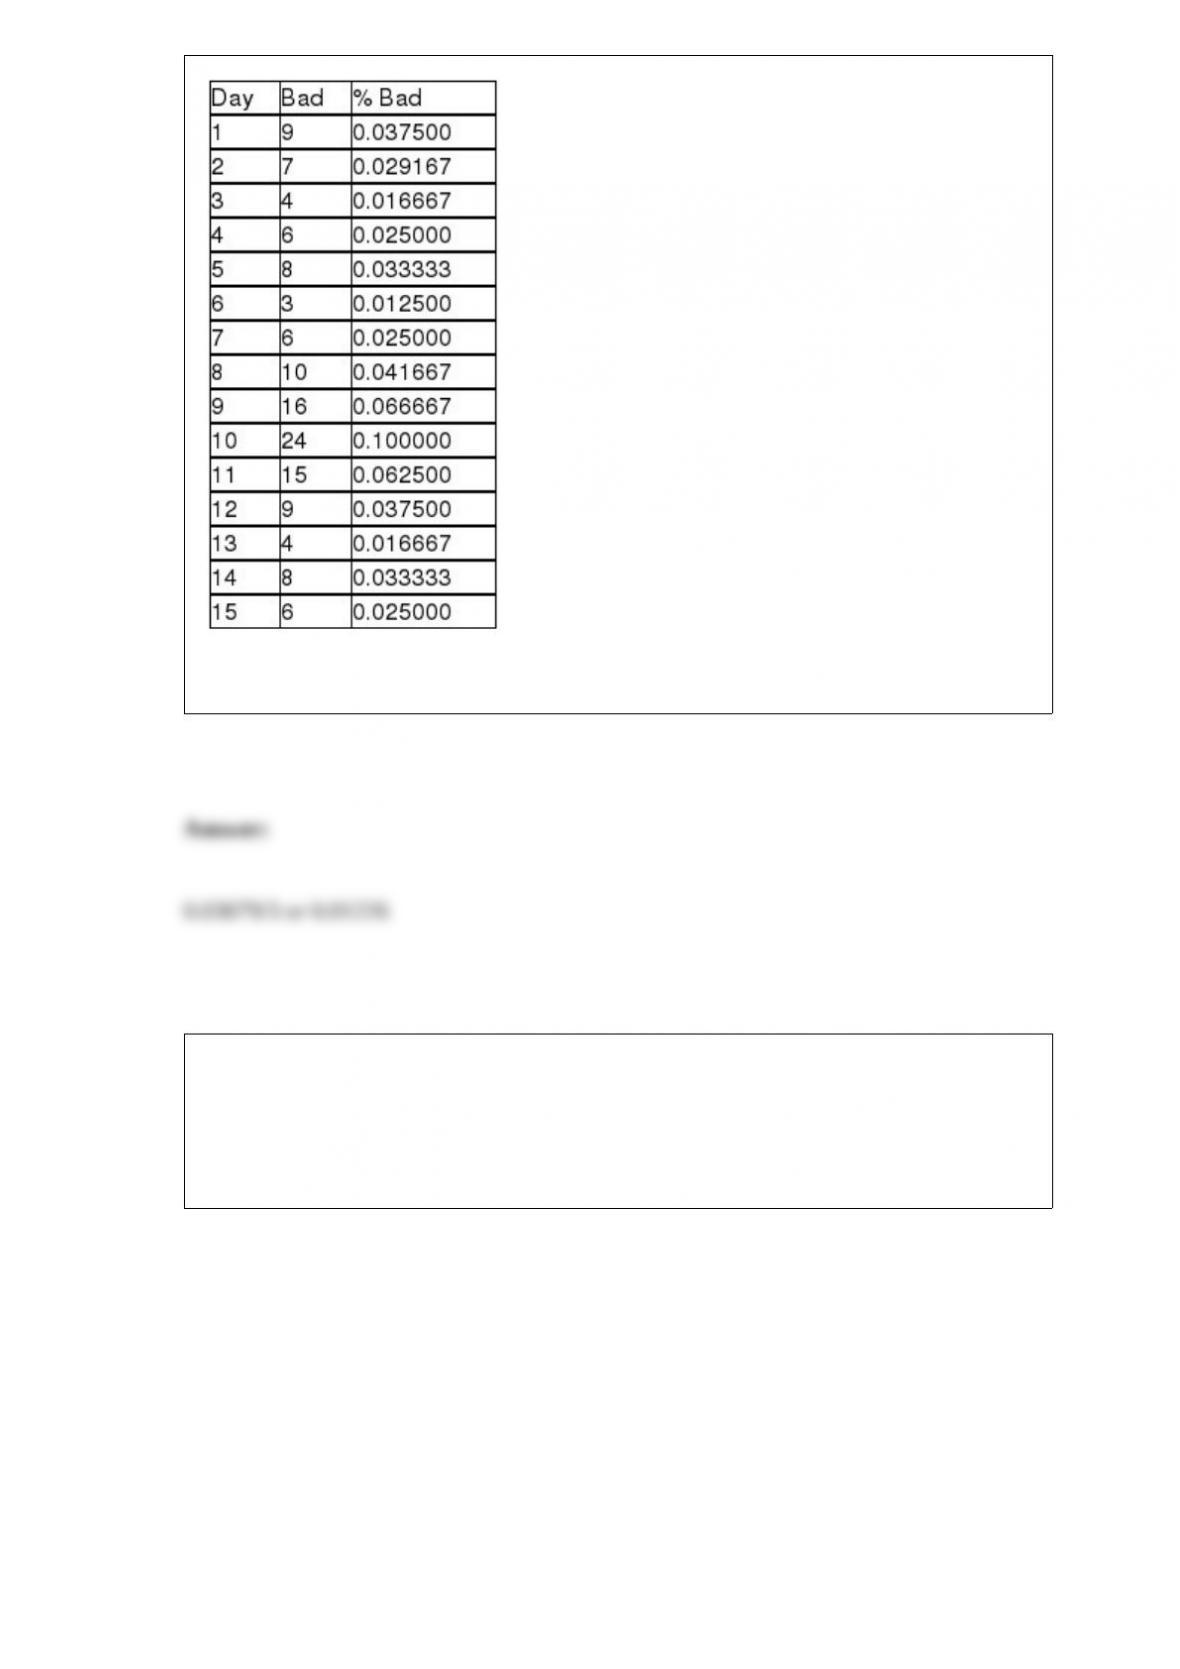
Referring to Table 18-5, a p control chart is to be made for these data. The estimate of
the standard error of the proportion of disks with bad sectors is ________.
TABLE 18-7
A supplier of silicone sheets for producers of computer chips wants to evaluate her
manufacturing process. She takes sample sizes of 5 from each day’s output and counts
the number of blemishes on each silicone sheet. The results from 20 days of such
evaluations are presented below.
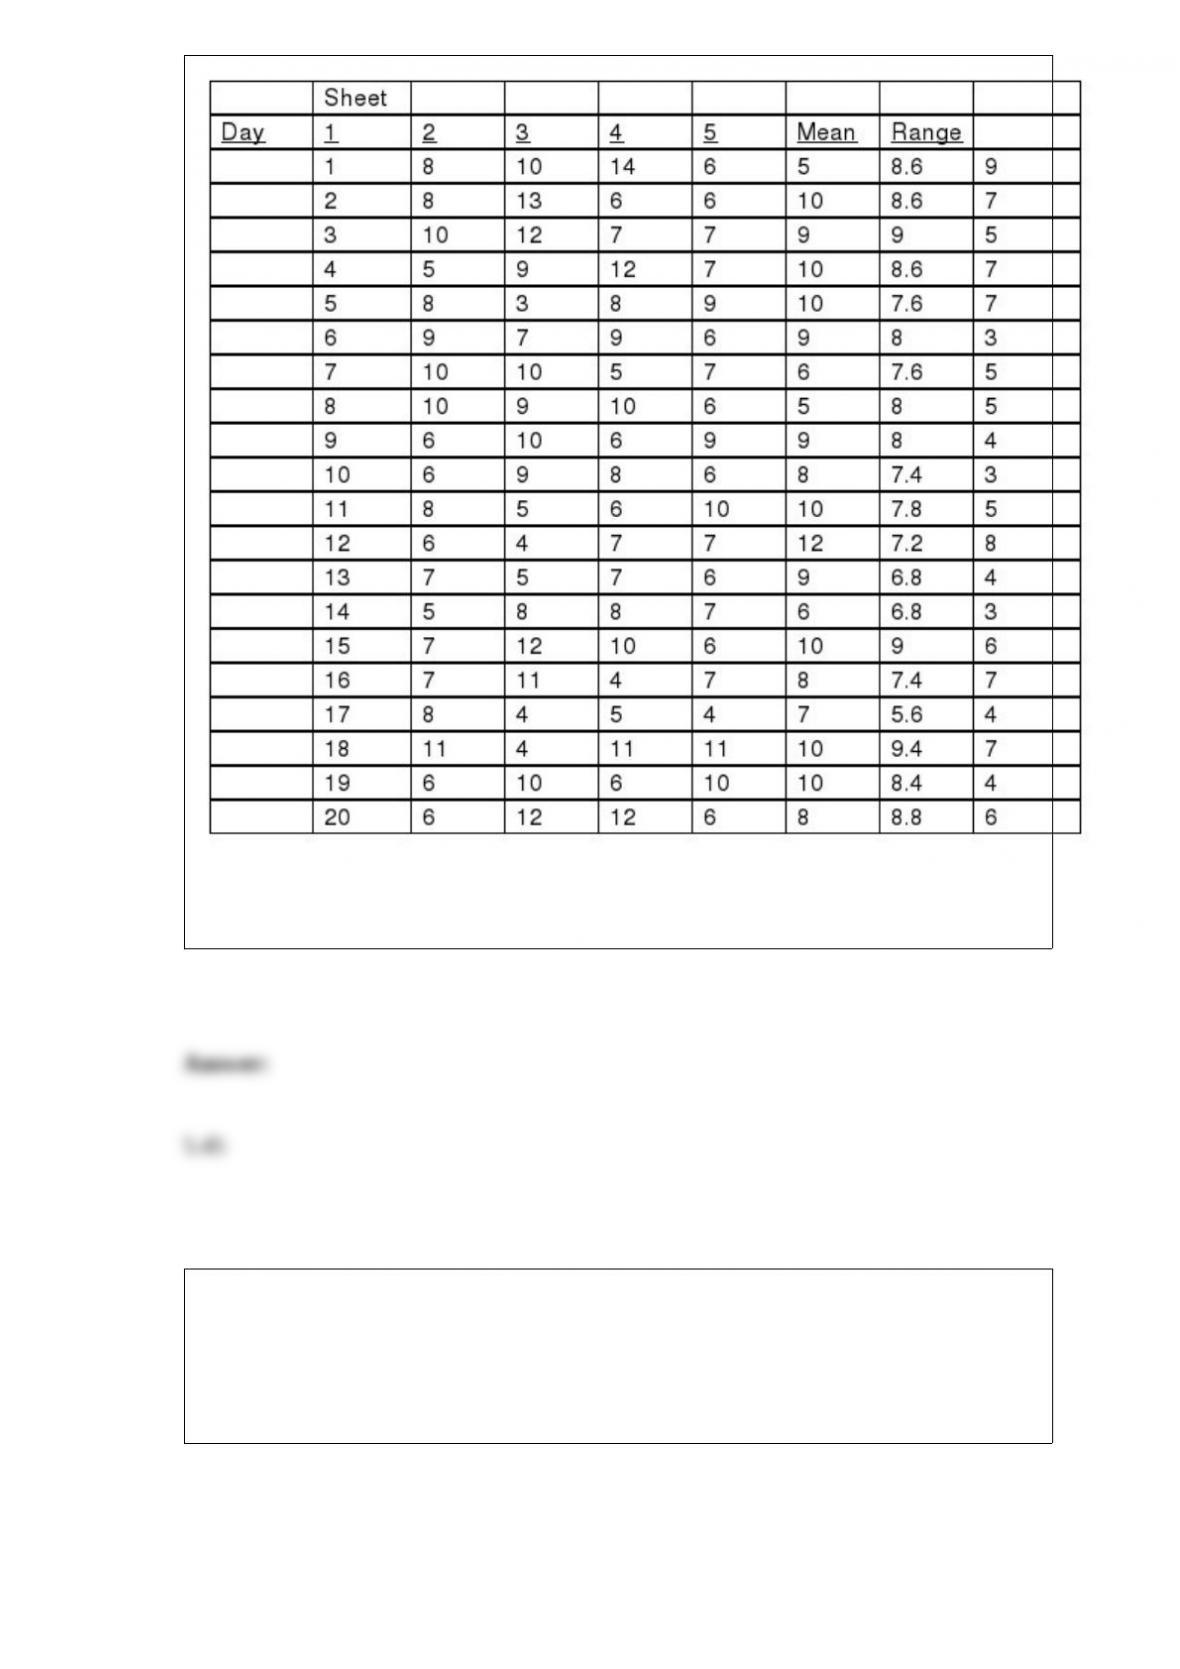
She also decides that the upper specification limit is 10 blemishes.
Referring to Table 18-7, an R chart is to be constructed for the number of blemishes.
The center line of this R chart is located at ________.
TABLE 18-4
A factory supervisor is concerned that the time it takes workers to complete an
important production task (measured in seconds) is too erratic and adversely affects
expected profits. The supervisor proceeds by randomly sampling 5 individuals per hour
for a period of 10 hours. The sample mean and range for each hour are listed below.
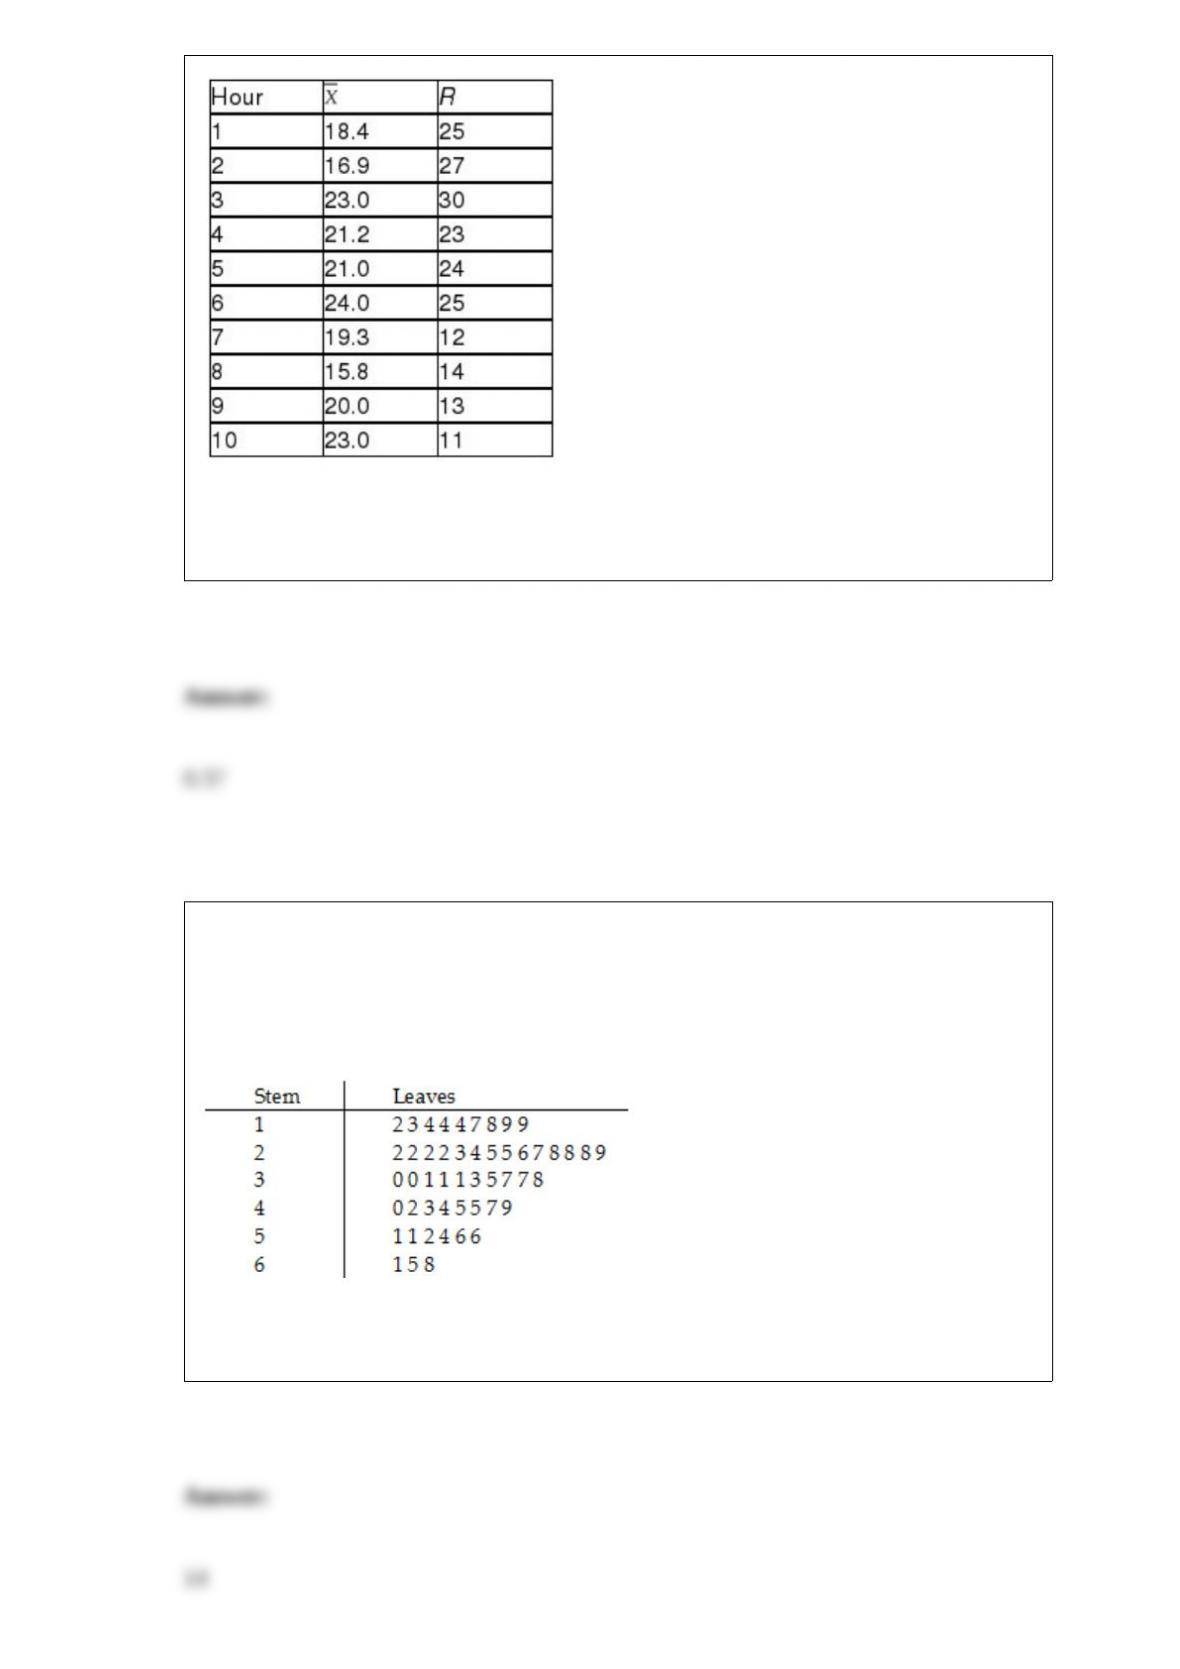
She also decides that lower and upper specification limit for the critical-to-quality
variable should be 10 and 30 seconds, respectively.
Referring to Table 18-4, what is the value of the Cpk index?
TABLE 2-7
The Stem-and-Leaf display below contains data on the number of months between the
date a civil suit is filed and when the case is actually adjudicated for 50 cases heard in
superior court.
Referring to Table 2-7, the civil suit with the fourth shortest waiting time between when
the suit was filed and when it was adjudicated had a wait of ________ months.
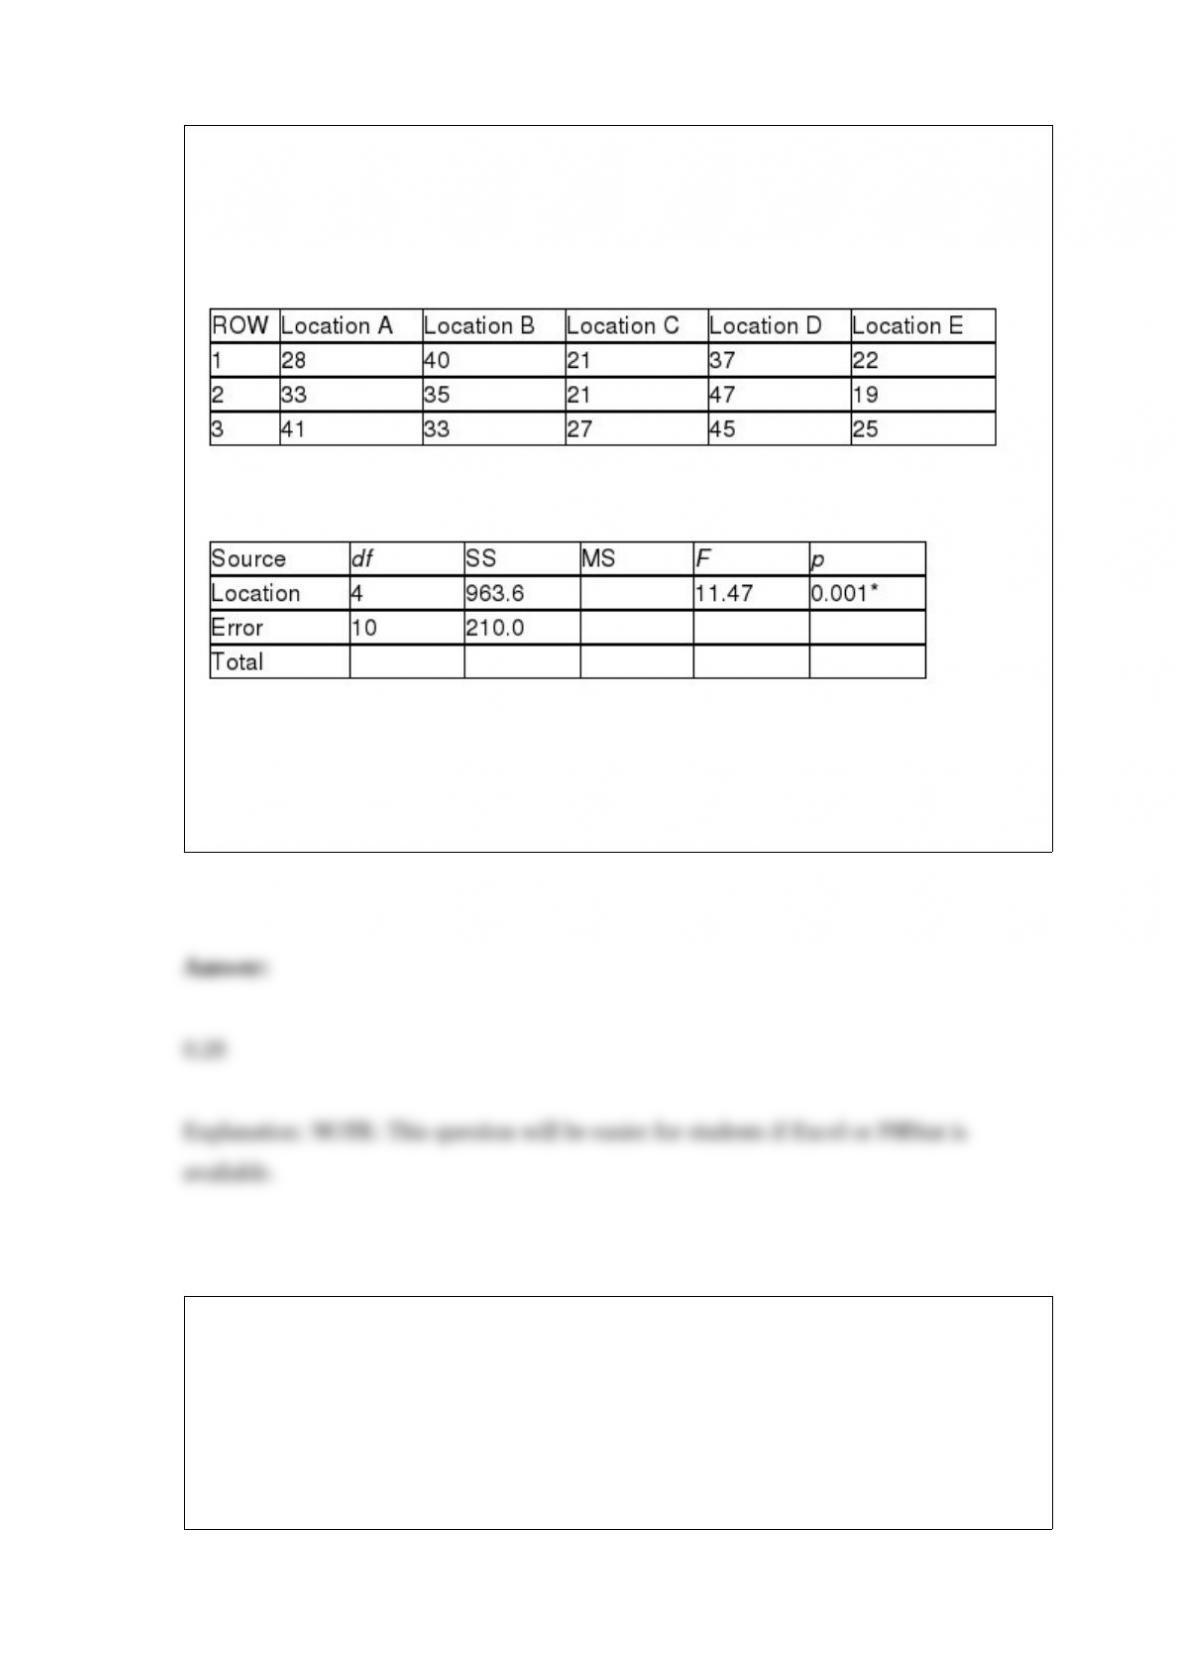
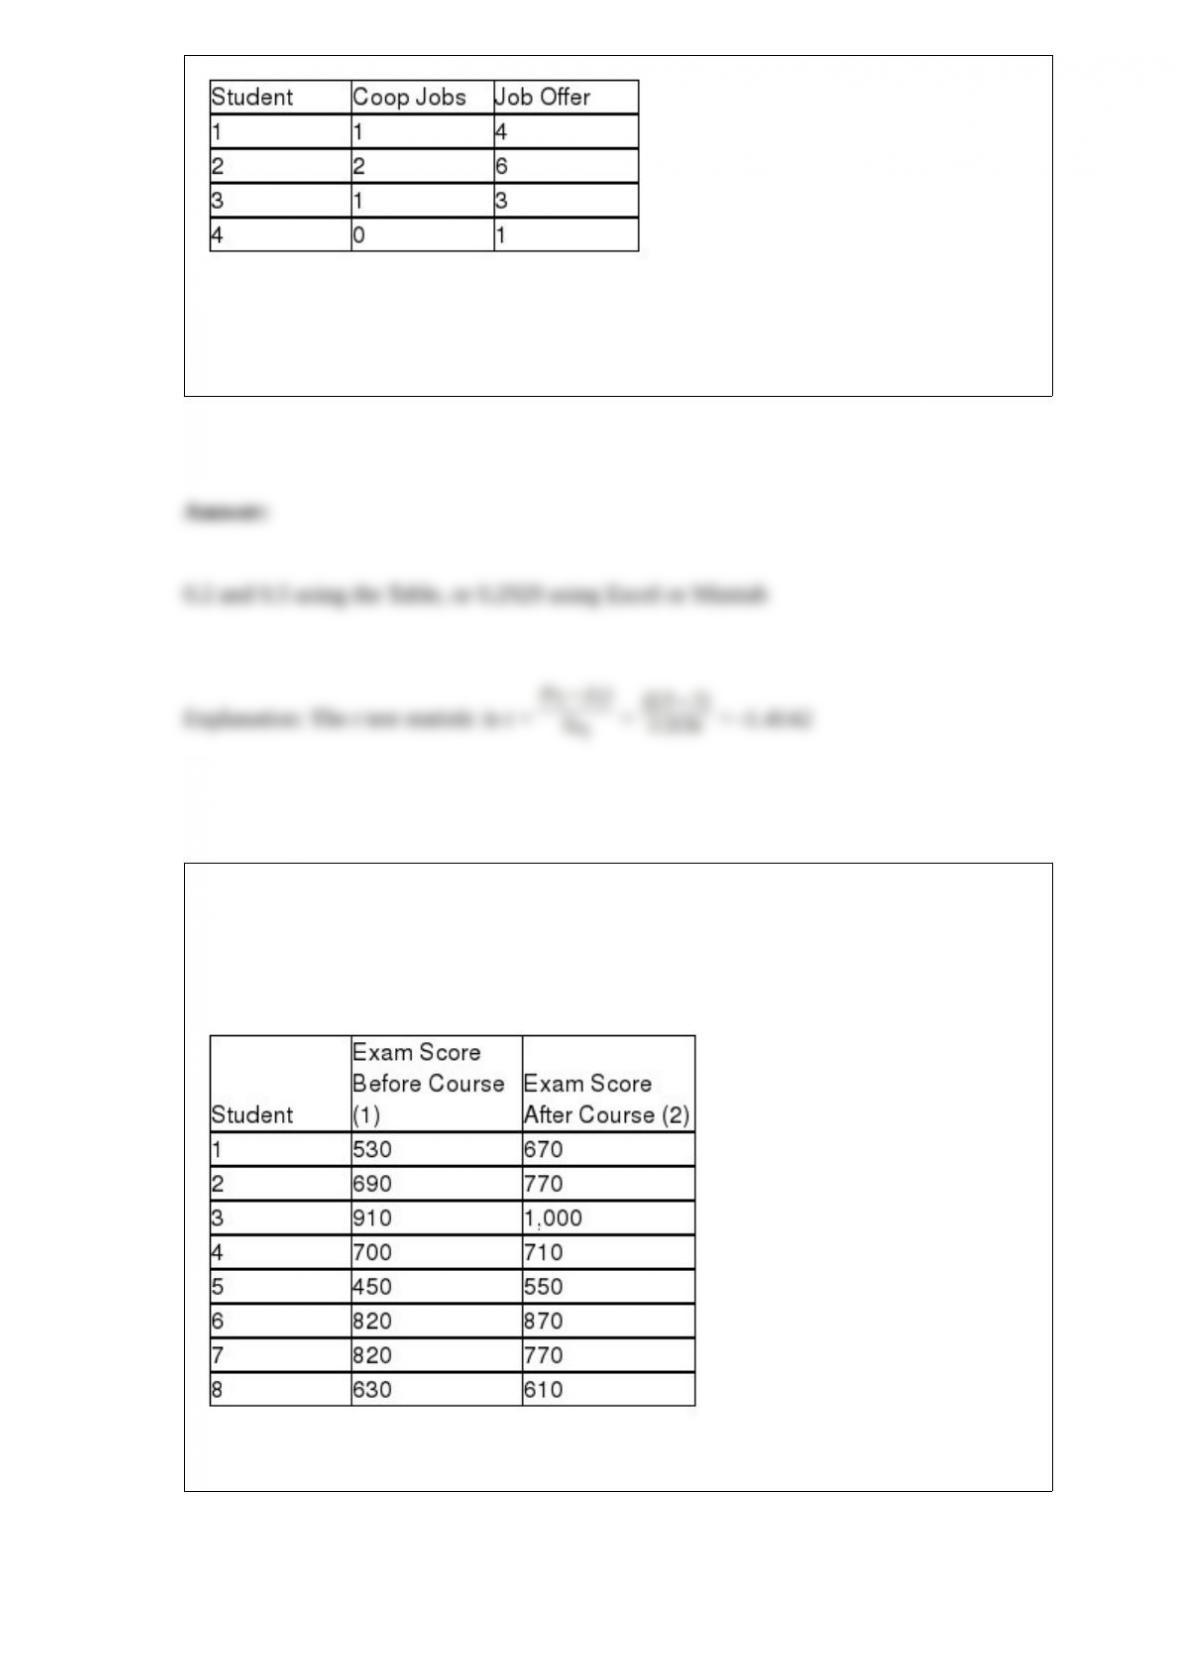
TABLE 11-5
A hotel chain has identically small sized resorts in 5 locations in different small islands.
The data that follow resulted from analyzing the hotel occupancies on randomly
selected days in the 5 locations.
Analysis of Variance
* or p < 0.005, tabular value
Referring to Table 11-5, what is the value of the test statistic for Levene’s test for
homogeneity of variances?
TABLE 13-3
The director of cooperative education at a state college wants to examine the effect of
cooperative education job experience on marketability in the work place. She takes a
random sample of 4 students. For these 4, she finds out how many times each had a
cooperative education job and how many job offers they received upon graduation.
These data are presented in the table below.
Referring to Table 13-3, the director of cooperative education wanted to test the
hypothesis that the population slope was equal to 3.0. The p-value of the test is between
________ and ________.
TABLE 10-5
To test the effectiveness of a business school preparation course, 8 students took a
general business test before and after the course. The results are given below.
Referring to Table 10-5, the p-value of the test statistic is ________.
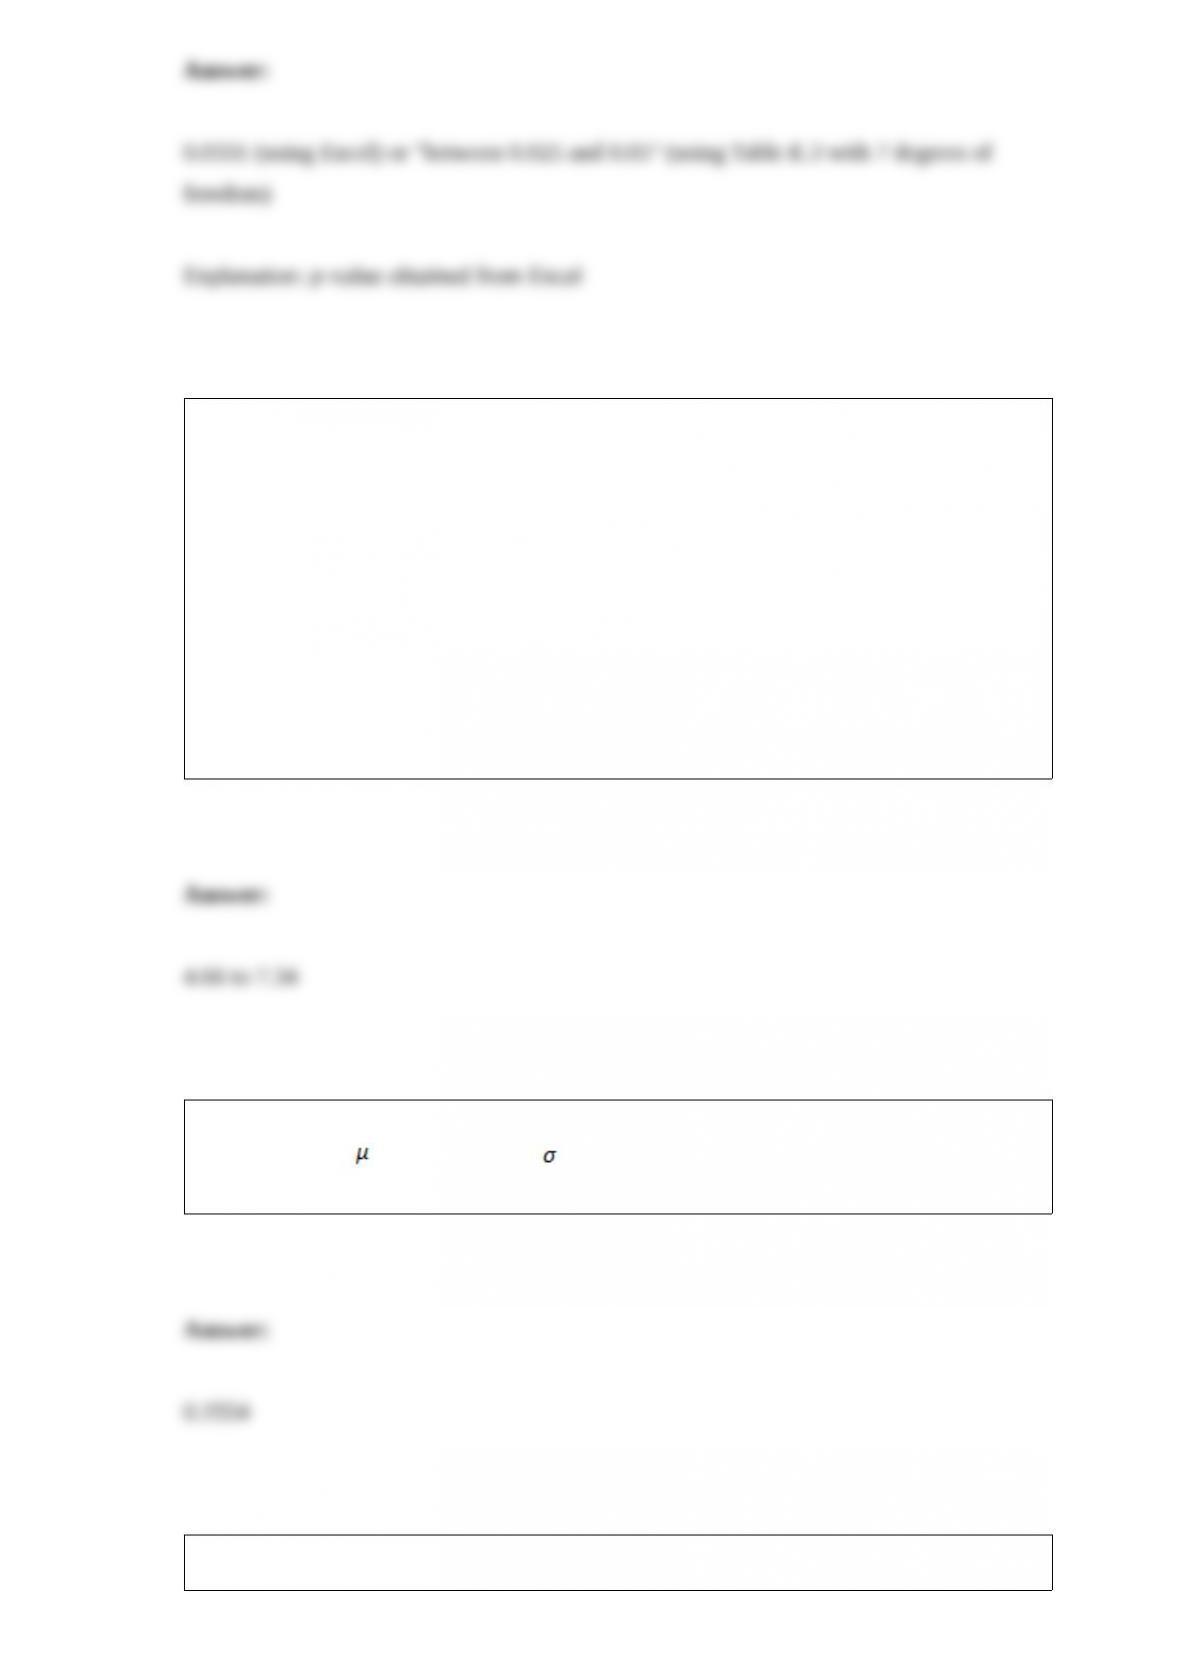
TABLE 8-3
To become an actuary, it is necessary to pass a series of 10 exams, including the most
important one, an exam in probability and statistics. An insurance company wants to
estimate the mean score on this exam for actuarial students who have enrolled in a
special study program. They take a sample of 8 actuarial students in this program and
determine that their scores are: 2, 5, 8, 8, 7, 6, 5, and 7. This sample will be used to
calculate a 90% confidence interval for the mean score for actuarial students in the
special study program.
Referring to Table 8-3, a 90% confidence interval for the mean score of actuarial
students in the special program is from ________ to ________.
The amount of tea leaves in a can from a particular production line is normally
distributed with = 110 grams and = 25 grams. What is the probability that a
randomly selected can will contain between 100 and 110 grams of tea leaves?
TABLE 2-13
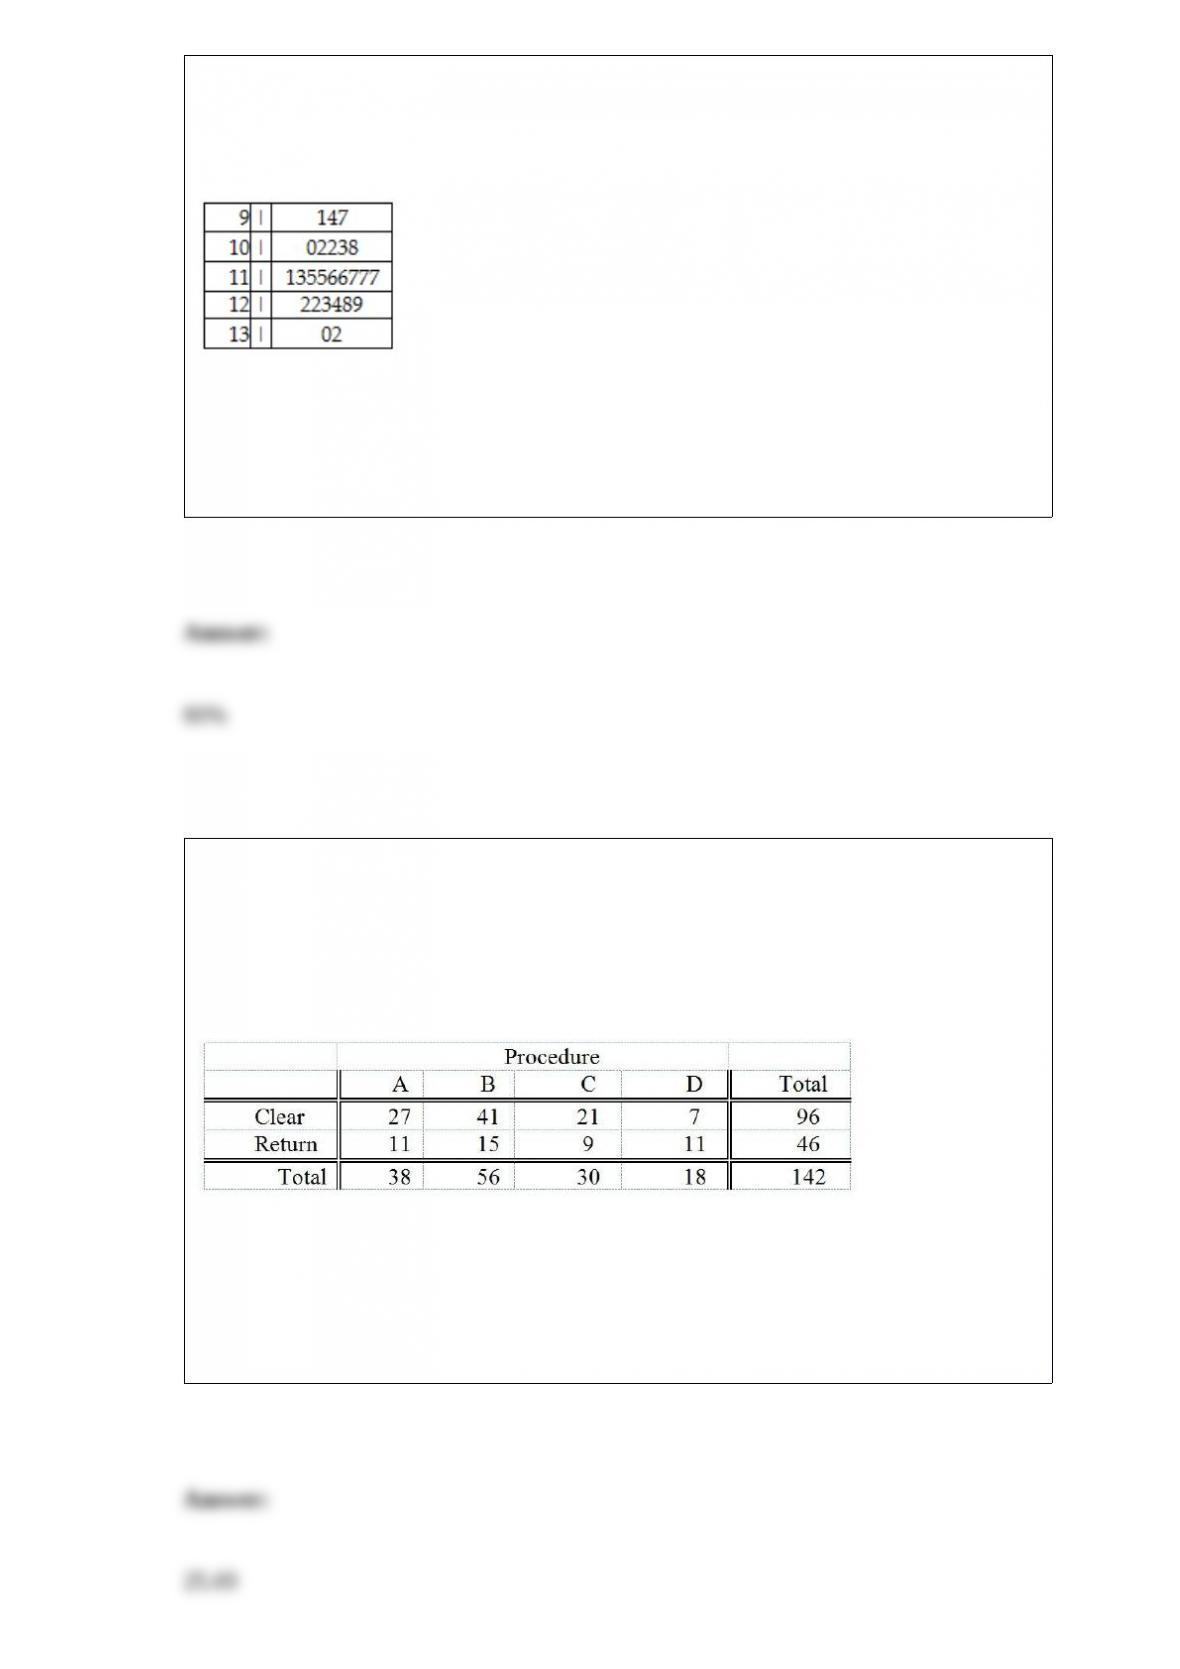
Given below is the stem-and-leaf display representing the amount of detergent used in
gallons (with leaves in 10ths of gallons) in a day by 25 drive-through car wash
operations in Phoenix.
Referring to Table 2-13, if a relative frequency or percentage distribution for the
detergent data is constructed, using “9.0 but less than 10.0 gallons” as the first class,
what percentage of drive-through car wash operations use at least 10 gallons but less
than 13 gallons of detergent in a day?
TABLE 12-5
Four surgical procedures currently are used to install pacemakers. If the patient does not
need to return for follow-up surgery, the operation is called a “clear” operation. A heart
center wants to compare the proportion of clear operations for the 4 procedures, and
collects the following numbers of patients from their own records:
They will use this information to test for a difference among the proportion of clear
operations using a chi-square test with a level of significance of 0.05.
Referring to Table 12-5, the expected cell frequency for the Procedure A/Clear cell is
________.