True or False: A regression had the following results: SST = 102.55,
SSE = 82.04. It can be said that 20.0% of the variation in the
dependent variable is explained by the independent variables in the
regression.
True or False: The total sum of squares (SST) in a regression model will never be
greater than the regression sum of squares (SSR).
TABLE 15-4
The superintendent of a school district wanted to predict the percentage of students
passing a sixth-grade proficiency test. She obtained the data on percentage of students
passing the proficiency test (% Passing), daily mean of the percentage of students
attending class (% Attendance), mean teacher salary in dollars (Salaries), and
instructional spending per pupil in dollars (Spending) of 47 schools in the state.
Let Y = % Passing as the dependent variable, X1 = % Attendance, X2 = Salaries and X3
= Spending.
The coefficient of multiple determination ( ) of each of the 3 predictors with all the
other remaining predictors are, respectively, 0.0338, 0.4669, and 0.4743.
The output from the best-subset regressions is given below:
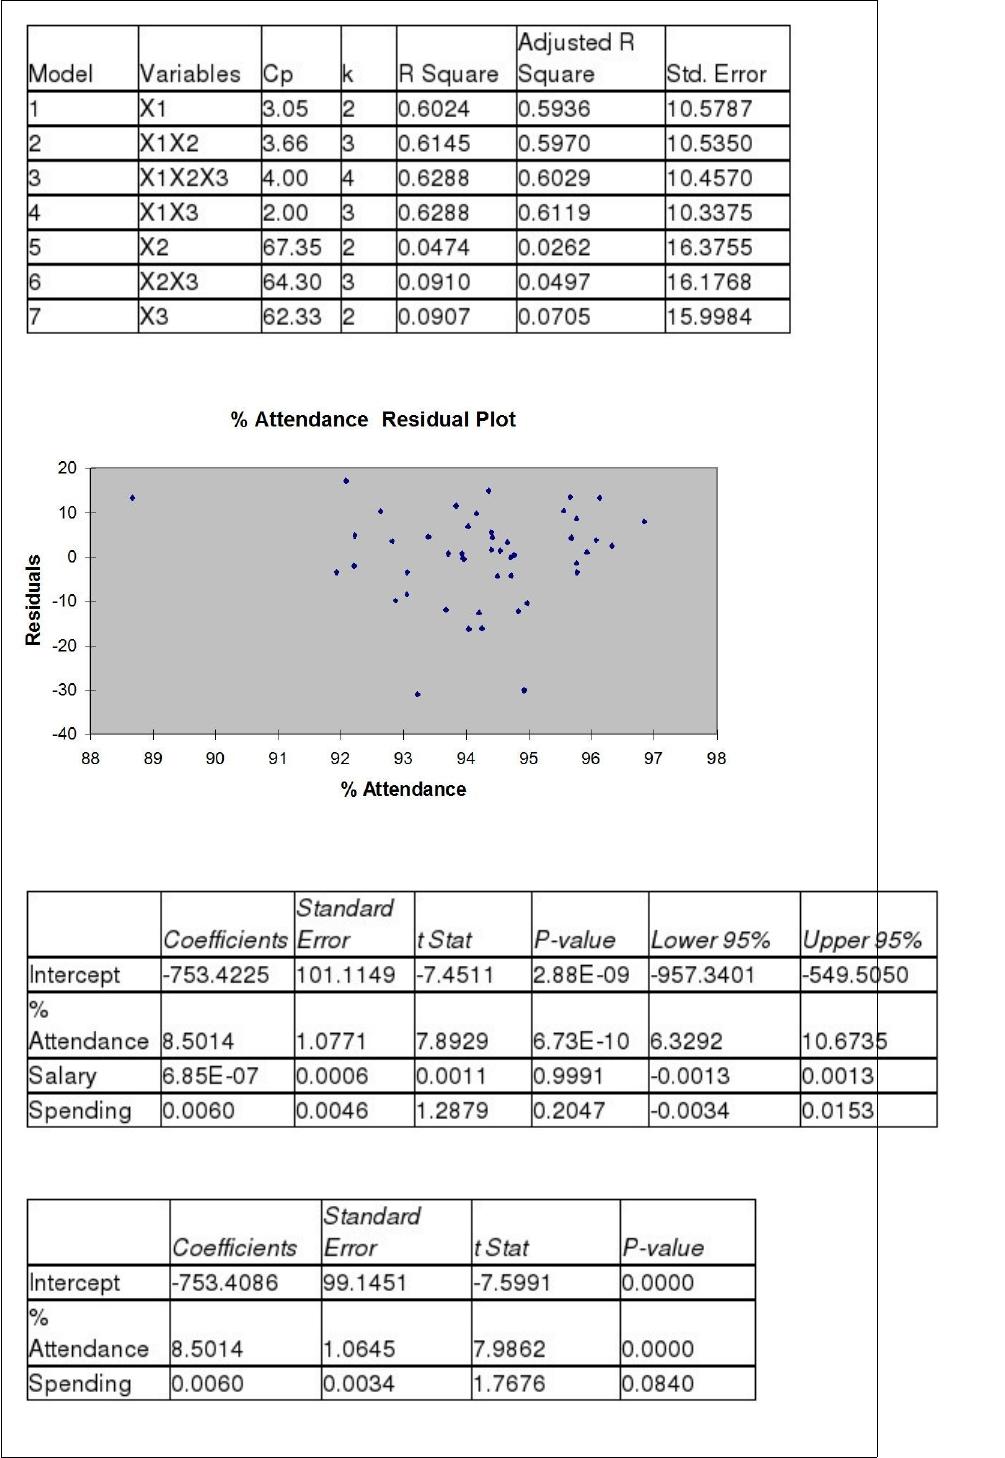
Following is the residual plot for % Attendance:
Following is the output of several multiple regression models:
Model (I):
Model (II):
Model (III):
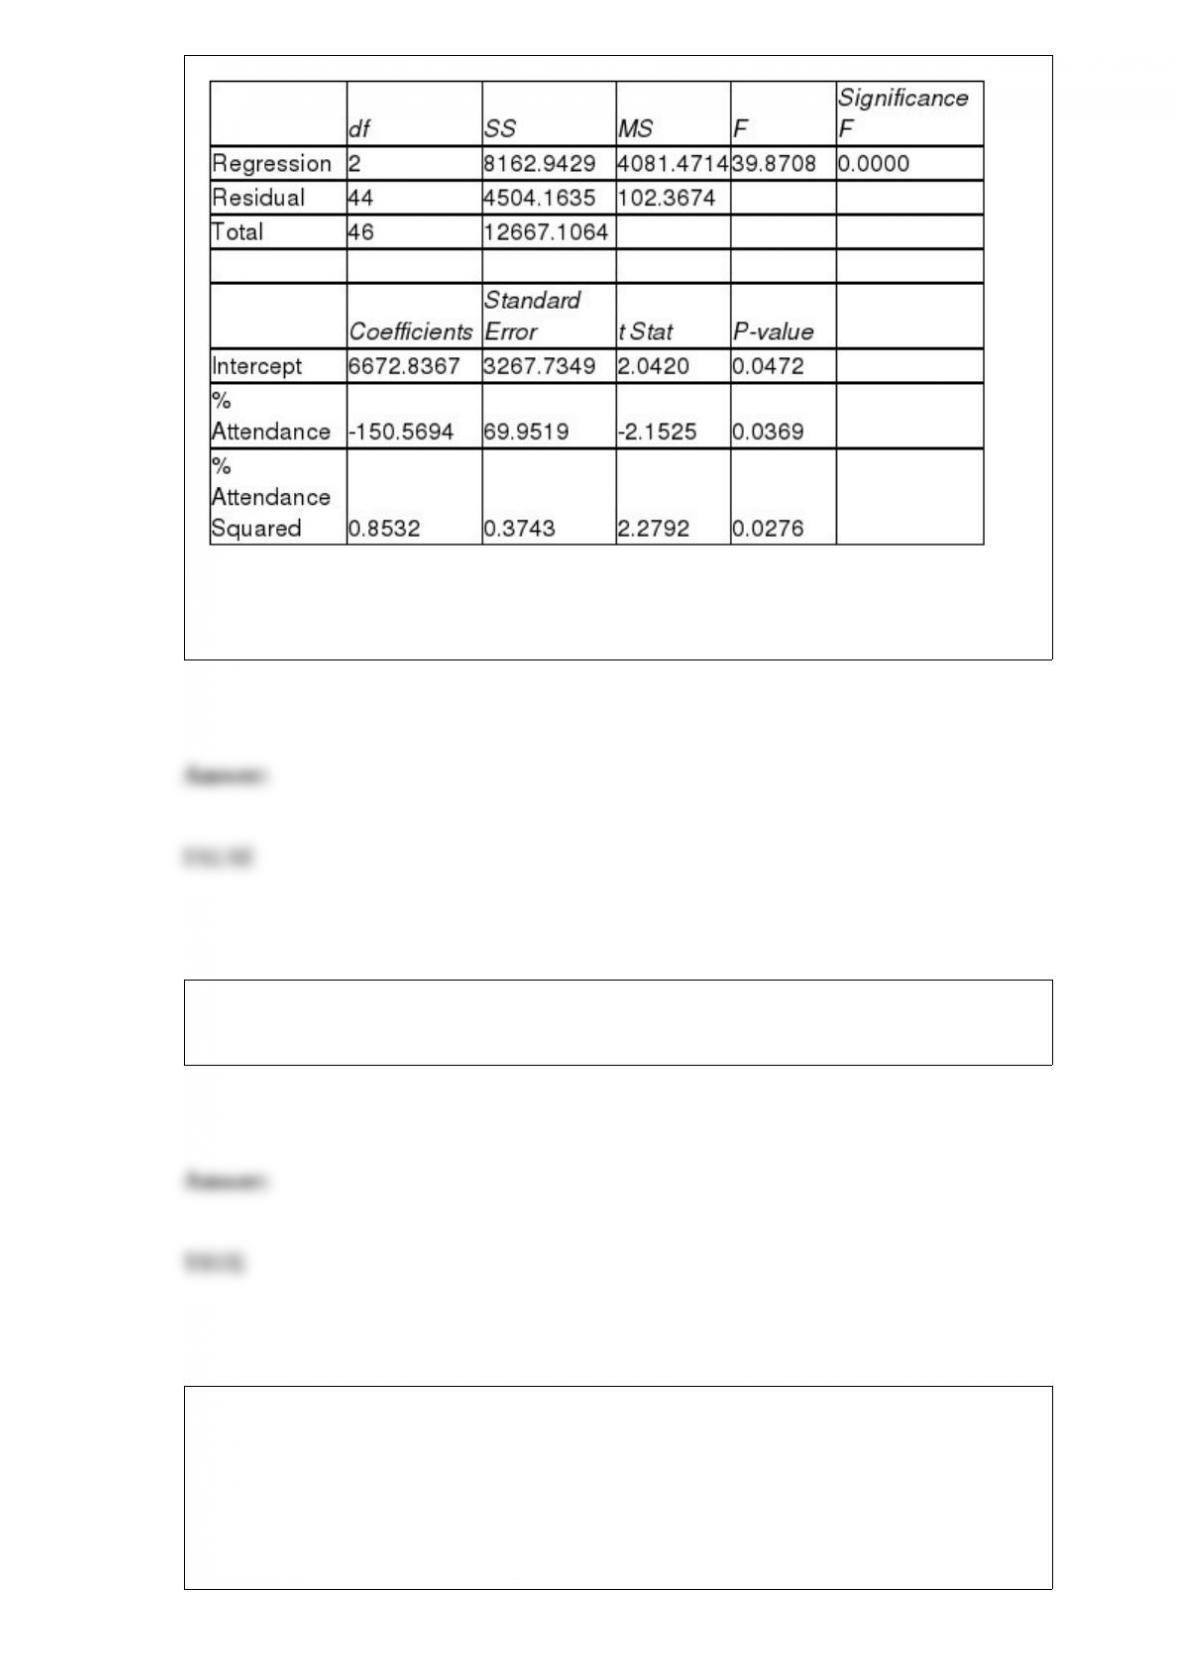
True or False: Referring to Table 15-4, the quadratic effect of daily average of the
percentage of students attending class on percentage of students passing the proficiency
test is not significant at a 5% level of significance.
True or False: The stem-and-leaf display is often superior to the frequency distribution
in that it maintains the original values for further analysis.
TABLE 12-11
The director of admissions at a state college is interested in seeing if admissions status
(admitted, waiting list, denied admission) at his college is independent of the type of
community in which an applicant resides. He takes a sample of recent admissions
decisions and forms the following table:
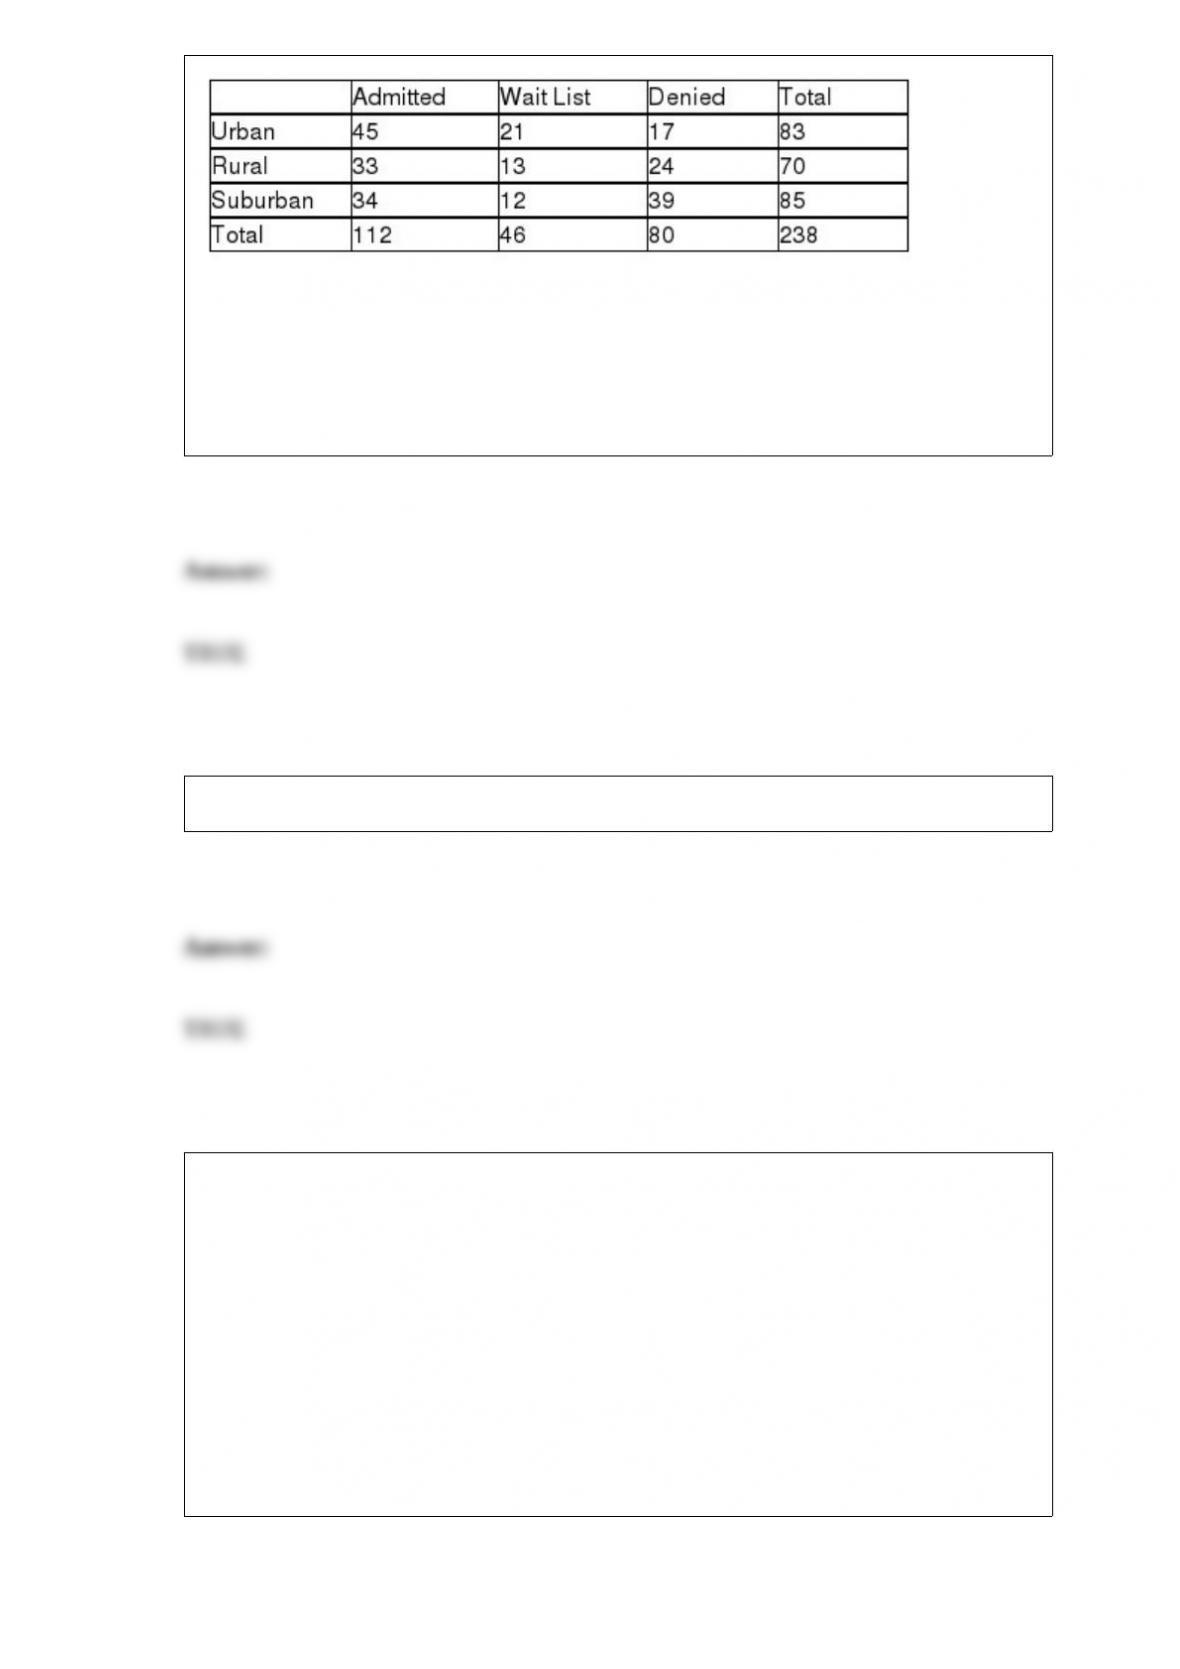
He will use this table to do a chi-square test of independence with a level of
significance of 0.01.
True or False: Referring to Table 12-11, the same decision would be made with this test
if the level of significance had been 0.005.
True or False: The O in the DCOVA framework stands for “organize.”
TABLE 14-15
The superintendent of a school district wanted to predict the
percentage of students passing a sixth-grade proficiency test. She
obtained the data on percentage of students passing the proficiency
test (% Passing), mean teacher salary in thousands of dollars
(Salaries), and instructional spending per pupil in thousands of dollars
(Spending) of 47 schools in the state.
Following is the multiple regression output with Y = % Passing as the
dependent variable, X1 = Salaries and X2 = Spending:

True or False: Referring to Table 14-15, the alternative hypothesis H1 :
At least one of βj ≠0 for j = 1, 2 implies that percentage of
students passing the proficiency test is related to at least one of the
explanatory variables.
True or False: Some business analytics are performed by adding variables to see if
unforeseen relationships are uncovered.
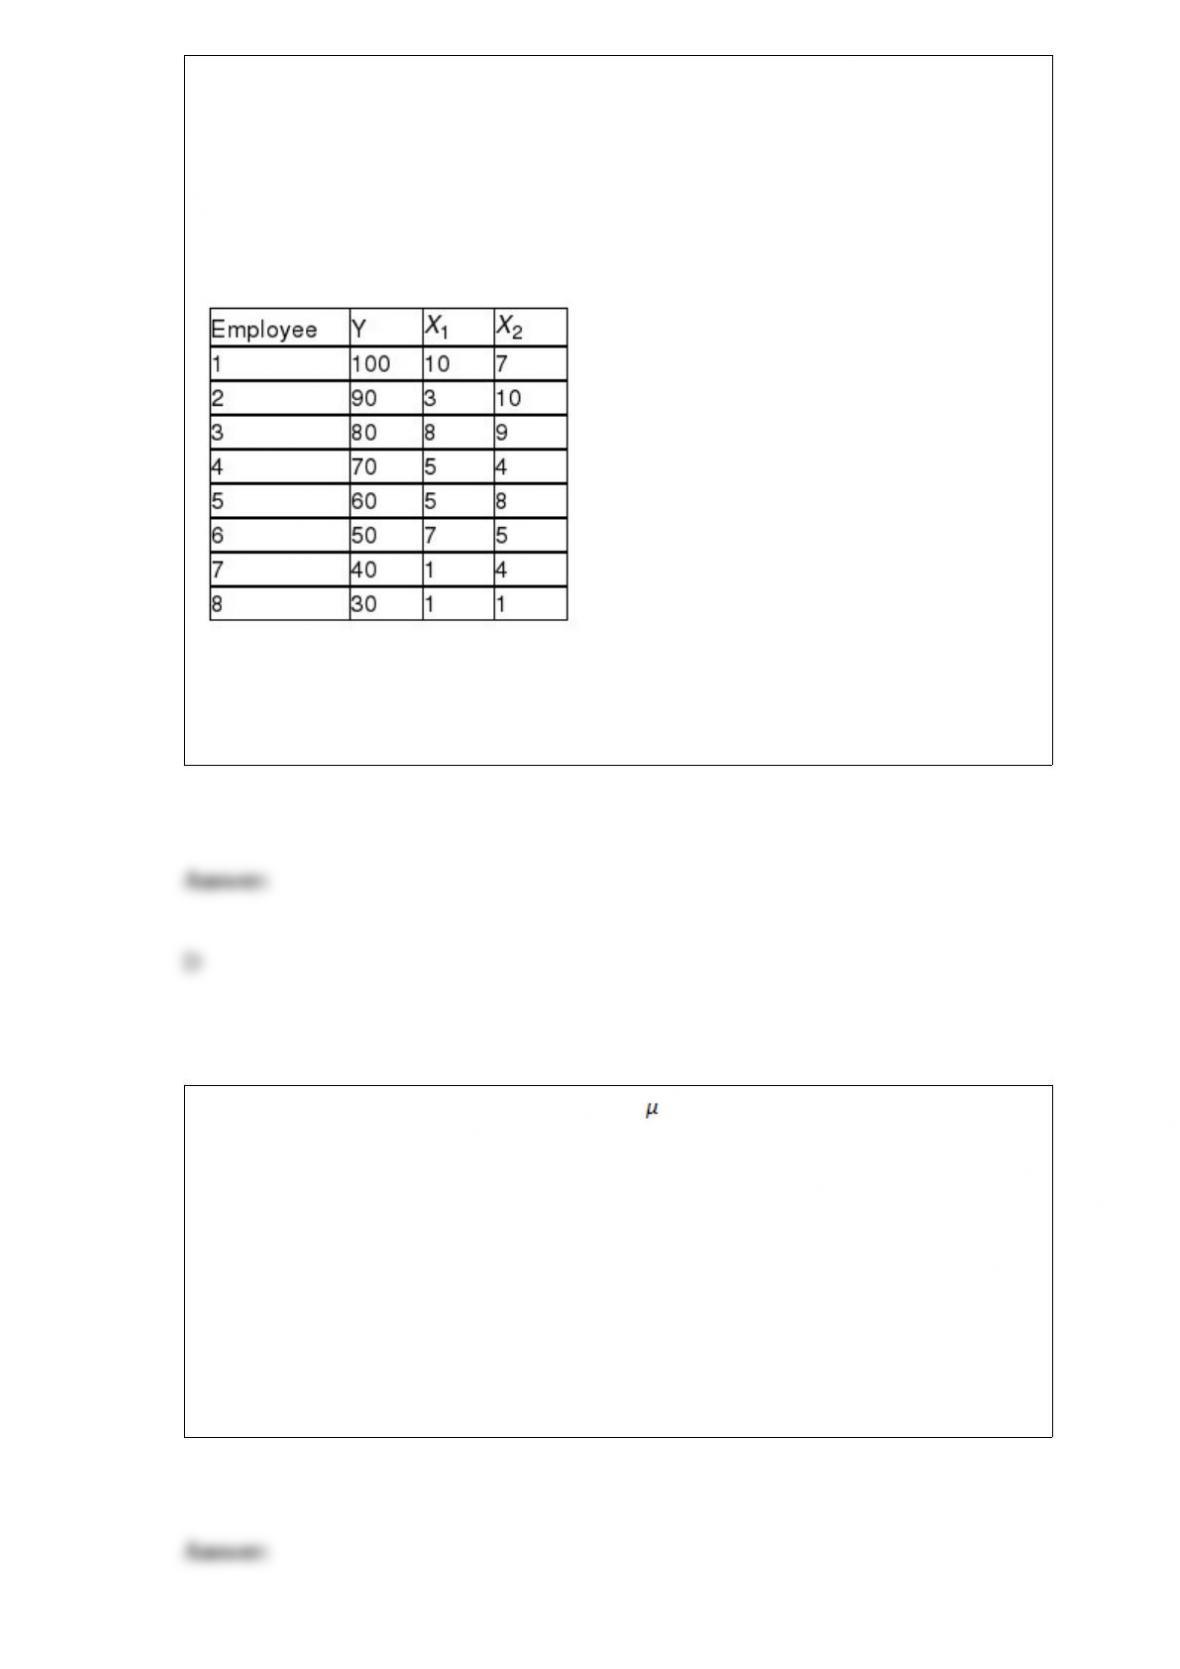
Referring to Table 14-1, for these data, what is the value for the regression constant, b0?
TABLE 14-1
A manager of a product sales group believes the number of sales made by an employee
(Y) depends on how many years that employee has been with the company (X1) and
how he/she scored on a business aptitude test (X2). A random sample of 8 employees
provides the following:
A) 0.998
B) 3.103
C) 4.698
D) 21.293
If we are performing a two-tail test of whether = 100, the probability of detecting a
shift of the mean to 105 will be ________ the probability of detecting a shift of the
mean to 110.
A) less than
B) greater than
C) equal to
D) not comparable to

Which of the following would be an appropriate null hypothesis?
A) The population proportion is less than 0.65.
B) The sample proportion is less than 0.65.
C) The population proportion is not less than 0.65.
D) The sample proportion is no less than 0.65.
The degrees of freedom for the F test in a one-way ANOVA are
A) (n – c) and (c – 1).
B) (c – 1) and (n – c).
C) (c – n) and (n – 1).
D) (n – 1) and (c – n).
TABLE 11-7
A campus researcher wanted to investigate the factors that affect visitor travel time in a
complex, multilevel building on campus. Specifically, he wanted to determine whether
different building signs (building maps versus wall signage) affect the total amount of
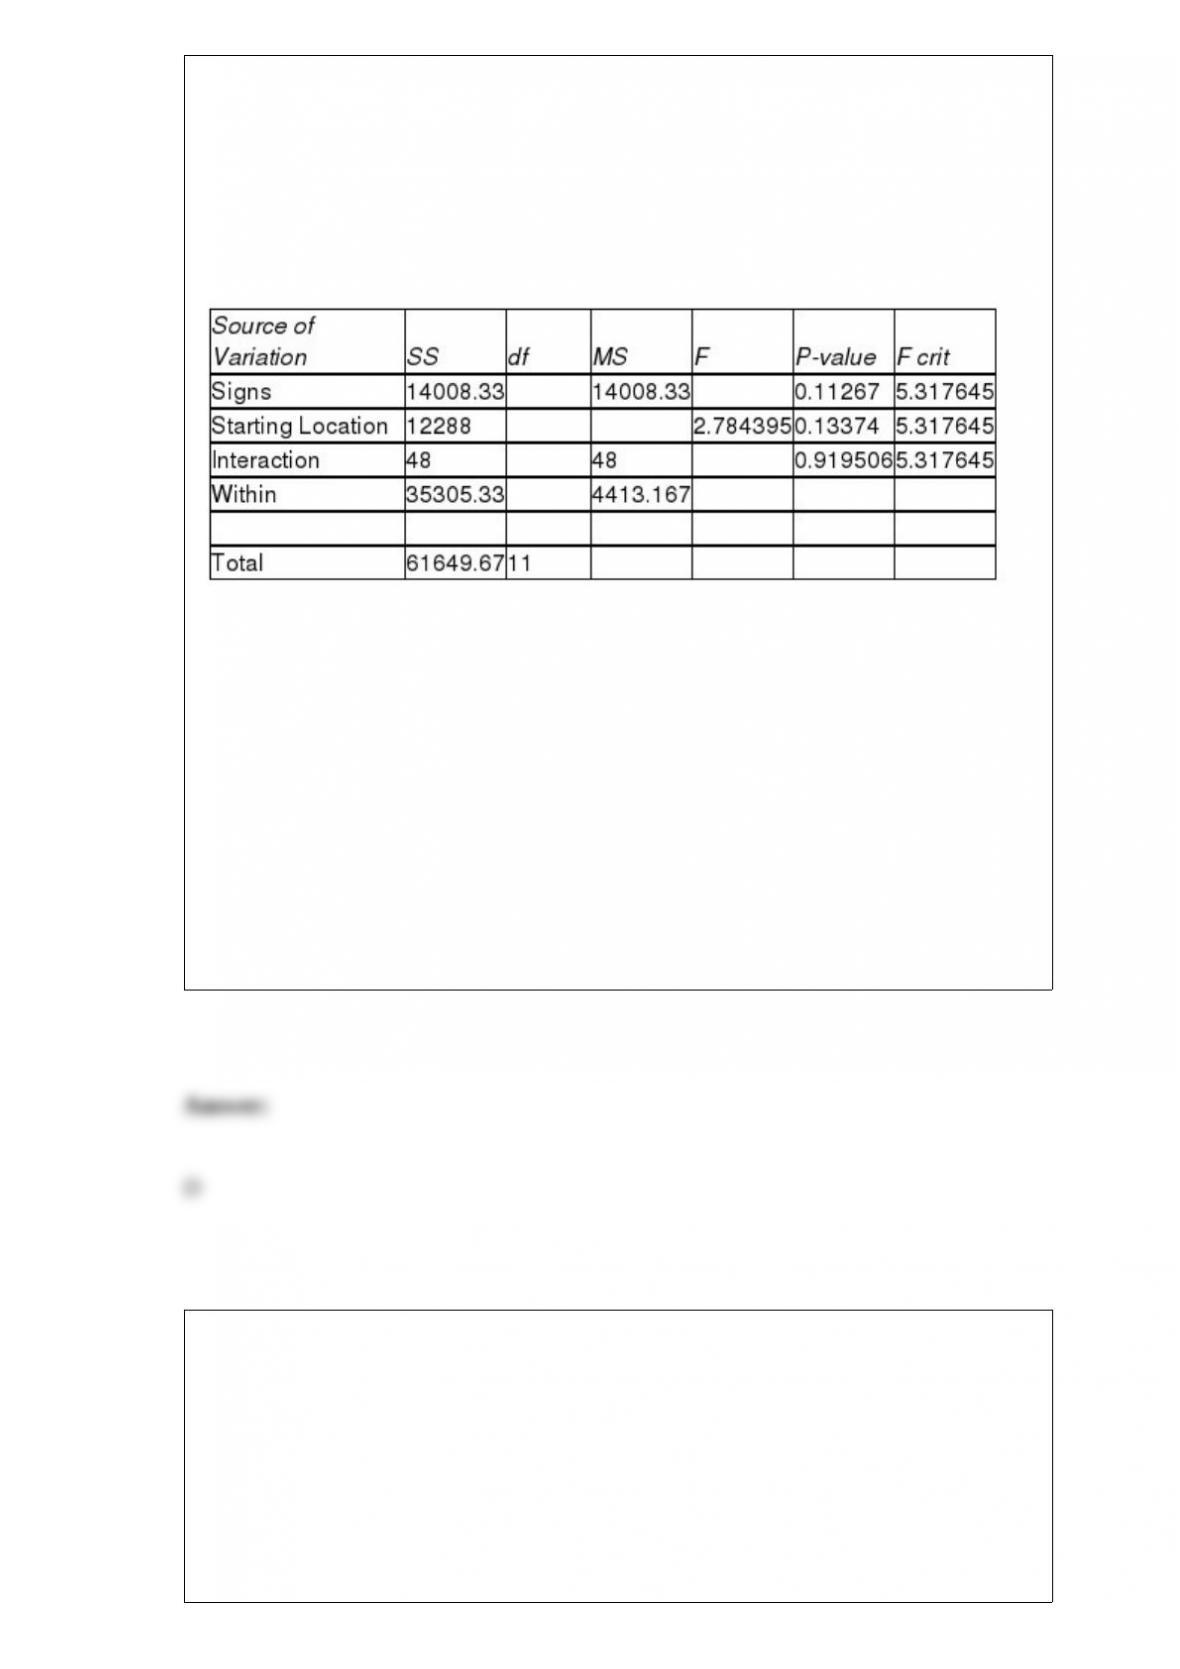
time visitors require to reach their destination and whether that time depends on
whether the starting location is inside or outside the building. Three subjects were
assigned to each of the combinations of signs and starting locations, and travel time in
seconds from beginning to destination was recorded. An Excel output of the appropriate
analysis is given below:
ANOVA
Referring to Table 11-7, at 1% level of significance,
A) there is insufficient evidence to conclude that the difference between the mean
traveling time for the different starting locations depends on the types of signs.
B) there is insufficient evidence to conclude that the difference between the mean
traveling time for the different types of signs depends on the starting locations.
C) there is insufficient evidence to conclude that the relationship between traveling time
and the types of signs depends on the starting locations.
D) All of the above.
The width of the prediction interval for the predicted value of Y is dependent on
A) the standard error of the estimate.
B) the value of X for which the prediction is being made.
C) the sample size.
D) All of the above.

A quality control engineer is in charge of the manufacture of computer disks. Two
different processes can be used to manufacture the disks. He suspects that the Kohler
method produces a greater proportion of defects than the Russell method. He samples
150 of the Kohler and 200 of the Russell disks and finds that 27 and 18 of them,
respectively, are defective. If Kohler is designated as “Group 1” and Russell is
designated as “Group 2,” which of the following tests will you use to find out if the
Kohler method is worse than the Russell method?
A) Paired t test
B) Z test for difference in proportions
C) χ2 test for difference in proportions
D) McNemar test
A survey claims that 9 out of 10 doctors recommend aspirin for their patients with
headaches. To test this claim against the alternative that the actual proportion of doctors
who recommend aspirin is less than 0.90, a random sample of 100 doctors results in 83
who indicate that they recommend aspirin. The value of the test statistic in this problem
is approximately equal to
A) -4.12.
B) -2.33.
C) -1.86.
D) -0.07.
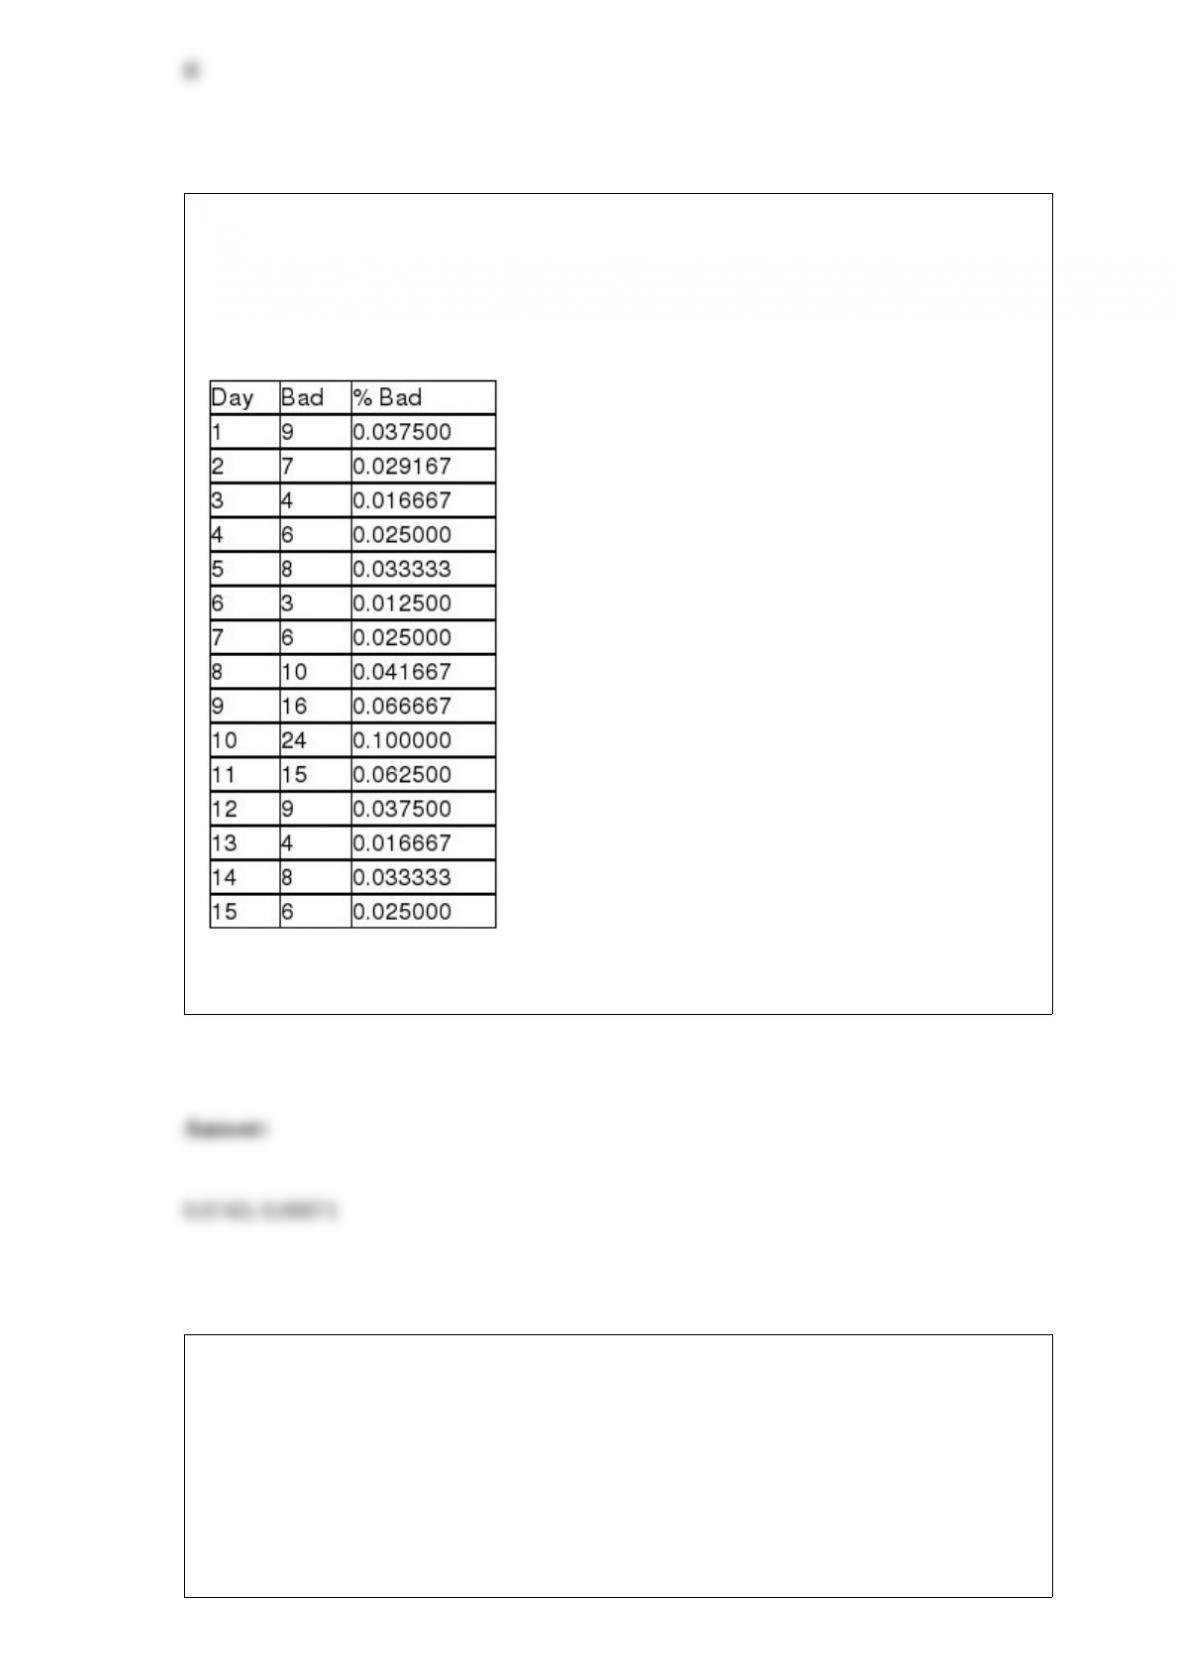
TABLE 18-5
A manufacturer of computer disks took samples of 240 disks on 15 consecutive days.
The number of disks with bad sectors was determined for each of these samples. The
results are in the table that follows.
Referring to Table 18-5, a p control chart is to be made for these data. The upper control
limit is ________, and the lower control limit is ________.
TABLE 4-4
Suppose that patrons of a restaurant were asked whether they preferred water or
whether they preferred soda. 70% said that they preferred water. 60% of the patrons
were male. 80% of the males preferred water.
True or False: Referring to Table 4-4, the two events “preferring water” and “being a
male” are independent.
Suppose that past history shows that 60% of college students prefer Brand C cola. A
sample of 5 students is to be selected. The probability that fewer than 2 prefer brand C
is ________.
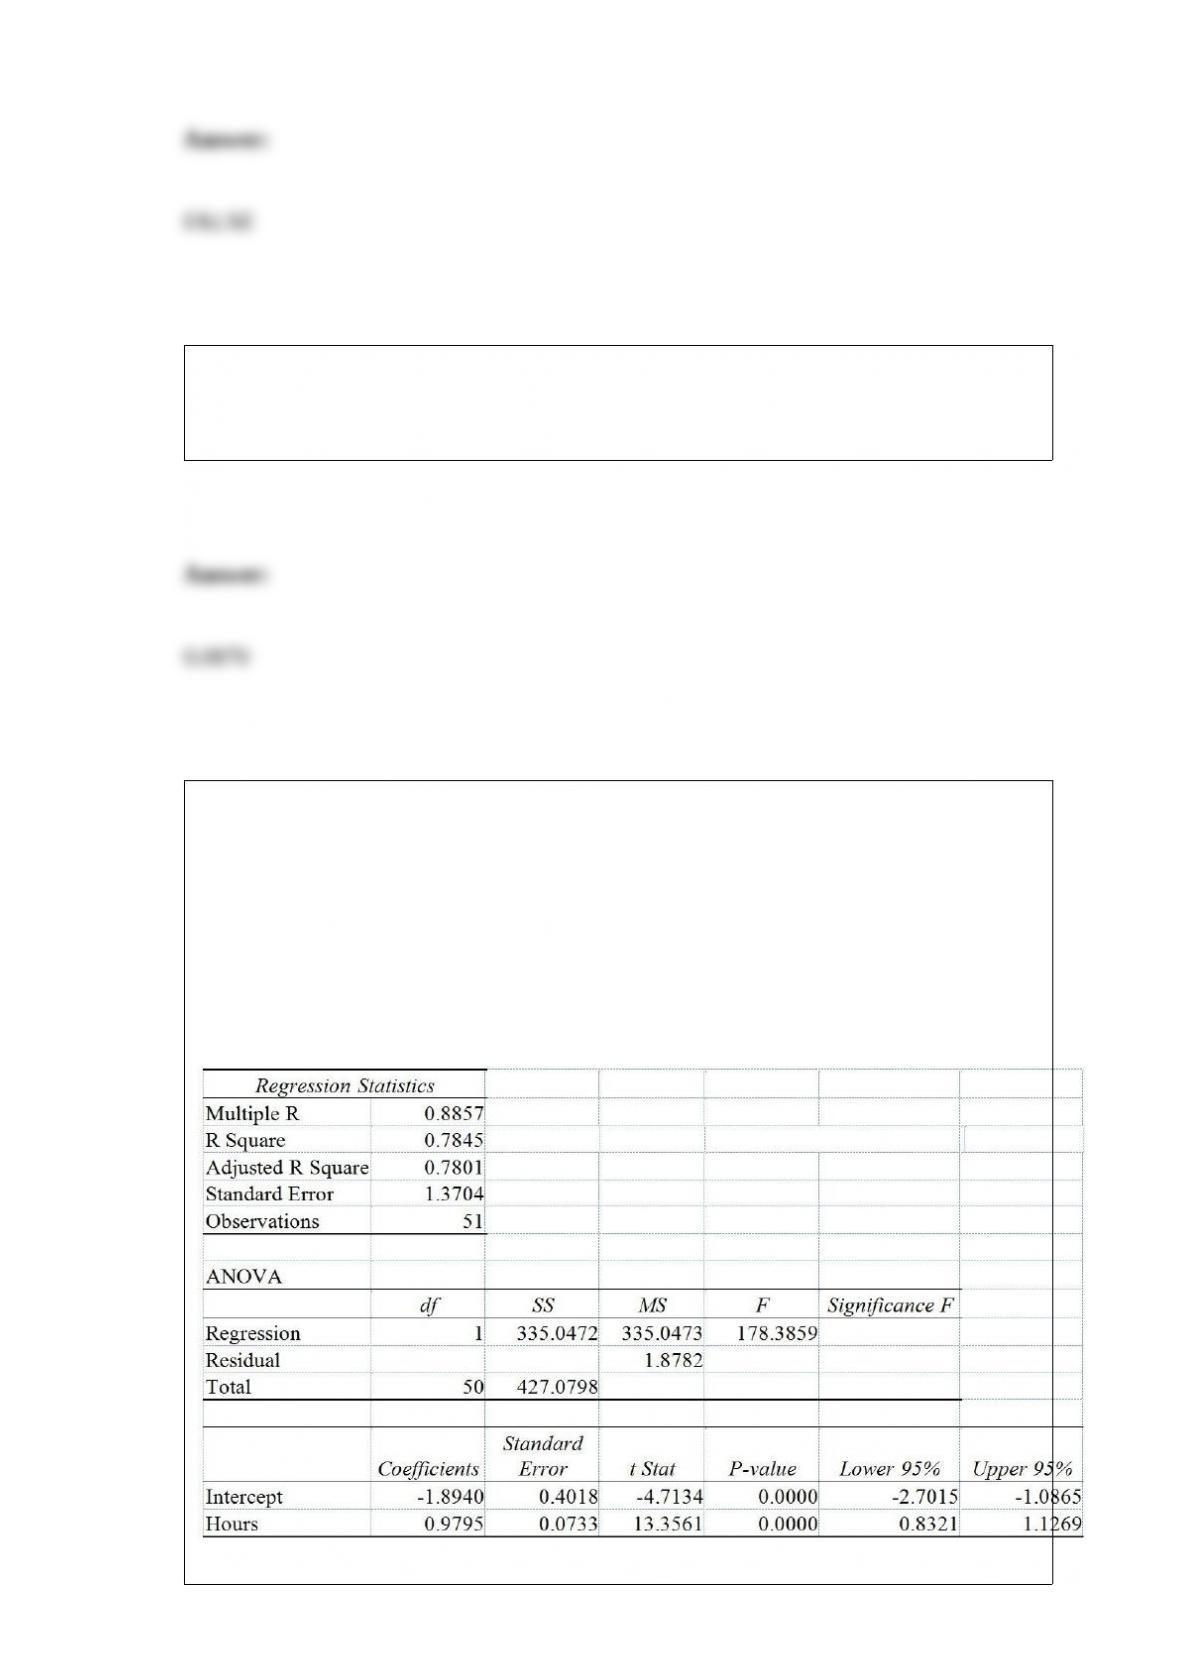
TABLE 13-9
It is believed that, the average numbers of hours spent studying per day (HOURS)
during undergraduate education should have a positive linear relationship with the
starting salary (SALARY, measured in thousands of dollars per month) after graduation.
Given below is the Excel output for predicting starting salary (Y) using number of hours
spent studying per day (X) for a sample of 51 students. NOTE: Only partial output is
shown.

Note: 2.051E – 05 = 2.051 ∗ 10-05 and 5.944E – 18 = 5.944 ∗ 10-18.
Referring to Table 13-9, the error sum of squares (SSE) of the above regression is
A) 1.878215.
B) 92.0325465.
C) 335.047257.
D) 427.079804.
Every spring semester, the School of Business coordinates with local business leaders a
luncheon for graduating seniors, their families, and friends. Corporate sponsorship pays
for the lunches of each of the seniors, but students have to purchase tickets to cover the
cost of lunches served to guests they bring with them. Data on the number of guests
each graduating senior invited to the luncheon and the number of graduating seniors in
each category were collected. You want to know the most popular number of guests
brought by the graduating seniors. Which of the following will you compute?
A) Arithmetic mean
B) Median
C) Interquartile range
D) Mode
TABLE 9-7
A major home improvement store conducted its biggest brand recognition campaign in
the company’s history. A series of new television advertisements featuring well-known
entertainers and sports figures were launched. A key metric for the success of television
advertisements is the proportion of viewers who “like the ads a lot”. A study of 1,189

adults who viewed the ads reported that 230 indicated that they “like the ads a lot.” The
percentage of a typical television advertisement receiving the “like the ads a lot” score
is believed to be 22%. Company officials wanted to know if there is evidence that the
series of television advertisements are less successful than the typical ad (i.e. if there is
evidence that the population proportion of “like the ads a lot” for the company’s ads is
less than 0.22) at a 0.01 level of significance.
Referring to Table 9-7, the null hypothesis will be rejected if the test statistic is
A) greater than 2.3263.
B) less than 2.3263.
C) greater than -2.3263.
D) less than -2.3263.
TABLE 17-6
A weight-loss clinic wants to use regression analysis to build a model for weight loss of
a client (measured in pounds). Two variables thought to affect weight loss are client’s
length of time on the weight-loss program and time of session. These variables are
described below:
Y = Weight loss (in pounds)
X1 = Length of time in weight-loss program (in months)
X2 = 1 if morning session, 0 if not
X3 = 1 if afternoon session, 0 if not (Base level = evening session)
Data for 12 clients on a weight-loss program at the clinic were collected and used to fit
the interaction model:
Y = β0 + β1X1 + β2X2 + β3X3 + β4X1X2 + β5X1X3 + ε
Partial output from Microsoft Excel follows:
Regression Statistics
ANOVA

F = 5.41118 Significance F = 0.040201
Referring to Table 17-6, in terms of the βs in the model, give the mean change in
weight loss (Y) for every 1-month increase in time in the program (X1) when attending
the morning session.
A) β1 + β4
B) β1 + β5
C) β1
D) β4 + β5
TABLE 17-9
What are the factors that determine the acceleration time (in sec.) from 0 to 60 miles per
hour of a car? Data on the following variables for 171 different vehicle models were
collected:
Accel Time: Acceleration time in sec.
Cargo Vol: Cargo volume in cu. ft.
HP: Horsepower
MPG: Miles per gallon
SUV: 1 if the vehicle model is an SUV with Coupe as the base when SUV and Sedan
are both 0
Sedan: 1 if the vehicle model is a sedan with Coupe as the base when SUV and Sedan
are both 0
The regression results using acceleration time as the dependent variable and the
remaining variables as the independent variables are presented below.
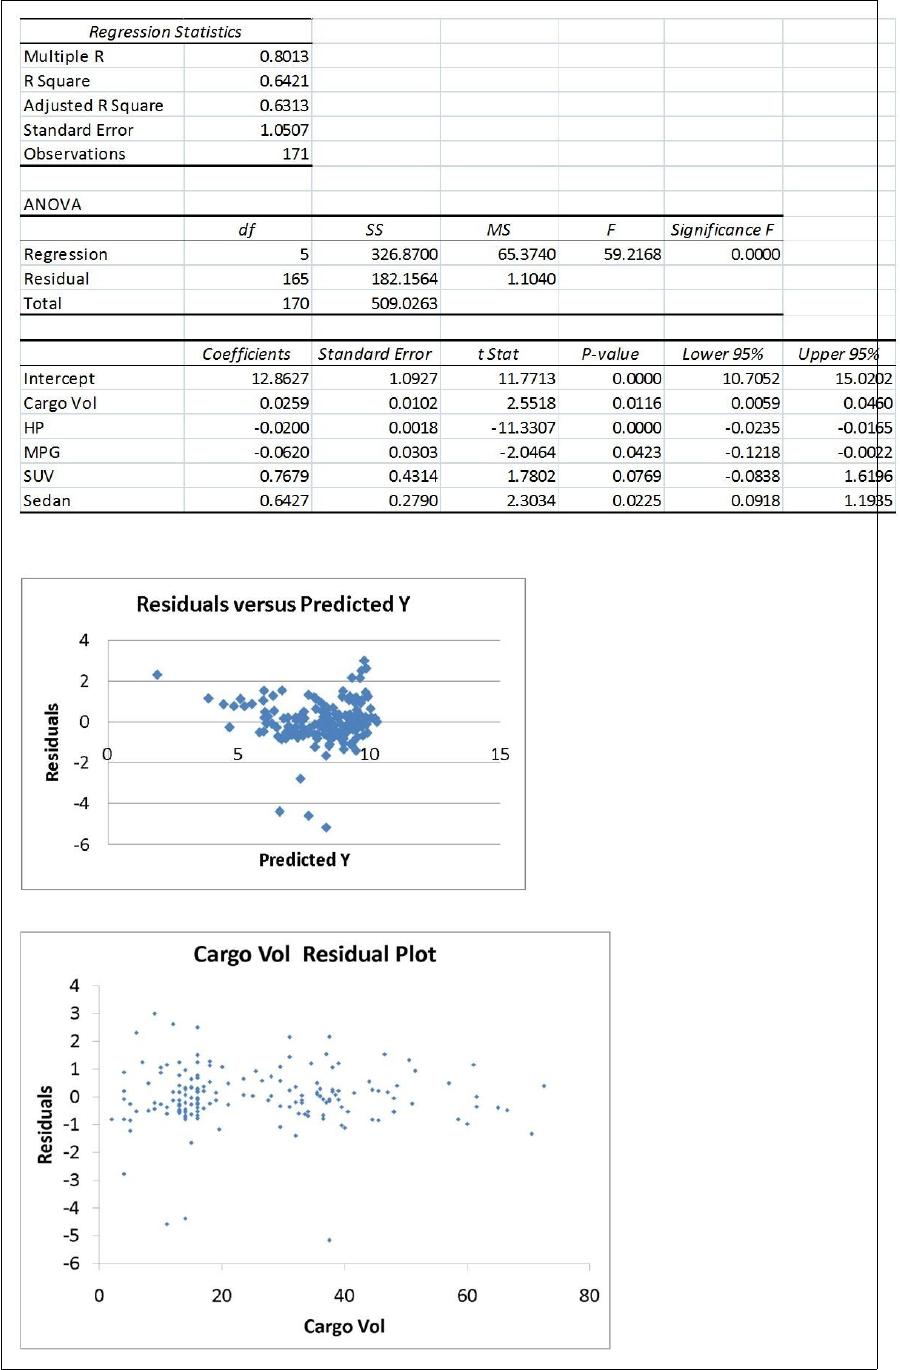
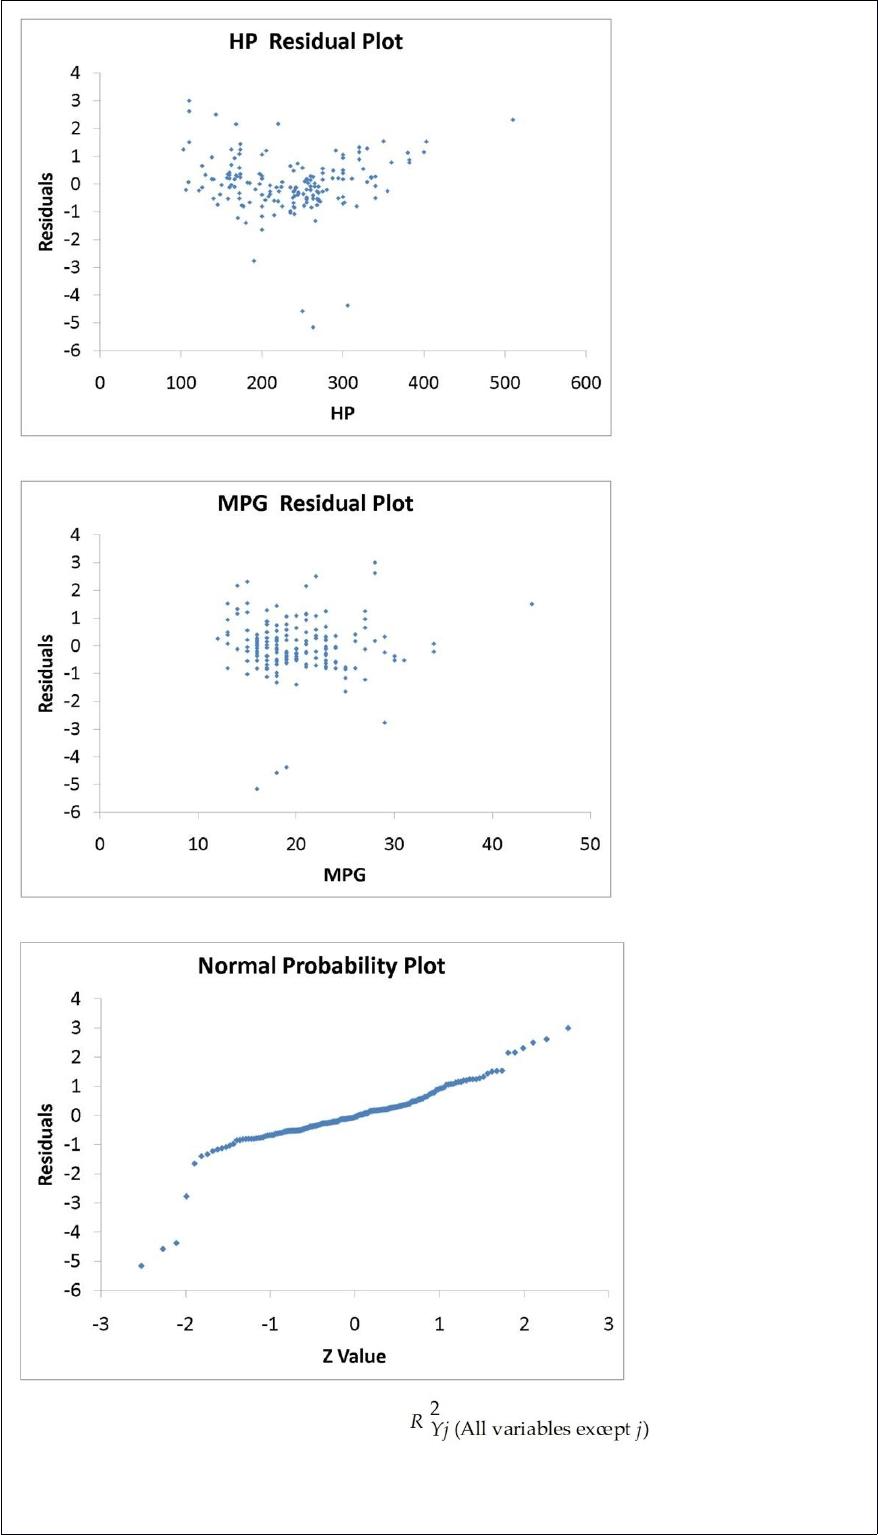
The various residual plots are as shown below.
The coefficient of partial determination ( ) of each of the 5
predictors are, respectively, 0.0380, 0.4376, 0.0248, 0.0188, and 0.0312.
The coefficient of multiple determination for the regression model using each of the 5

variables Xj as the dependent variable and all other X variables as independent variables
( ) are, respectively, 0.7461, 0.5676, 0.6764, 0.8582, 0.6632.
Referring to Table 17-9, which of the following assumptions is most likely violated
based on the residual plot of the residuals versus predicted Y?
A) Independence of errors
B) Normality of errors
C) Equal variance
D) None of the above
When using the general multiplication rule, P(A and B) is equal to
A) P(A|B)P(B).
B) P(A)P(B).
C) P(B)/P(A).
D) P(A)/P(B).
Referring to Table 14-14, the *tted model for predicting mileages for
6-cylinder cars is ________.
TABLE 14-14
An automotive engineer would like to be able to predict automobile
mileages. She believes that the two most important characteristics
that affect mileage are horsepower and the number of cylinders (4 or
6) of a car. She believes that the appropriate model is

Y = 40 – 0.05X1 + 20X2 – 0.1X1X2
where X1 = horsepower
X2 = 1 if 4 cylinders, 0 if 6 cylinders
Y = mileage
A) 40 – 0.05X1
B) 40 – 0.10X1
C) 60 – 0.10X1
D) 60 – 0.15X1
Major league baseball salaries averaged $3.26 million with a standard deviation of $1.2
million in a recent year. Suppose a sample of 100 major league players was taken. What
was the standard error for the sample mean salary?
A) $0.012 million
B) $0.12 million
C) $12 million
D) $1,200.0 million
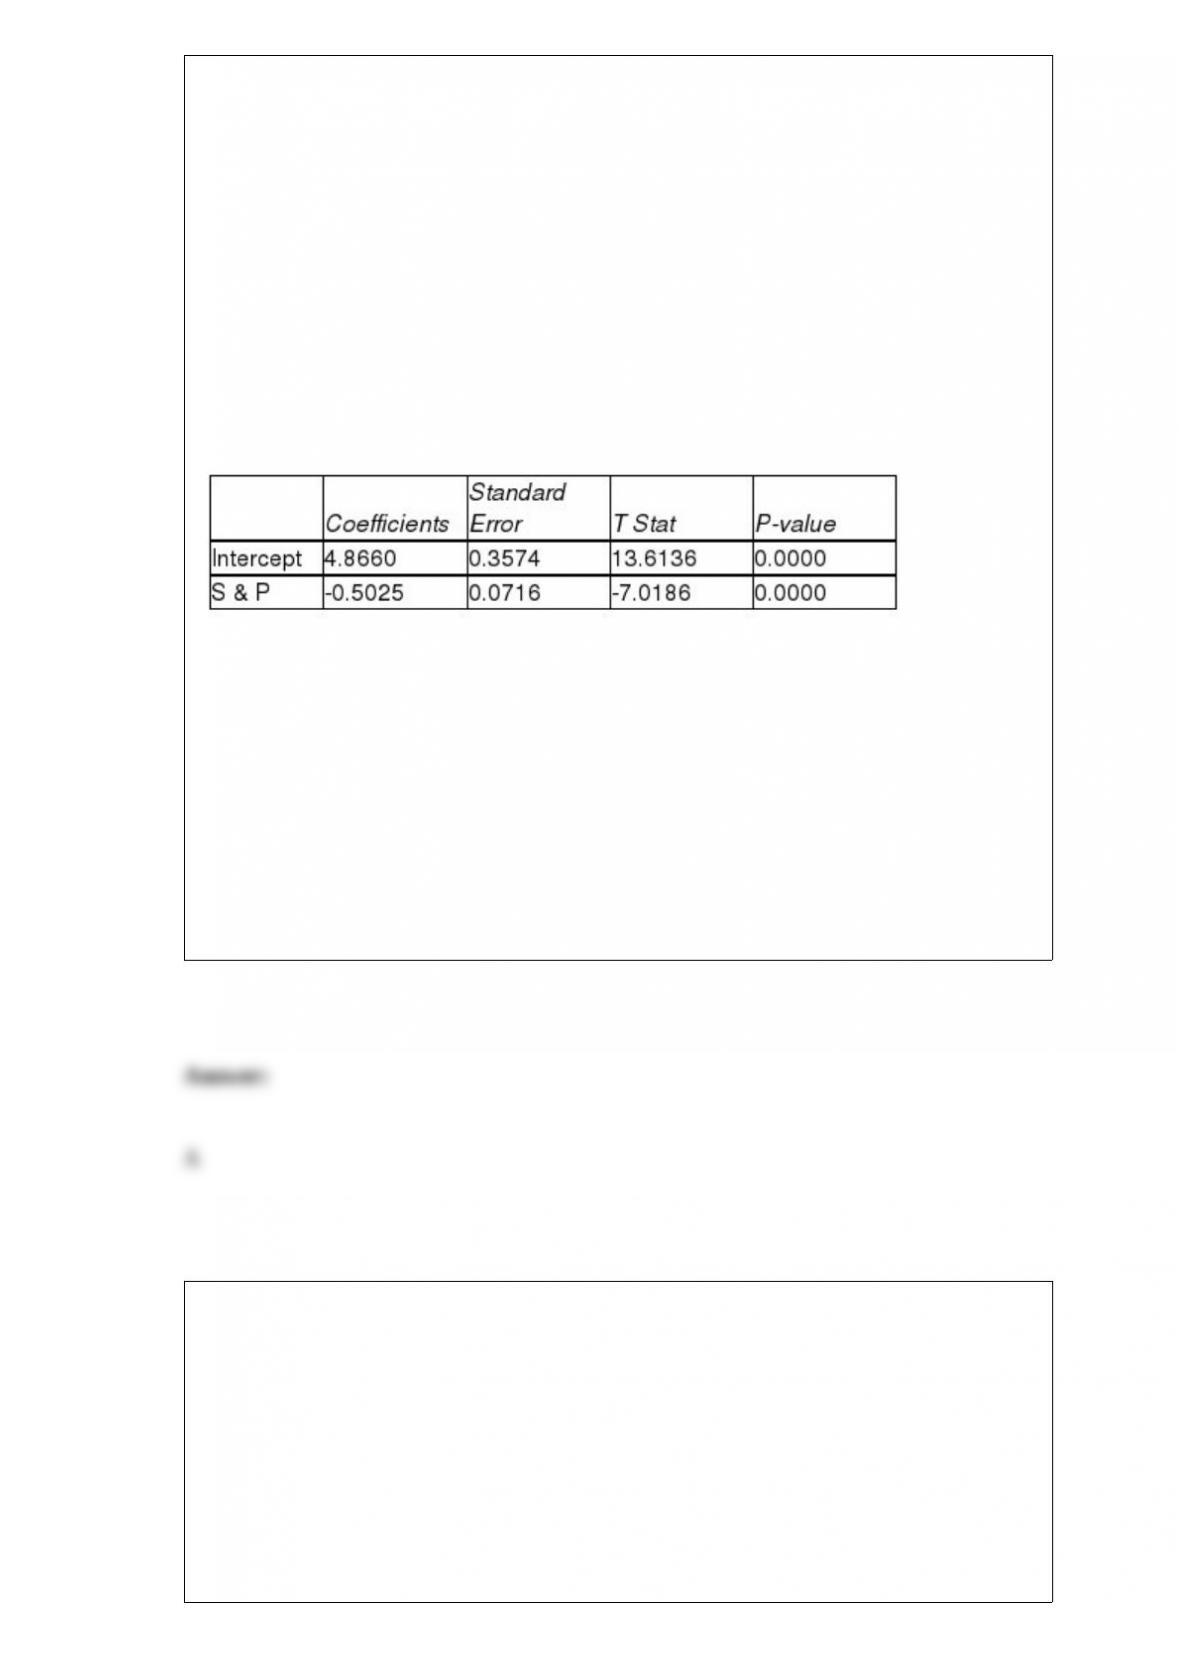
TABLE 13-7
An investment specialist claims that if one holds a portfolio that moves in the opposite
direction to the market index like the S&P 500, then it is possible to reduce the
variability of the portfolio’s return. In other words, one can create a portfolio with
positive returns but less exposure to risk.
A sample of 26 years of S&P 500 index and a portfolio consisting of stocks of private
prisons, which are believed to be negatively related to the S&P 500 index, is collected.
A regression analysis was performed by regressing the returns of the prison stocks
portfolio (Y) on the returns of S&P 500 index (X) to prove that the prison stocks
portfolio is negatively related to the S&P 500 index at a 5% level of significance. The
results are given in the following EXCEL output.
Referring to Table 13-7, to test whether the prison stocks portfolio is negatively related
to the S&P 500 index, the measured value of the test statistic is
A) -7.019.
B) -0.503.
C) 0.072.
D) 0.357.
TABLE 8-13
A wealthy real estate investor wants to decide whether it is a good investment to build a
high-end shopping complex in a suburban county in Houston. His main concern is the
total market value of the 3,605 houses in the suburban county. He commissioned a
statistical consulting group to take a sample of 200 houses and obtained a sample mean
market price of $225,000 and a sample standard deviation of $38,700. The consulting
group also found out that the mean differences between market prices and appraised
prices was $125,000 with a standard deviation of $3,400. Also the proportion of houses
in the sample that are appraised for higher than the market prices is 0.24.
Referring to Table 8-13, what will be the 90% confidence interval for the mean market
price of the houses in the suburban county constructed by the consulting group?
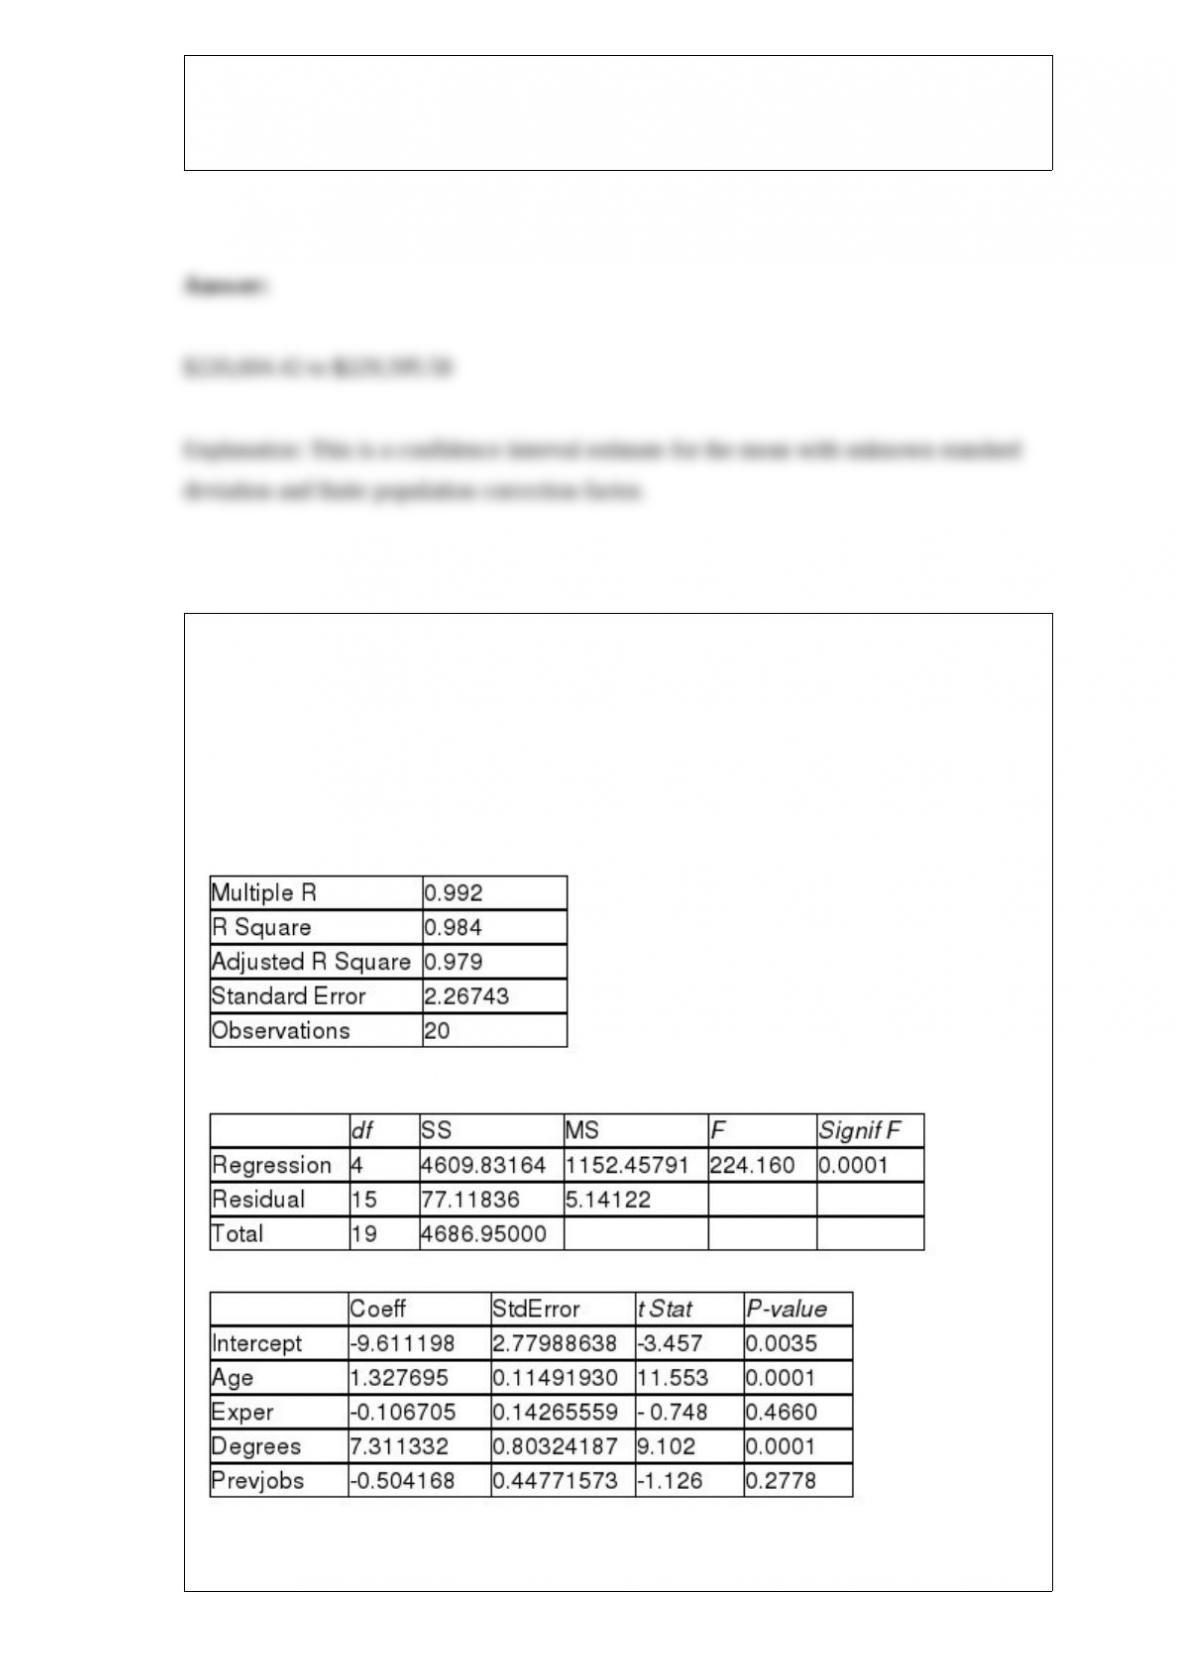
TABLE 17-3
A financial analyst wanted to examine the relationship between salary (in $1,000) and 4
variables: age (X1 = Age), experience in the field (X2 = Exper), number of degrees (X3 =
Degrees), and number of previous jobs in the field (X4 = Prevjobs). He took a sample of
20 employees and obtained the following Microsoft Excel output:
SUMMARY OUTPUT
Regression Statistics
ANOVA
Referring to Table 17-3, the analyst wants to use a t test to test for the significance of
the coefficient of X3. For a level of significance of 0.01, the critical values of the test are
________.
TABLE 9-7
A major home improvement store conducted its biggest brand recognition campaign in
the company’s history. A series of new television advertisements featuring well-known
entertainers and sports figures were launched. A key metric for the success of television
advertisements is the proportion of viewers who “like the ads a lot”. A study of 1,189
adults who viewed the ads reported that 230 indicated that they “like the ads a lot.” The
percentage of a typical television advertisement receiving the “like the ads a lot” score
is believed to be 22%. Company officials wanted to know if there is evidence that the
series of television advertisements are less successful than the typical ad (i.e. if there is
evidence that the population proportion of “like the ads a lot” for the company’s ads is
less than 0.22) at a 0.01 level of significance.
Referring to Table 9-7, the lowest level of significance at which the null hypothesis can
be rejected is ________.
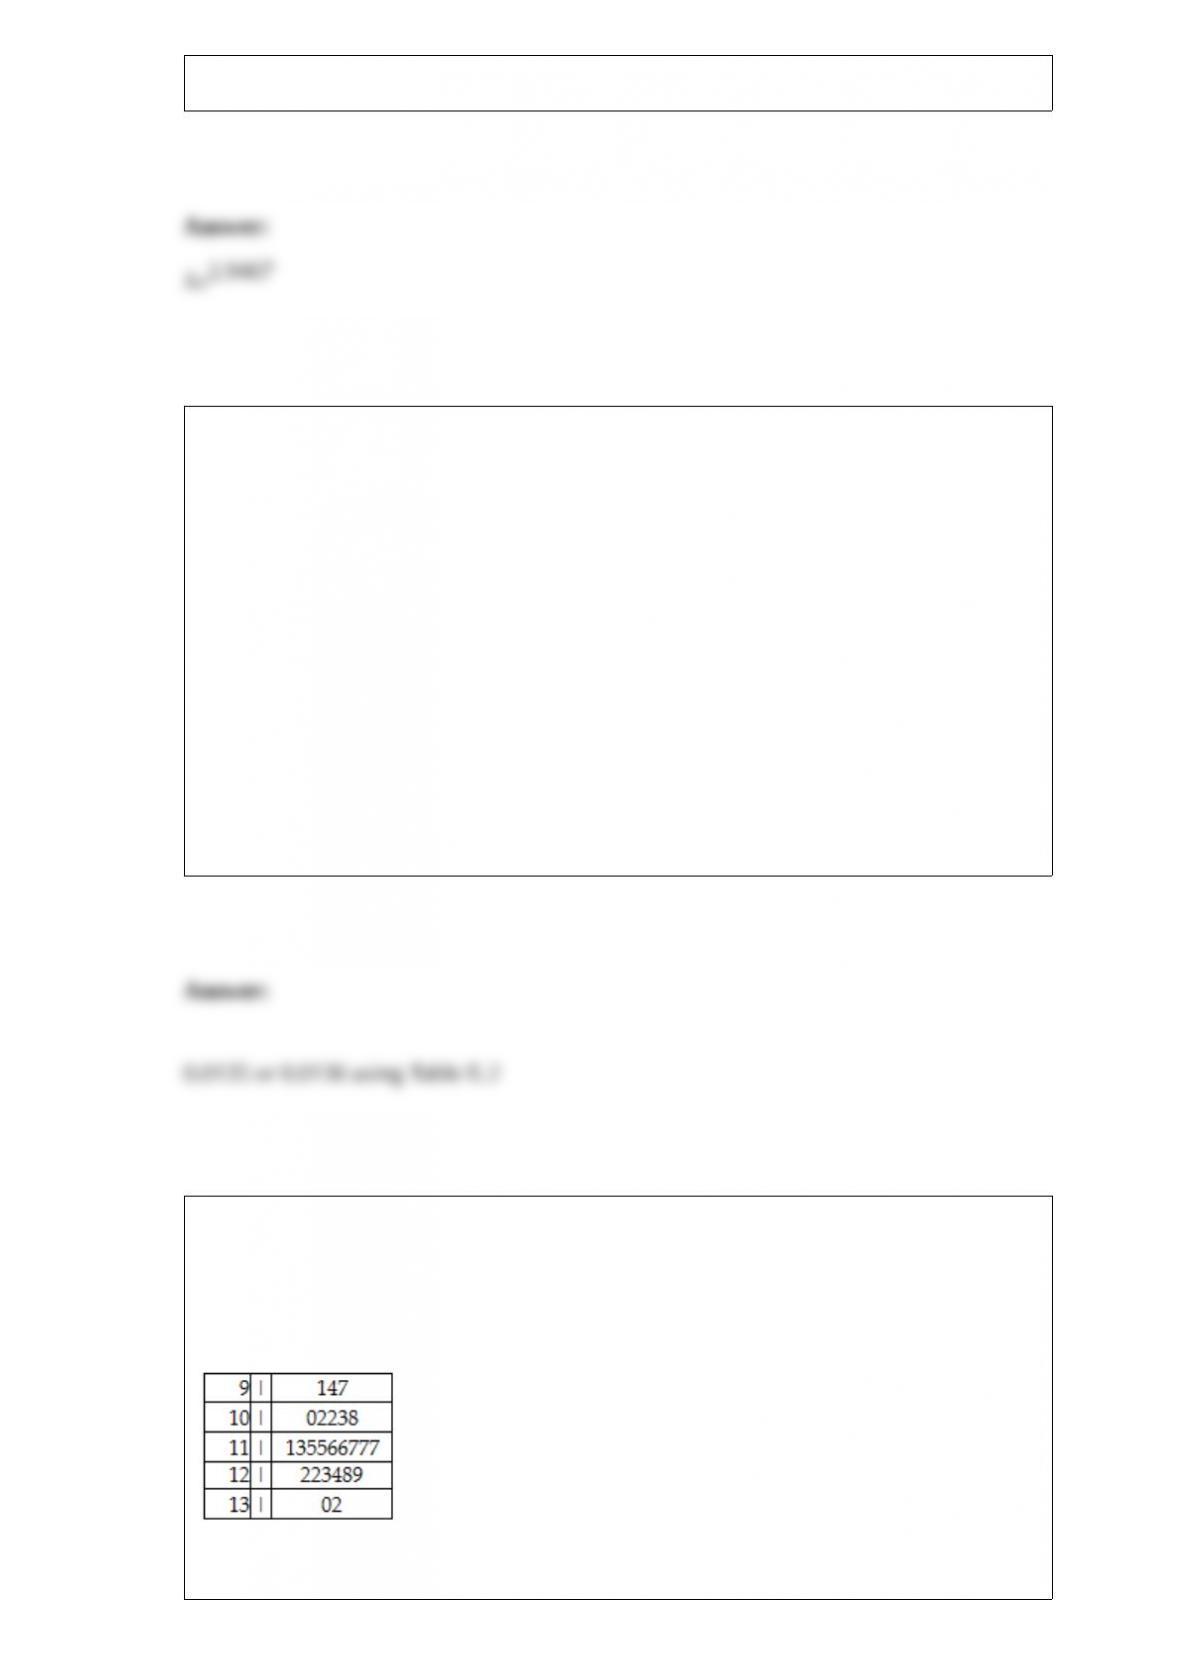
TABLE 2-13
Given below is the stem-and-leaf display representing the amount of detergent used in
gallons (with leaves in 10ths of gallons) in a day by 25 drive-through car wash
operations in Phoenix.
Referring to Table 2-13, construct a cumulative percentage polygon for the detergent
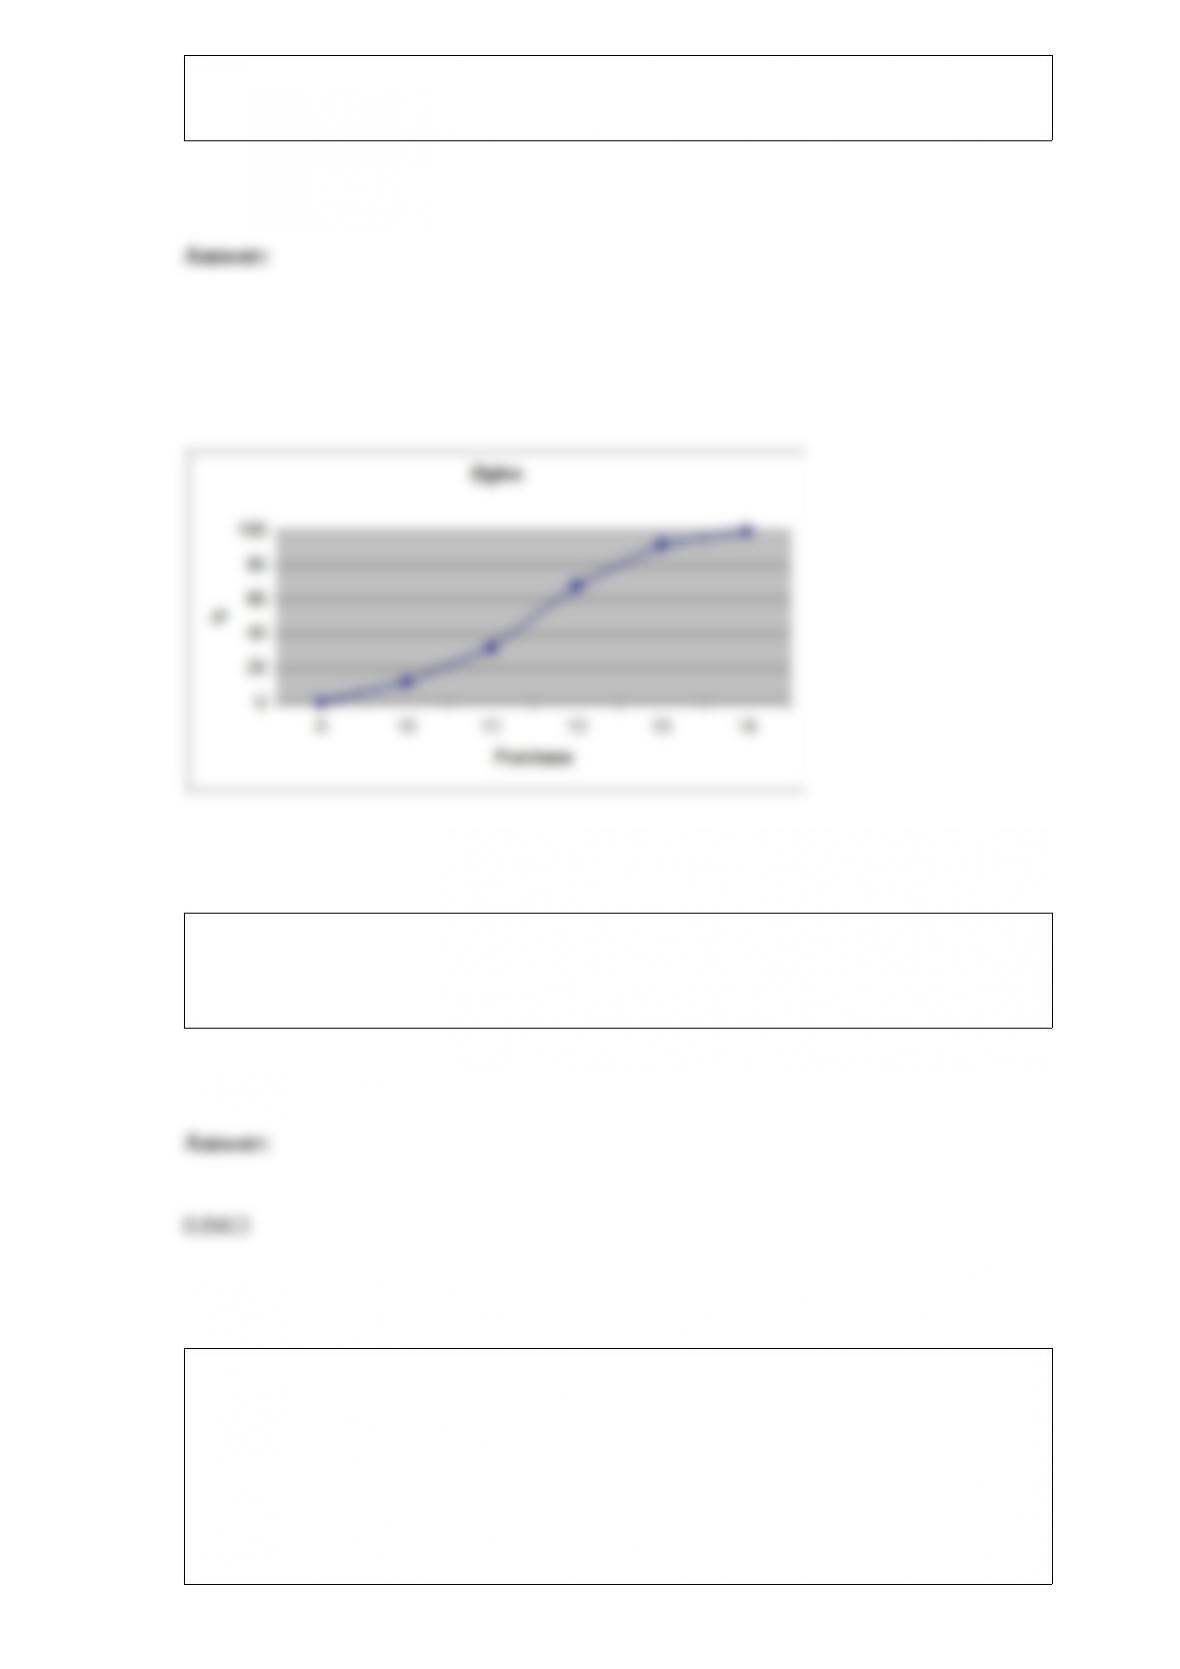
data if the corresponding frequency distribution uses “9.0 but less than 10.0” as the first
class.
The true length of boards cut at a mill with a listed length of 10 feet is normally
distributed with a mean of 123 inches and a standard deviation of 1 inch. What
proportion of the boards will be less than 124 inches?
Referring to Table 14-19, what are the degrees of freedom for the
chi-square distribution when testing whether the model is a
good-*tting model?
TABLE 14-19
The marketing manager for a nationally franchised lawn service
company would like to study the characteristics that differentiate
home owners who do and do not have a lawn service. A random
sample of 30 home owners located in a suburban area near a large
city was selected; 11 did not have a lawn service (code 0) and 19 had
a lawn service (code 1). Additional information available concerning
these 30 home owners includes family income (Income, in thousands
of dollars) and lawn size (Lawn Size, in thousands of square feet).
The PHStat output is given below:
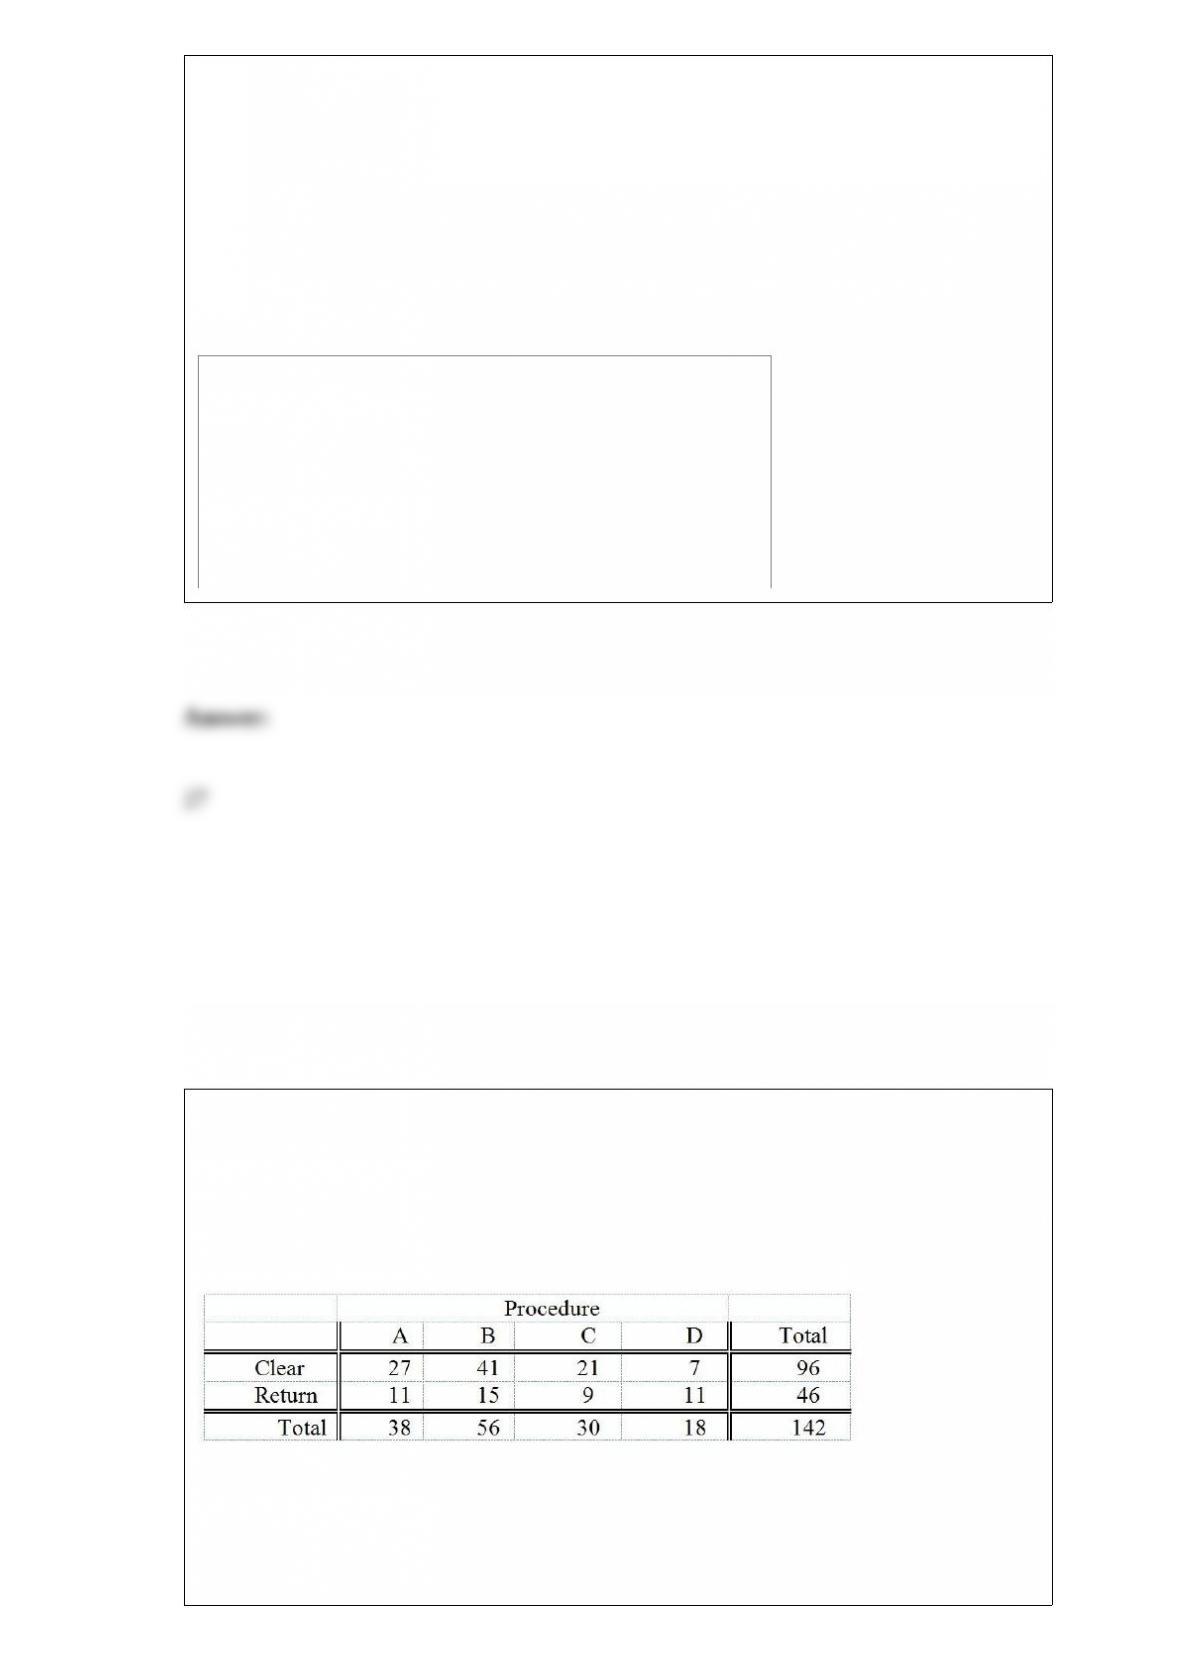
TABLE 12-5
Four surgical procedures currently are used to install pacemakers. If the patient does not
need to return for follow-up surgery, the operation is called a “clear” operation. A heart
center wants to compare the proportion of clear operations for the 4 procedures, and
collects the following numbers of patients from their own records:
They will use this information to test for a difference among the proportion of clear
operations using a chi-square test with a level of significance of 0.05.
Referring to Table 12-5, the test will involve ________ degrees of freedom.
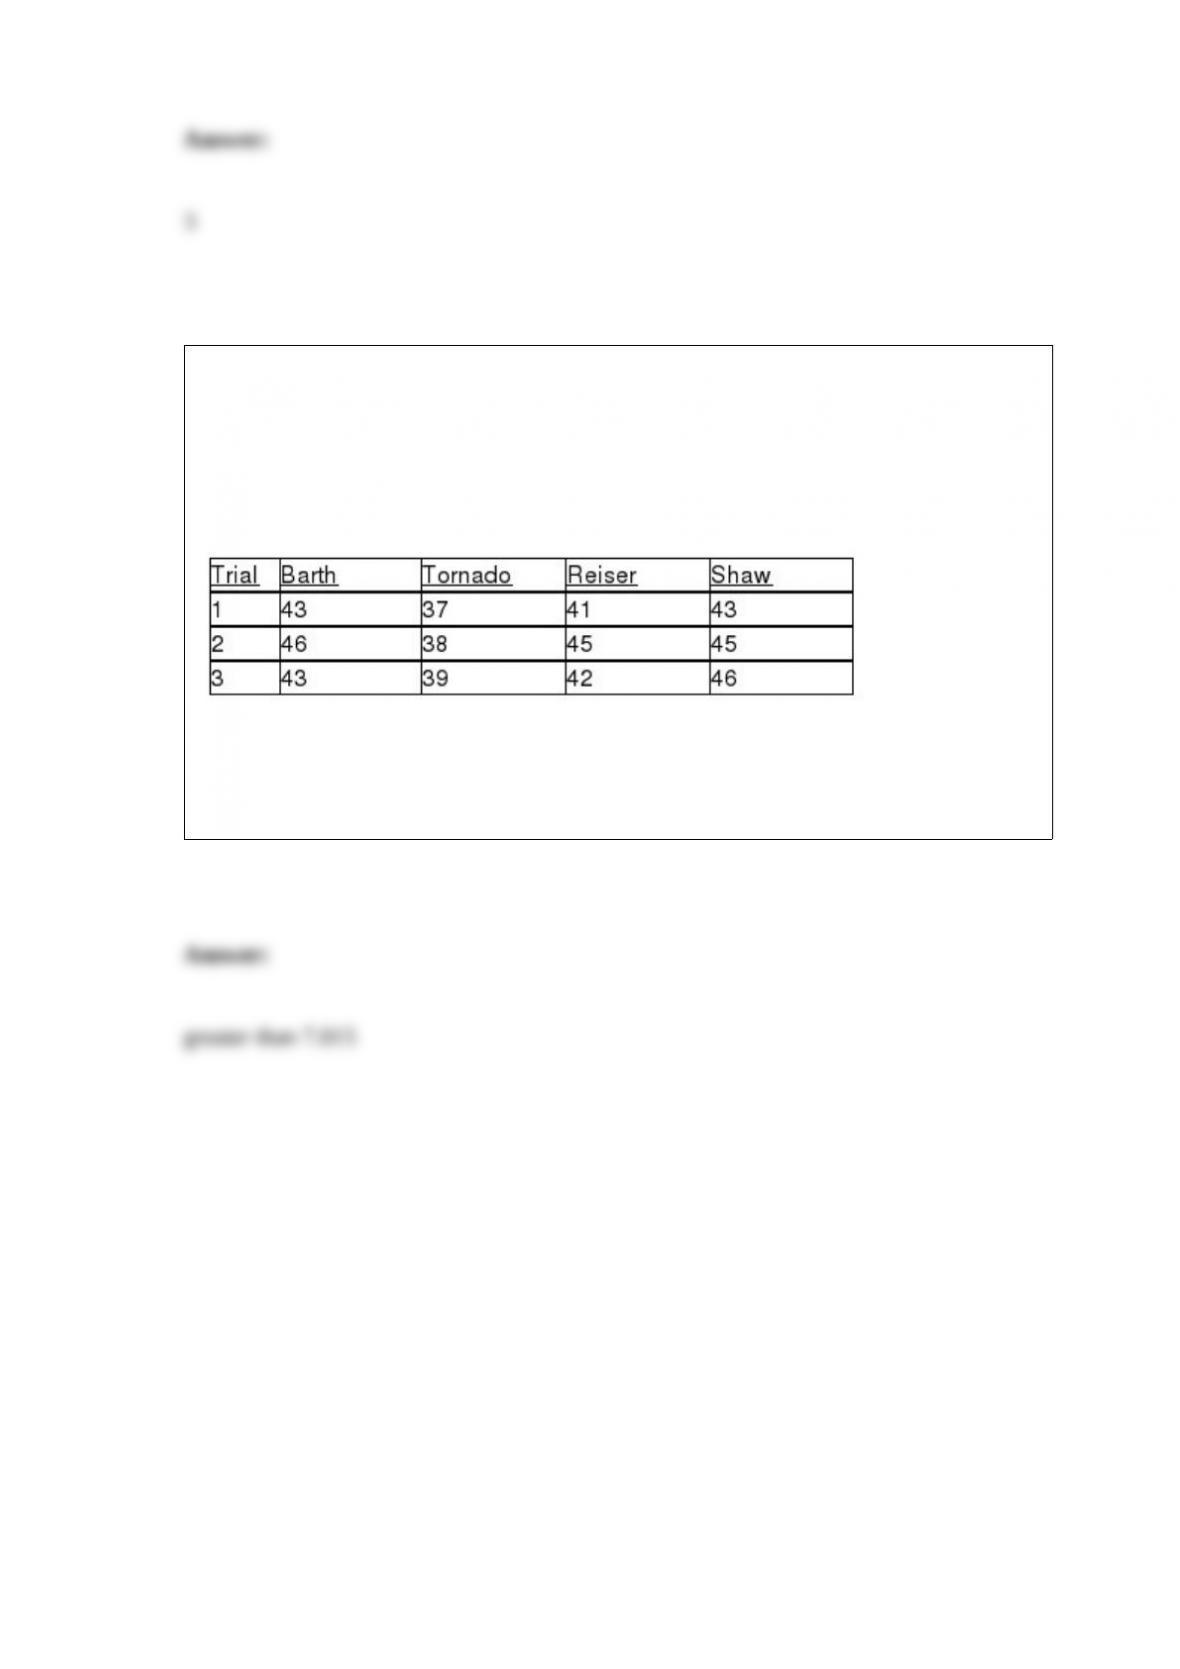
TABLE 12-16
As part of an evaluation program, a sporting goods retailer wanted to compare the
downhill coasting speeds of 4 brands of bicycles. She took 3 of each brand and
determined their maximum downhill speeds. The results are presented in miles per hour
in the table below.
Referring to Table 12-16, the decision rule for a level of significance of 0.05 using the
Kruskal-Wallis test is to reject the null hypothesis if the test statistic H is ________,
assuming that the sample sizes were large enough to use a chi-square approximation.