
Referring to Table 14-16, what is the value of the test statistic to
determine whether engine size makes a signiticant contribution to the
regression model in the presence of the other independent variable at
a 5% level of signiticance?
TABLE 14-16
What are the factors that determine the acceleration time (in sec.)
from 0 to 60 miles per hour of a car? Data on the following variables
for 30 di.erent vehicle models were collected:
Y (Accel Time): Acceleration time in sec.
X1 (Engine Size): c.c.
X2 (Sedan): 1 if the vehicle model is a sedan and 0 otherwise
The regression results using acceleration time as the dependent
variable and the remaining variables as the independent variables are
presented below.
The various residual plots are as shown below.

The coefficient of partial determinations and are 0.3301,
and 0.0594, respectively.
The coefficient of determination for the regression model using each
of the 2 independent variables as the dependent variable and the
other independent variable as independent variables ( ) are,
respectively 0.0077, and 0.0077.
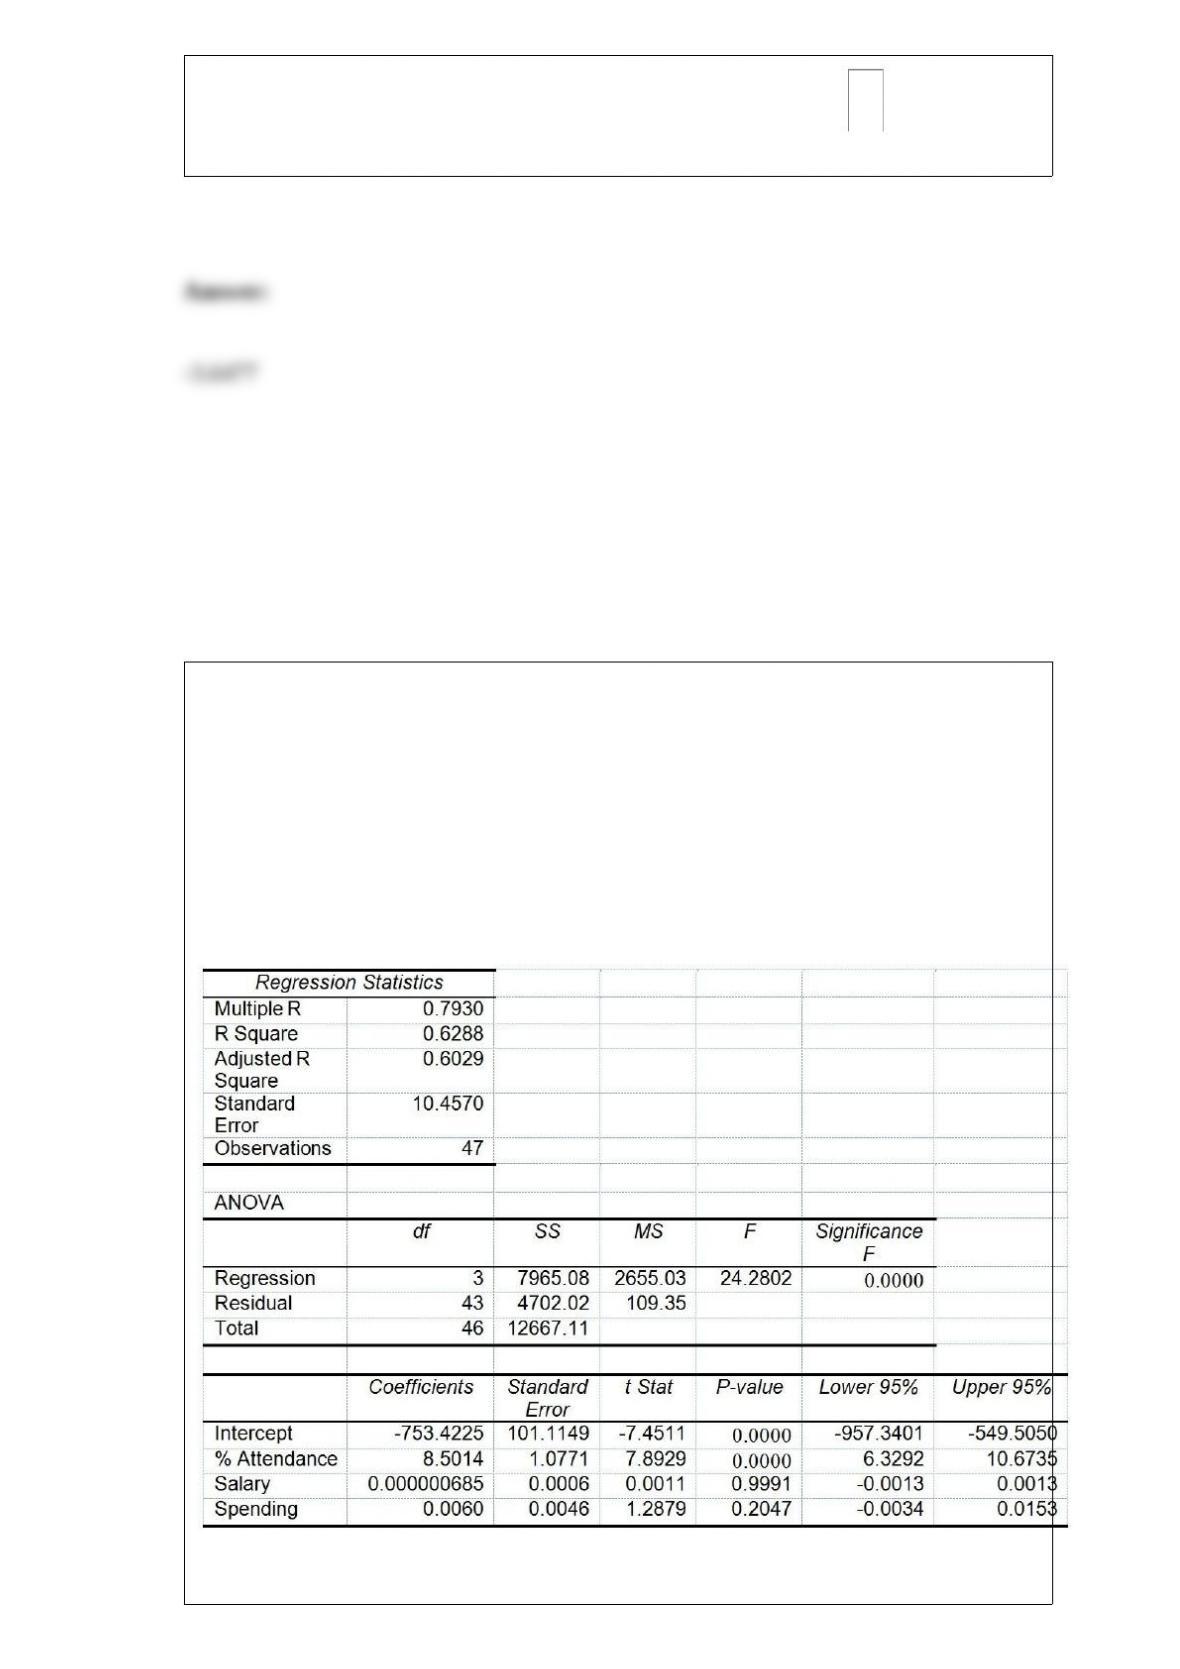
TABLE 17-8
The superintendent of a school district wanted to predict the percentage of students
passing a sixth-grade proficiency test. She obtained the data on percentage of students
passing the proficiency test (% Passing), daily mean of the percentage of students
attending class (% Attendance), mean teacher salary in dollars (Salaries), and
instructional spending per pupil in dollars (Spending) of 47 schools in the state.
Following is the multiple regression output with Y = % Passing as the dependent
variable, X1 = % Attendance, X2 = Salaries and X3 = Spending:
Referring to Table 17-8, what is the value of the test statistic when testing whether
instructional spending per pupil has any effect on the percentage of students passing the
proficiency test, taking into account the effect of all the other independent variables?
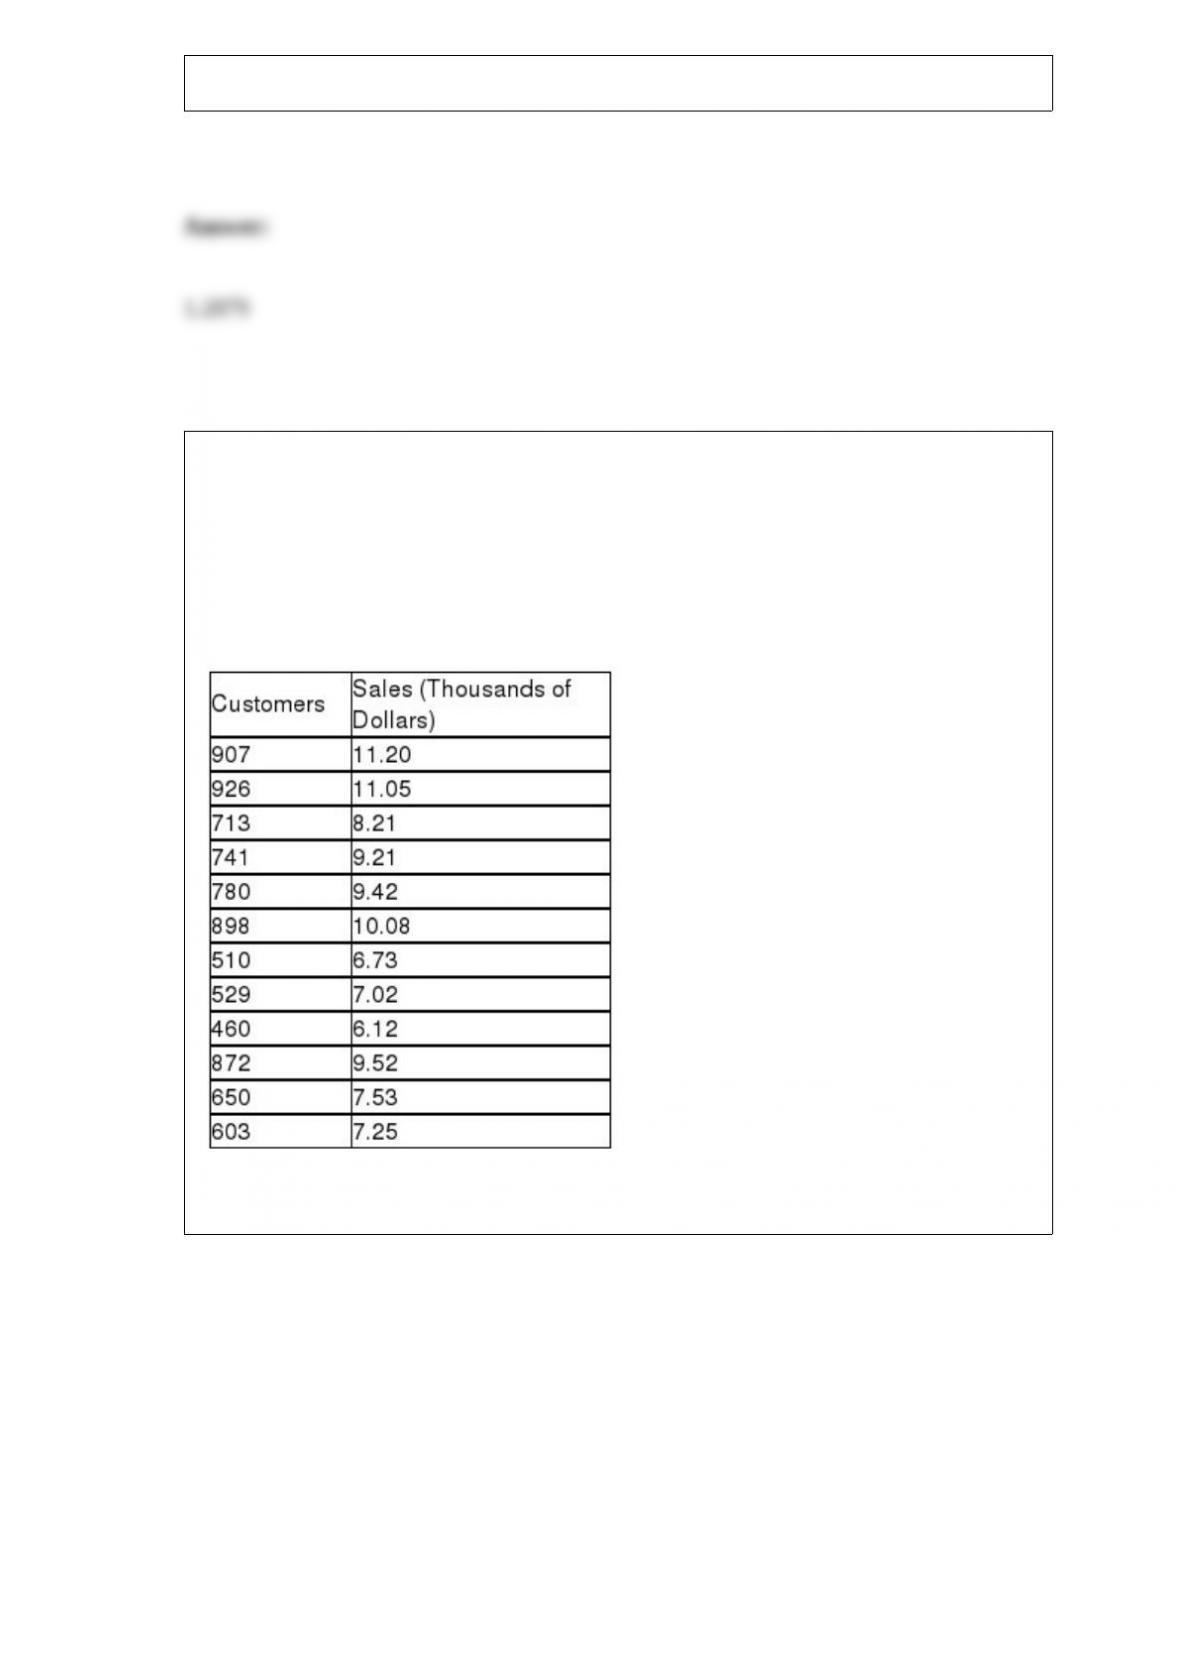
TABLE 13-10
The management of a chain electronic store would like to develop a model for
predicting the weekly sales (in thousands of dollars) for individual stores based on the
number of customers who made purchases. A random sample of 12 stores yields the
following results:
Referring to Table 13-10, generate the scatter plot.
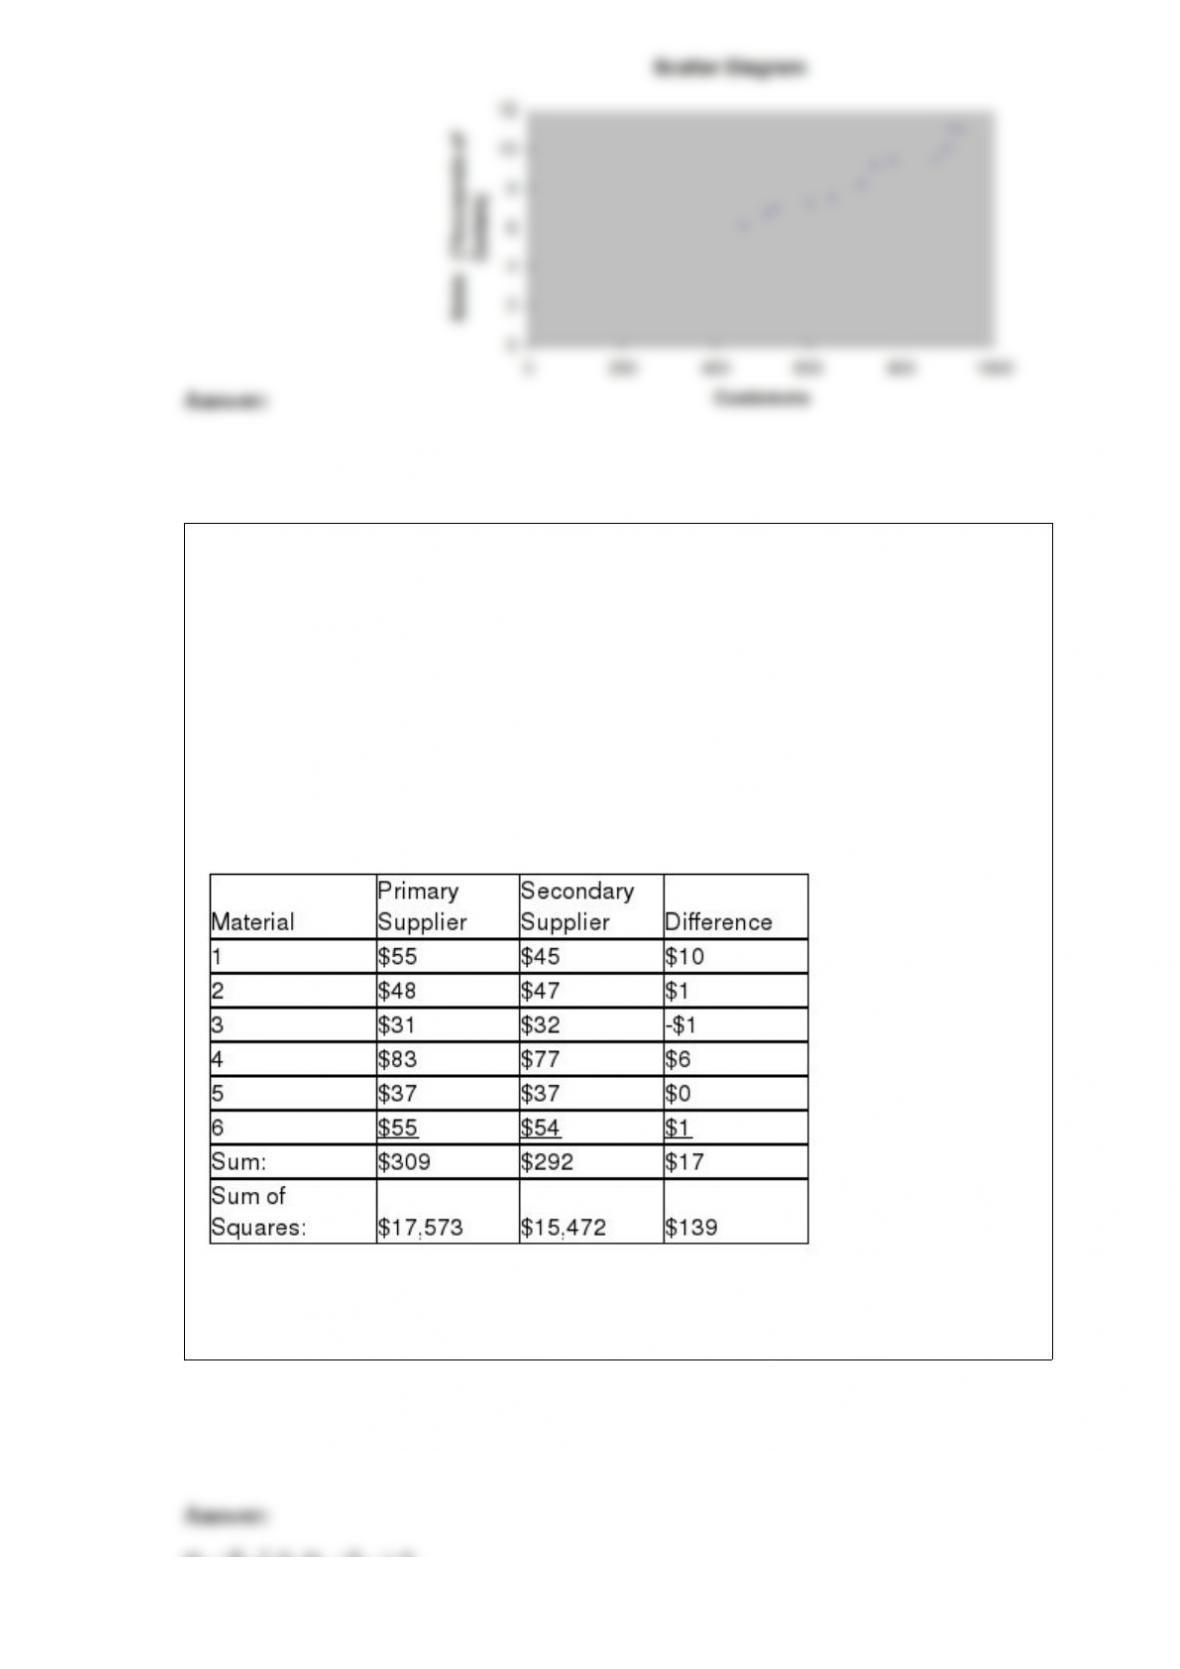
TABLE 10-7
A buyer for a manufacturing plant suspects that his primary supplier of raw materials is
overcharging. In order to determine if his suspicion is correct, he contacts a second
supplier and asks for the prices on various identical materials. He wants to compare
these prices with those of his primary supplier. The data collected is presented in the
table below, with some summary statistics presented (all of these might not be
necessary to answer the questions which follow). The buyer believes that the
differences are normally distributed and will use this sample to perform an appropriate
test at a level of significance of 0.01.
Referring to Table 10-7, the hypotheses that the buyer should test are a null hypothesis
that ________ versus an alternative hypothesis that ________.

A food processor packages orange juice in small jars. The weights of the filled jars are
approximately normally distributed with a mean of 10.5 ounces and a standard
deviation of 0.3 ounce. Find the proportion of all jars packaged by this process that
have weights that fall below 10.875 ounces.