True or False: The principle of parsimony indicates that the simplest model that gets the
job done adequately should be used.
True or False: A regression had the following results: SST = 82.55, SSE = 29.85. It can
be said that 73.4% of the variation in the dependent variable is explained by the
independent variables in the regression.
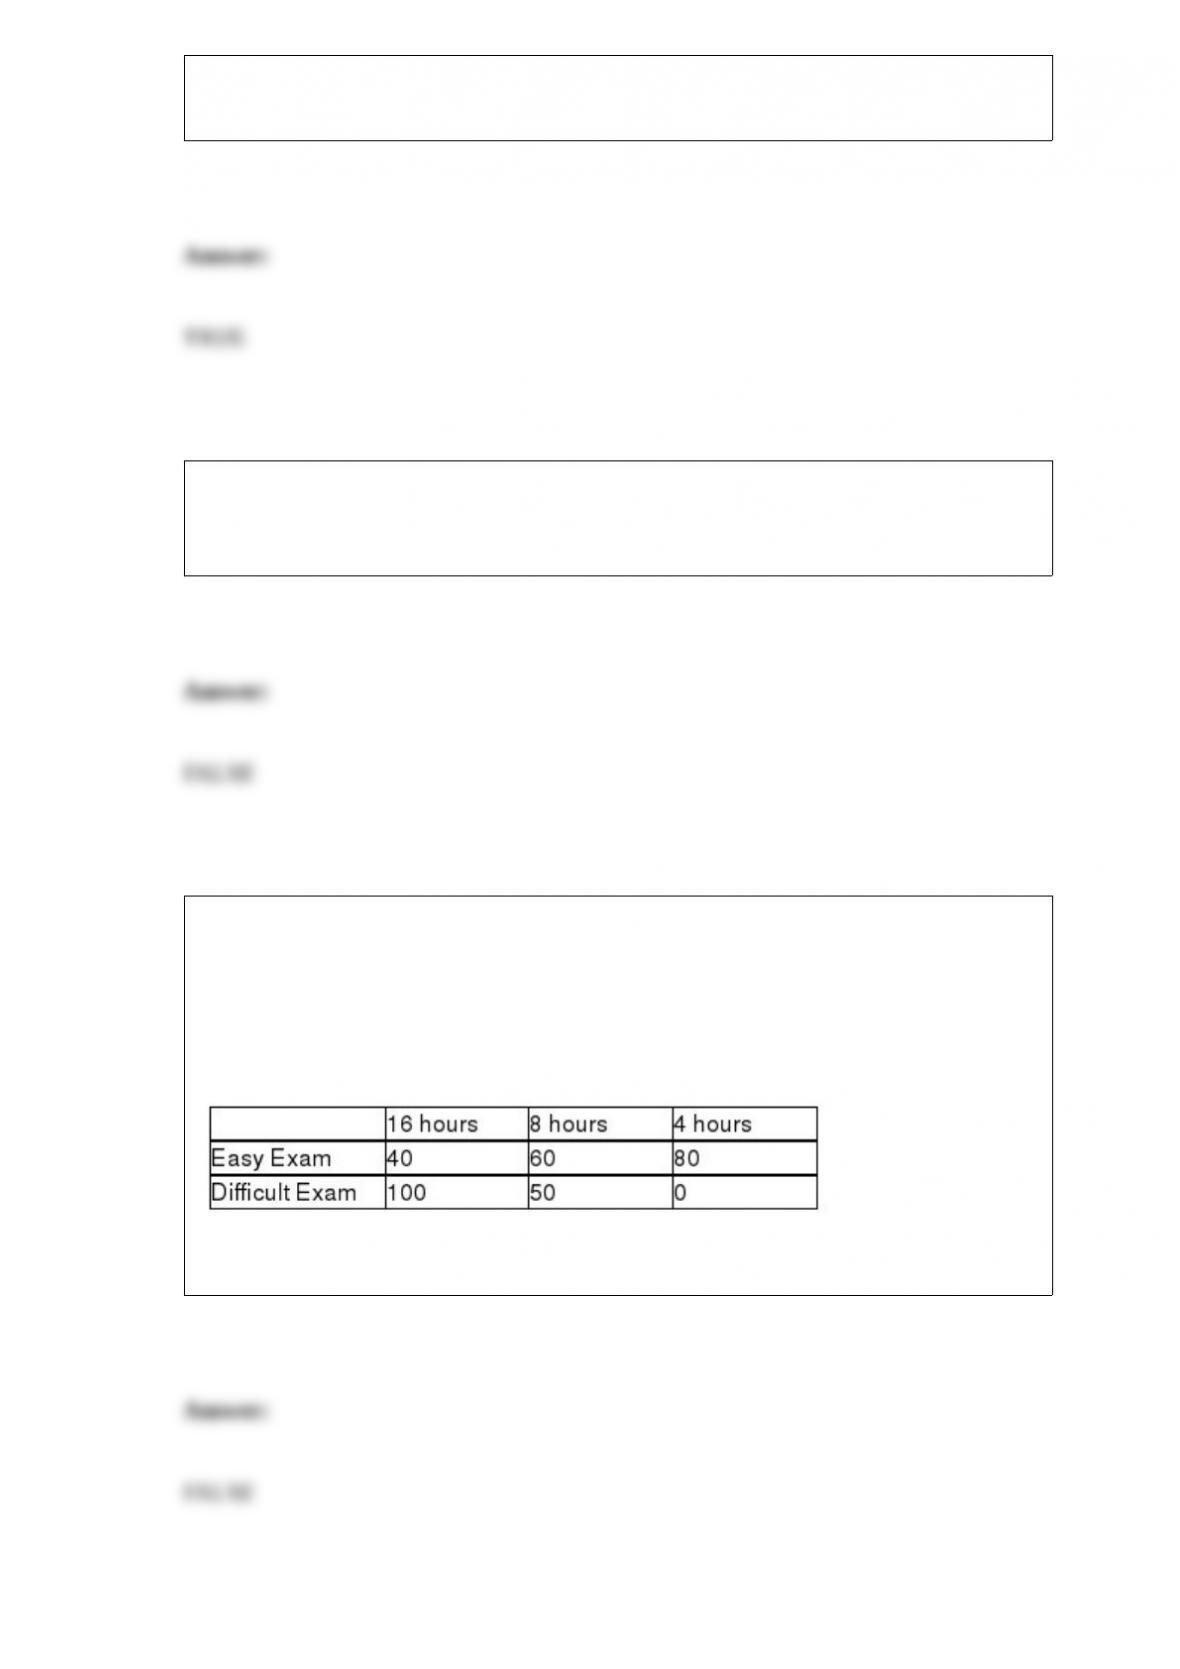
True or False: TABLE 19-6
A student wanted to find out the optimal strategy to study for a Business Statistics
exam. He constructed the following payoff table based on the mean amount of time he
needed to study every week for the course and the degree of difficulty of the exam.
From the information that he gathered from students who had taken the course, he
concluded that there was a 40% probability that the exam would be easy.
Referring to Table 19-6, the optimal strategy using the expected monetary value
criterion is to study 8 hours per week on average for the exam.
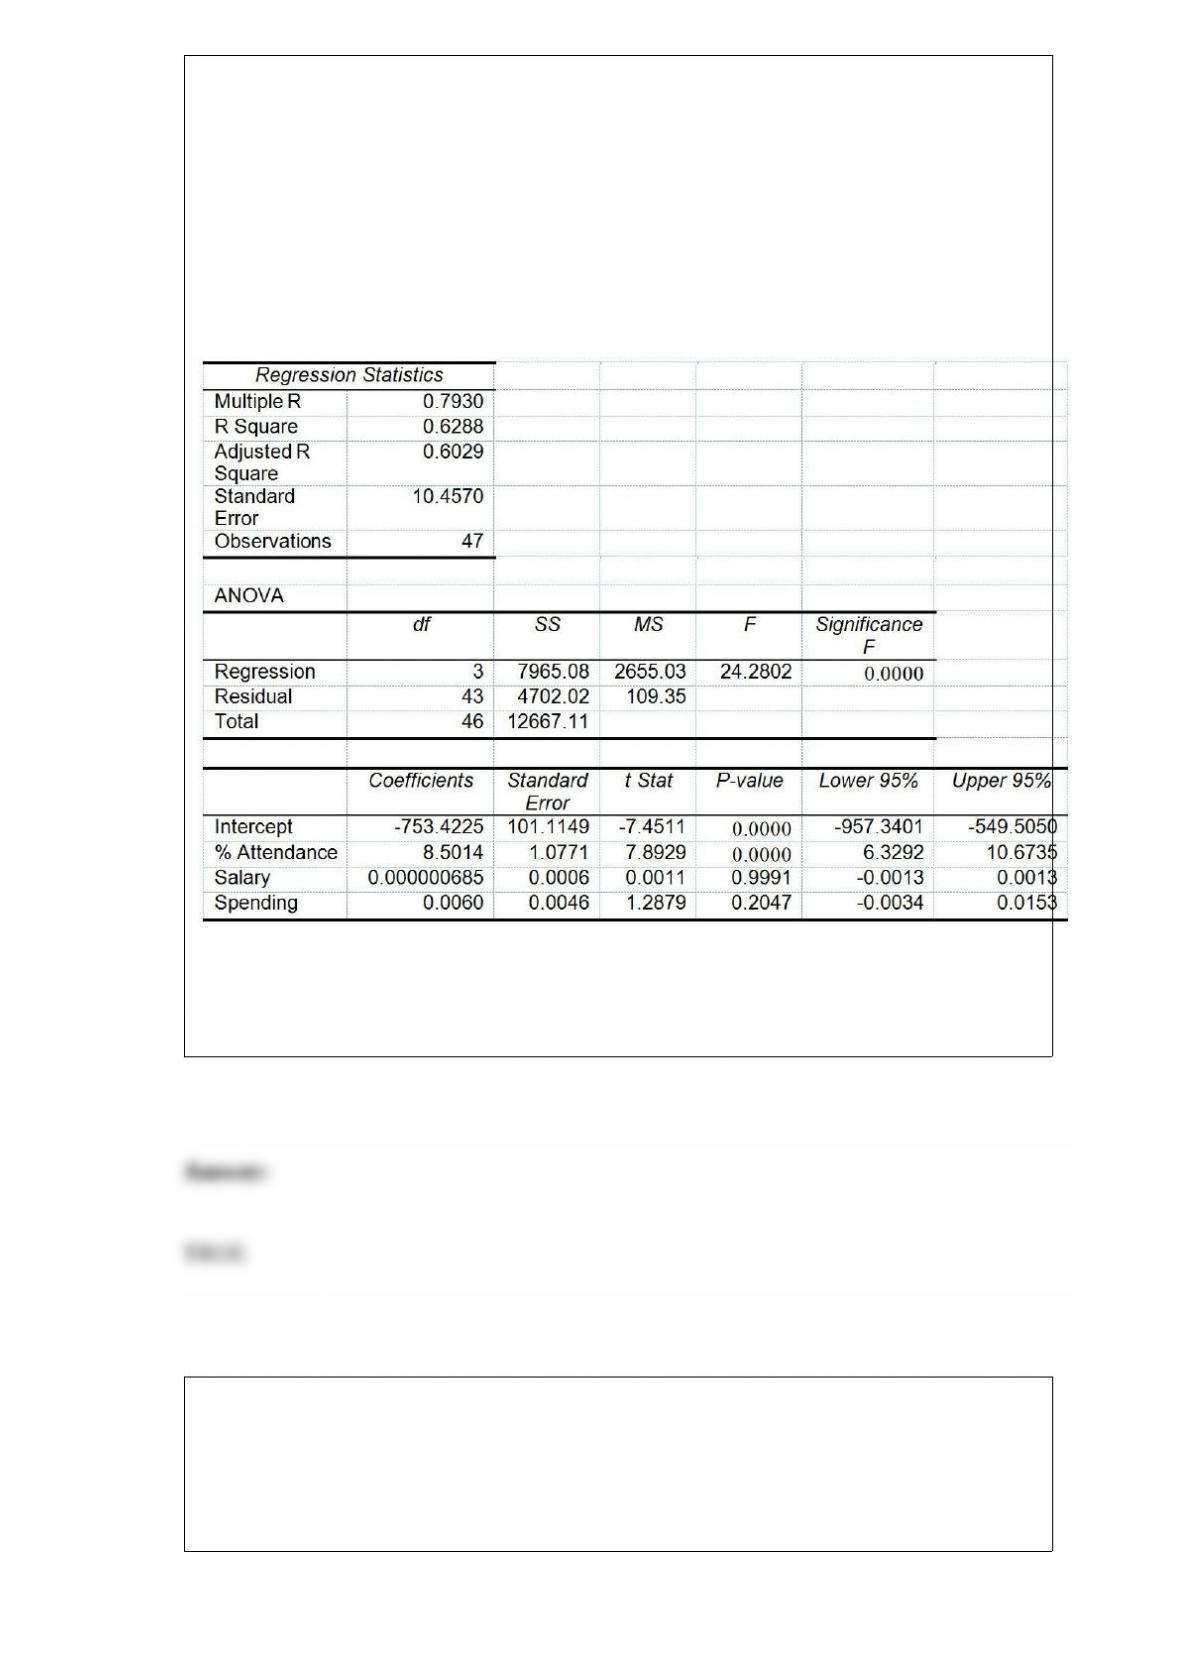
True or False: TABLE 17-8
The superintendent of a school district wanted to predict the percentage of students
passing a sixth-grade proficiency test. She obtained the data on percentage of students
passing the proficiency test (% Passing), daily mean of the percentage of students
attending class (% Attendance), mean teacher salary in dollars (Salaries), and
instructional spending per pupil in dollars (Spending) of 47 schools in the state.
Following is the multiple regression output with Y = % Passing as the dependent
variable, X1 = % Attendance, X2 = Salaries and X3 = Spending:
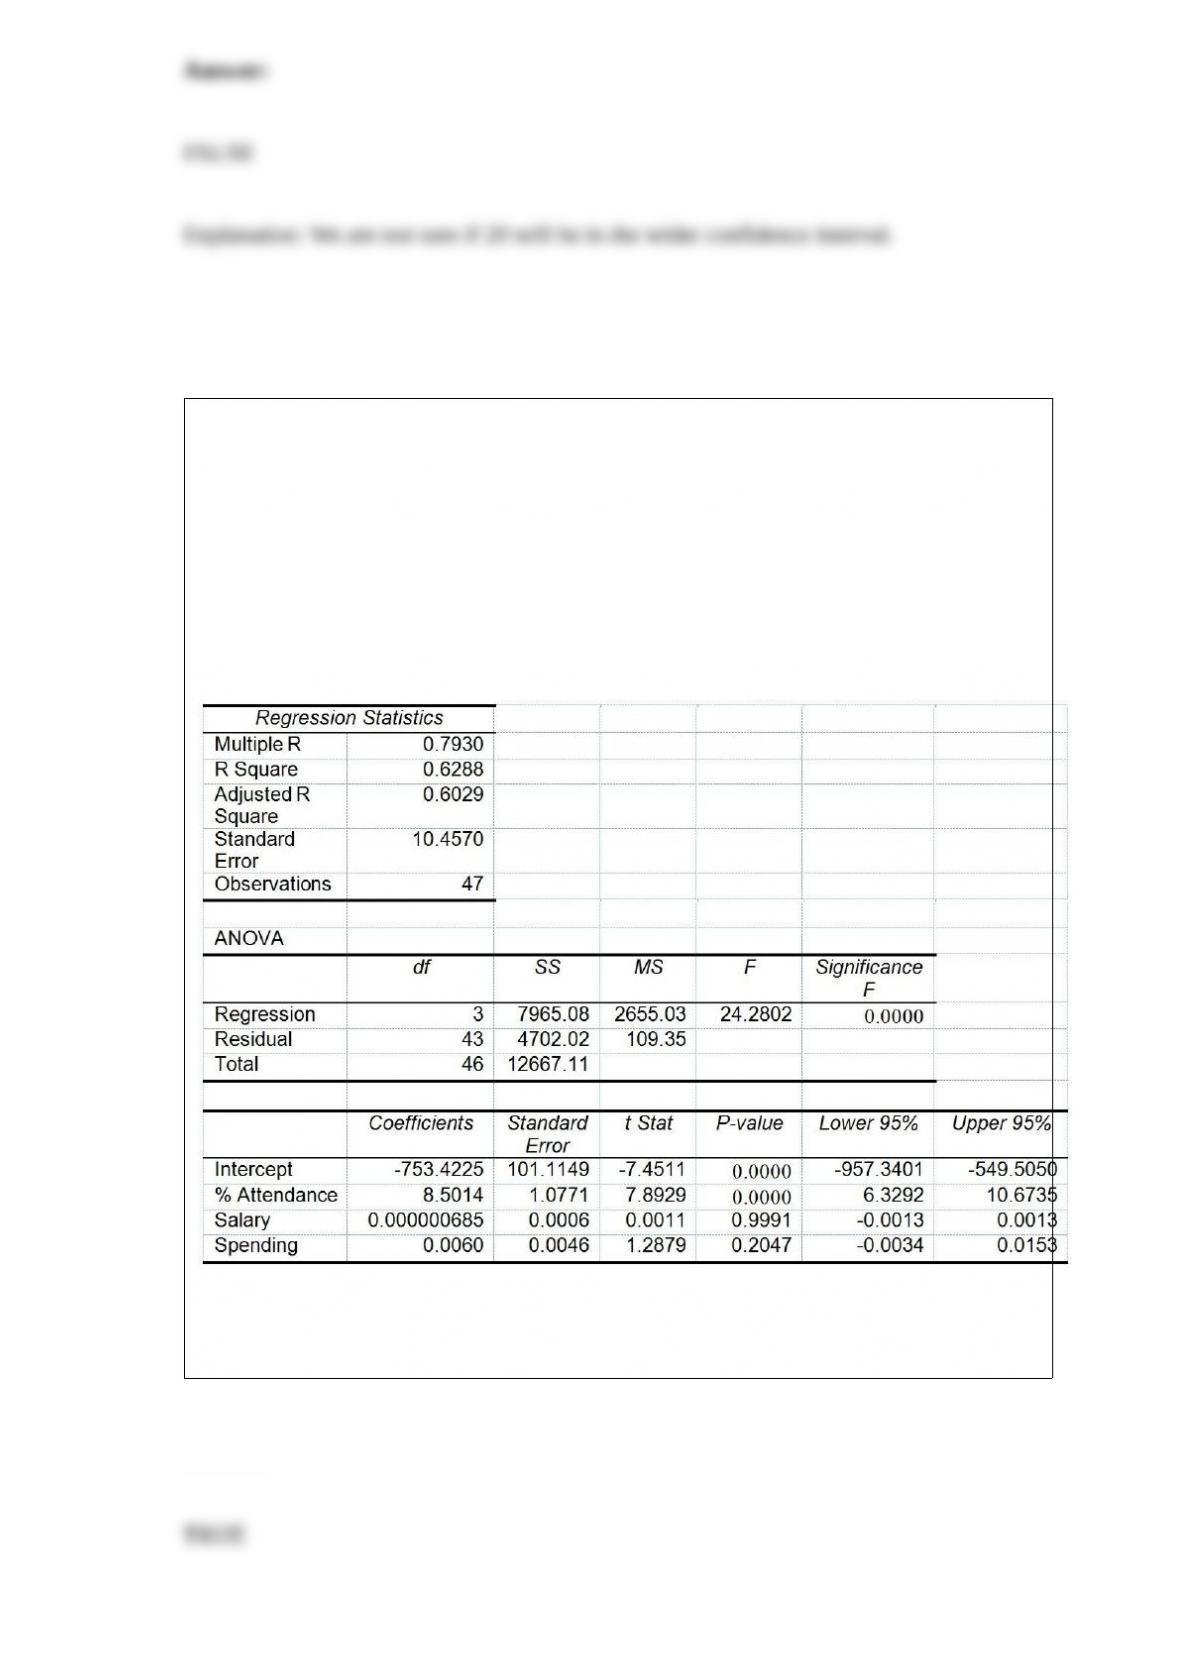
Referring to Table 17-8, there is sufficient evidence that the daily mean of the
percentage of students attending class has an effect on the percentage of students
passing the proficiency test while holding constant the effect of all the other
independent variables at a 5% level of significance.
TABLE 11-5
A hotel chain has identically small sized resorts in 5 locations in different small islands.
The data that follow resulted from analyzing the hotel occupancies on randomly
selected days in the 5 locations.

Analysis of Variance
* or p < 0.005, tabular value
True or False: Referring to Table 11-5, if a level of significance of 0.05 is chosen, the
null hypothesis should be rejected.
True or False: TABLE 17-10
Given below are results from the regression analysis where the dependent variable is
the number of weeks a worker is unemployed due to a layoff (Unemploy) and the
independent variables are the age of the worker (Age), the number of years of education
received (Edu), the number of years at the previous job (Job Yr), a dummy variable for
marital status (Married: 1 = married, 0 = otherwise), a dummy variable for head of
household (Head: 1 = yes, 0 = no) and a dummy variable for management position
(Manager: 1 = yes, 0 = no). We shall call this Model 1. The coefficient of partial
determination ( ) of each of the 6 predictors are, respectively,
0.2807, 0.0386, 0.0317, 0.0141, 0.0958, and 0.1201.
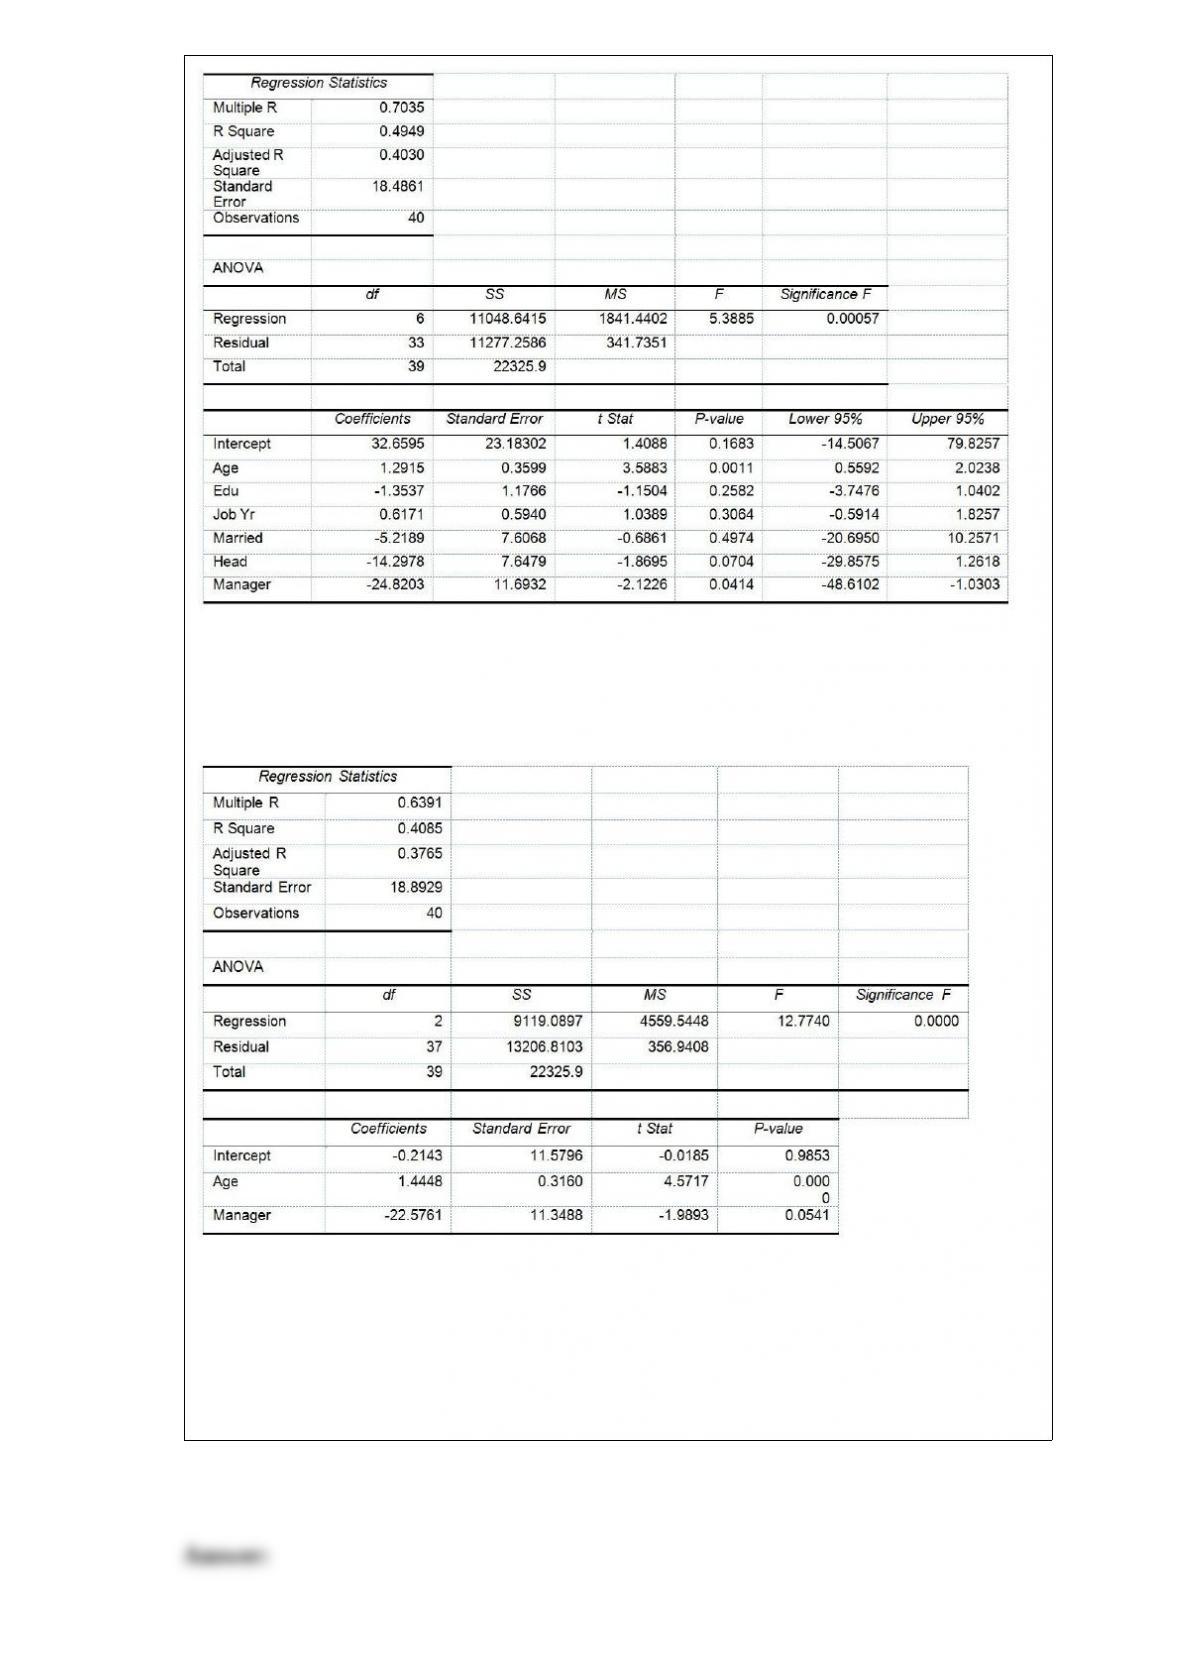
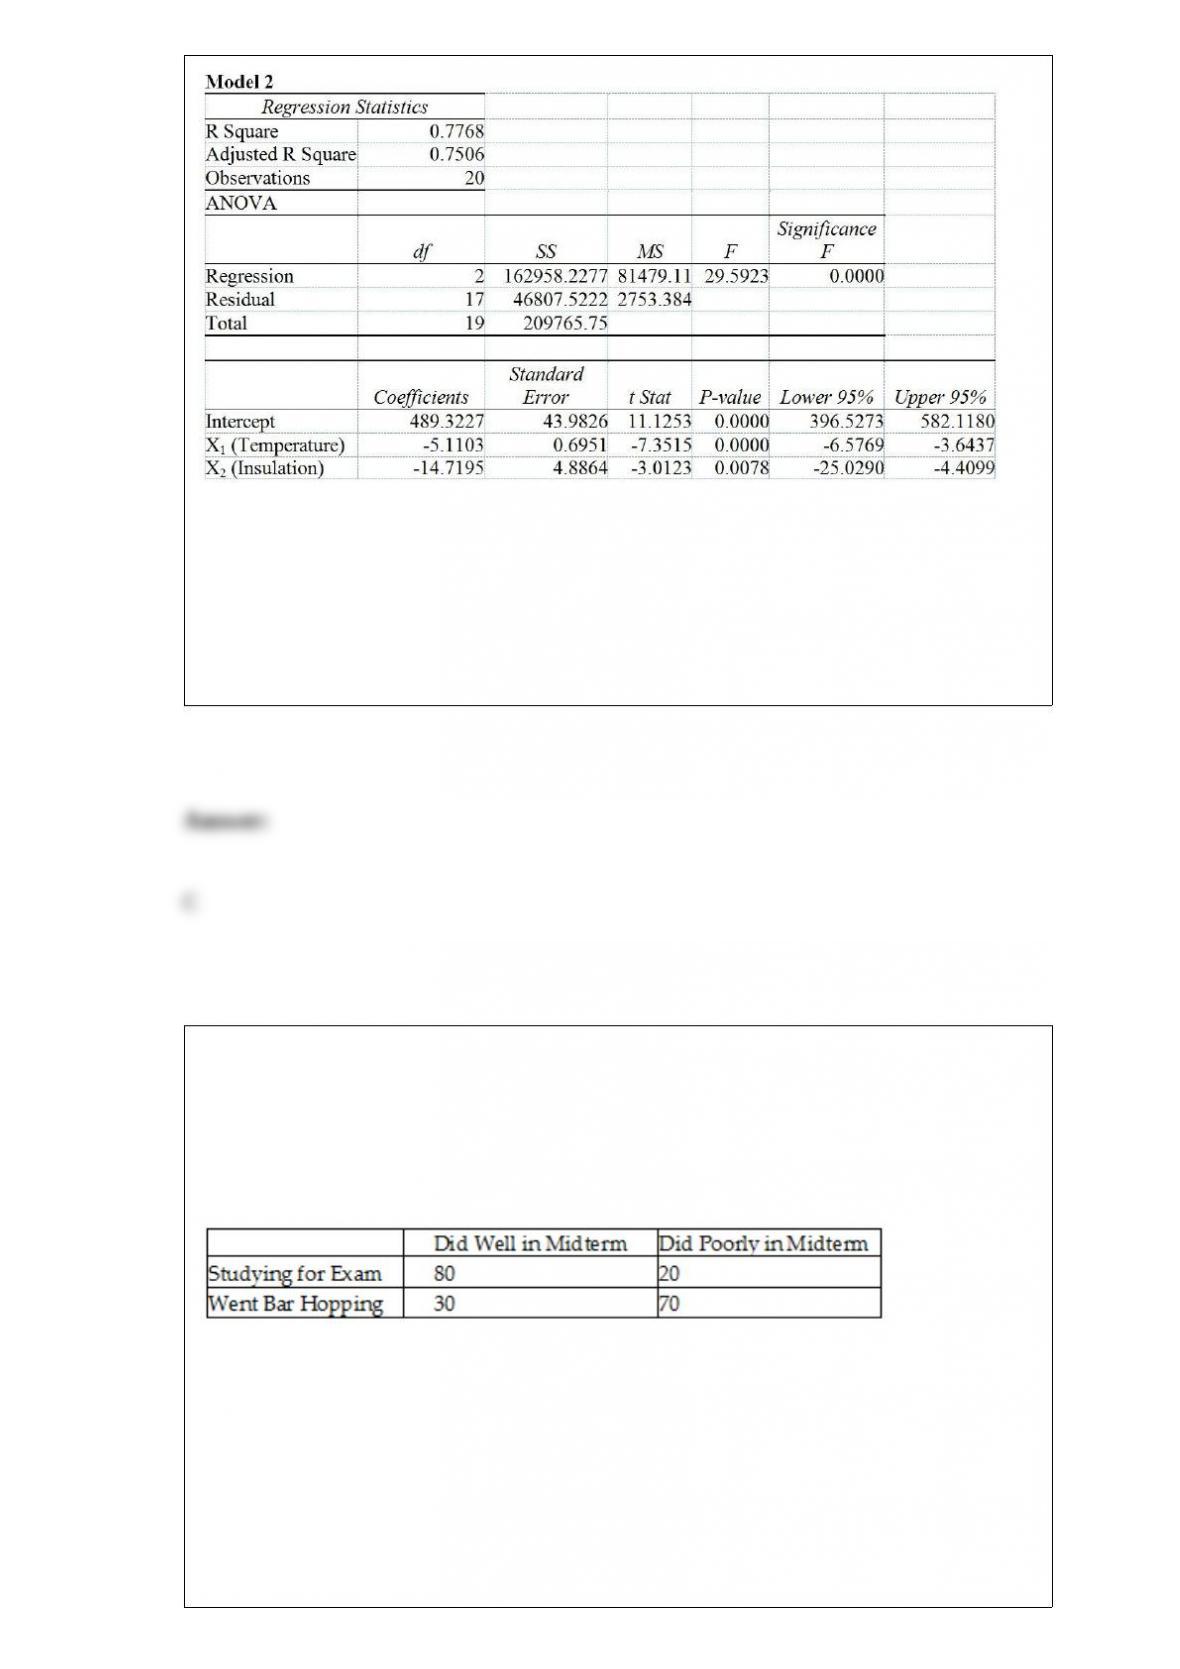
Model 2 is the regression analysis where the dependent variable is Unemploy and the
independent variables are Age and Manager. The results of the regression analysis are
given below:
Referring to Table 17-10, Model 1, we can conclude that, holding constant the effect of
the other independent variables, the number of years of education received has no
impact on the mean number of weeks a worker is unemployed due to a layoff at a 1%
level of significance if all we have is the information of the 95% confidence interval
estimate forβ2.
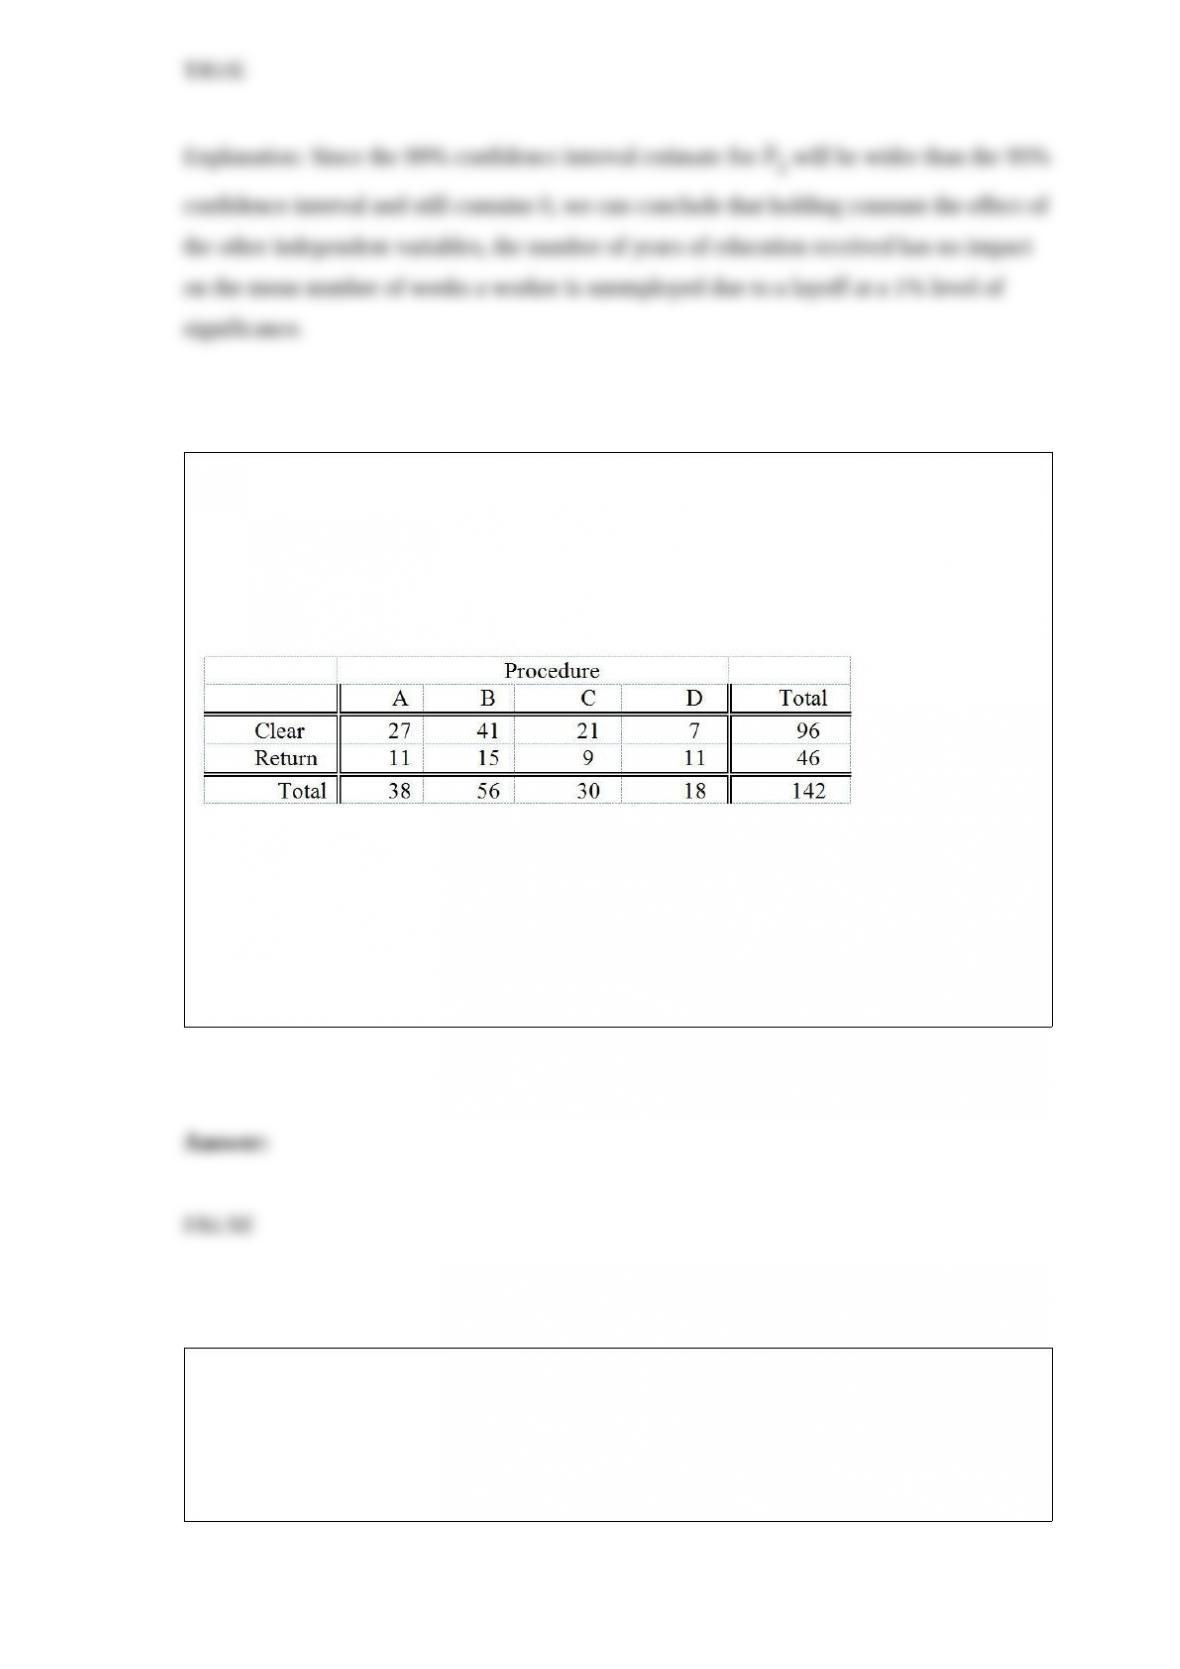
TABLE 12-5
Four surgical procedures currently are used to install pacemakers. If the patient does not
need to return for follow-up surgery, the operation is called a “clear” operation. A heart
center wants to compare the proportion of clear operations for the 4 procedures, and
collects the following numbers of patients from their own records:
They will use this information to test for a difference among the proportion of clear
operations using a chi-square test with a level of significance of 0.05.
True or False: Referring to Table 12-5, there is sufficient evidence to conclude that the
proportions between procedure A and procedure B are different at a 0.05 level of
significance.
True or False: A sample is used to obtain a 95% confidence interval for the mean of a
population. The confidence interval goes from 15 to 19. If the same sample had been
used to test the null hypothesis that the mean of the population is equal to 20 versus the
alternative hypothesis that the mean of the population differs from 20, the null
hypothesis could be accepted at a level of significance of 0.01.
True or False: TABLE 17-8
The superintendent of a school district wanted to predict the percentage of students
passing a sixth-grade proficiency test. She obtained the data on percentage of students
passing the proficiency test (% Passing), daily mean of the percentage of students
attending class (% Attendance), mean teacher salary in dollars (Salaries), and
instructional spending per pupil in dollars (Spending) of 47 schools in the state.
Following is the multiple regression output with Y = % Passing as the dependent
variable, X1 = % Attendance, X2 = Salaries and X3 = Spending:
Referring to Table 17-8, you can conclude that the mean teacher salary has no impact
on the mean percentage of students passing the proficiency test at a 5% level of
significance using the 95% confidence interval estimate for β2.

True or False: Referring to Table 14-16, the 0 to 60 miles per hour acceleration time of
a sedan is predicted to be 0.0005 seconds higher than that of a non-sedan with the same
engine size.
How many tissues should the Kimberly Clark Corporation package of Kleenex contain?
Researchers determined that 60 tissues is the mean number of tissues used during a
cold. Suppose a random sample of 100 Kleenex users yielded the following data on the
number of tissues used during a cold: = 52,
S = 22. Suppose the alternative you wanted to test was H1 : < 60. State the correct
rejection region for = 0.05.
A) Reject H0 if t > 1.6604.
B) Reject H0 if t < -1.6604.
C) Reject H0 if t > 1.9842 or Z < -1.9842.
D) Reject H0 if t < -1.9842.
Suppose the probability of a car accident taking place anywhere on a 20-mile stretch of
highway is the same. Which of the following distributions would you use to determine
the probability that a car accident will occur somewhere between the 5-mile and
15-mile posts of the highway?
A) Normal distribution

B) Poisson distribution
C) Uniform distribution
D) Exponential distribution
The fairly regular fluctuations that occur within each year would be contained in the
________ component.
A) trend
B) cyclical
C) irregular
D) seasonal
TABLE 18-1
A local newspaper has 10 delivery boys who each deliver the morning paper to 50
customers every day. The owner decides to record the number of papers delivered on
time for a 10-day period for one of the delivery boys and construct a p chart to see
whether the percentage is too erratic.

Referring to Table 18-1, what is the numerical value of the center line for the p chart?
A) 0.926
B) 0.911
C) 0.885
D) 0.500
If the outcomes of a variable follow a Poisson distribution, then their
A) mean equals the standard deviation.
B) median equals the standard deviation.
C) mean equals the variance.
D) median equals the variance.
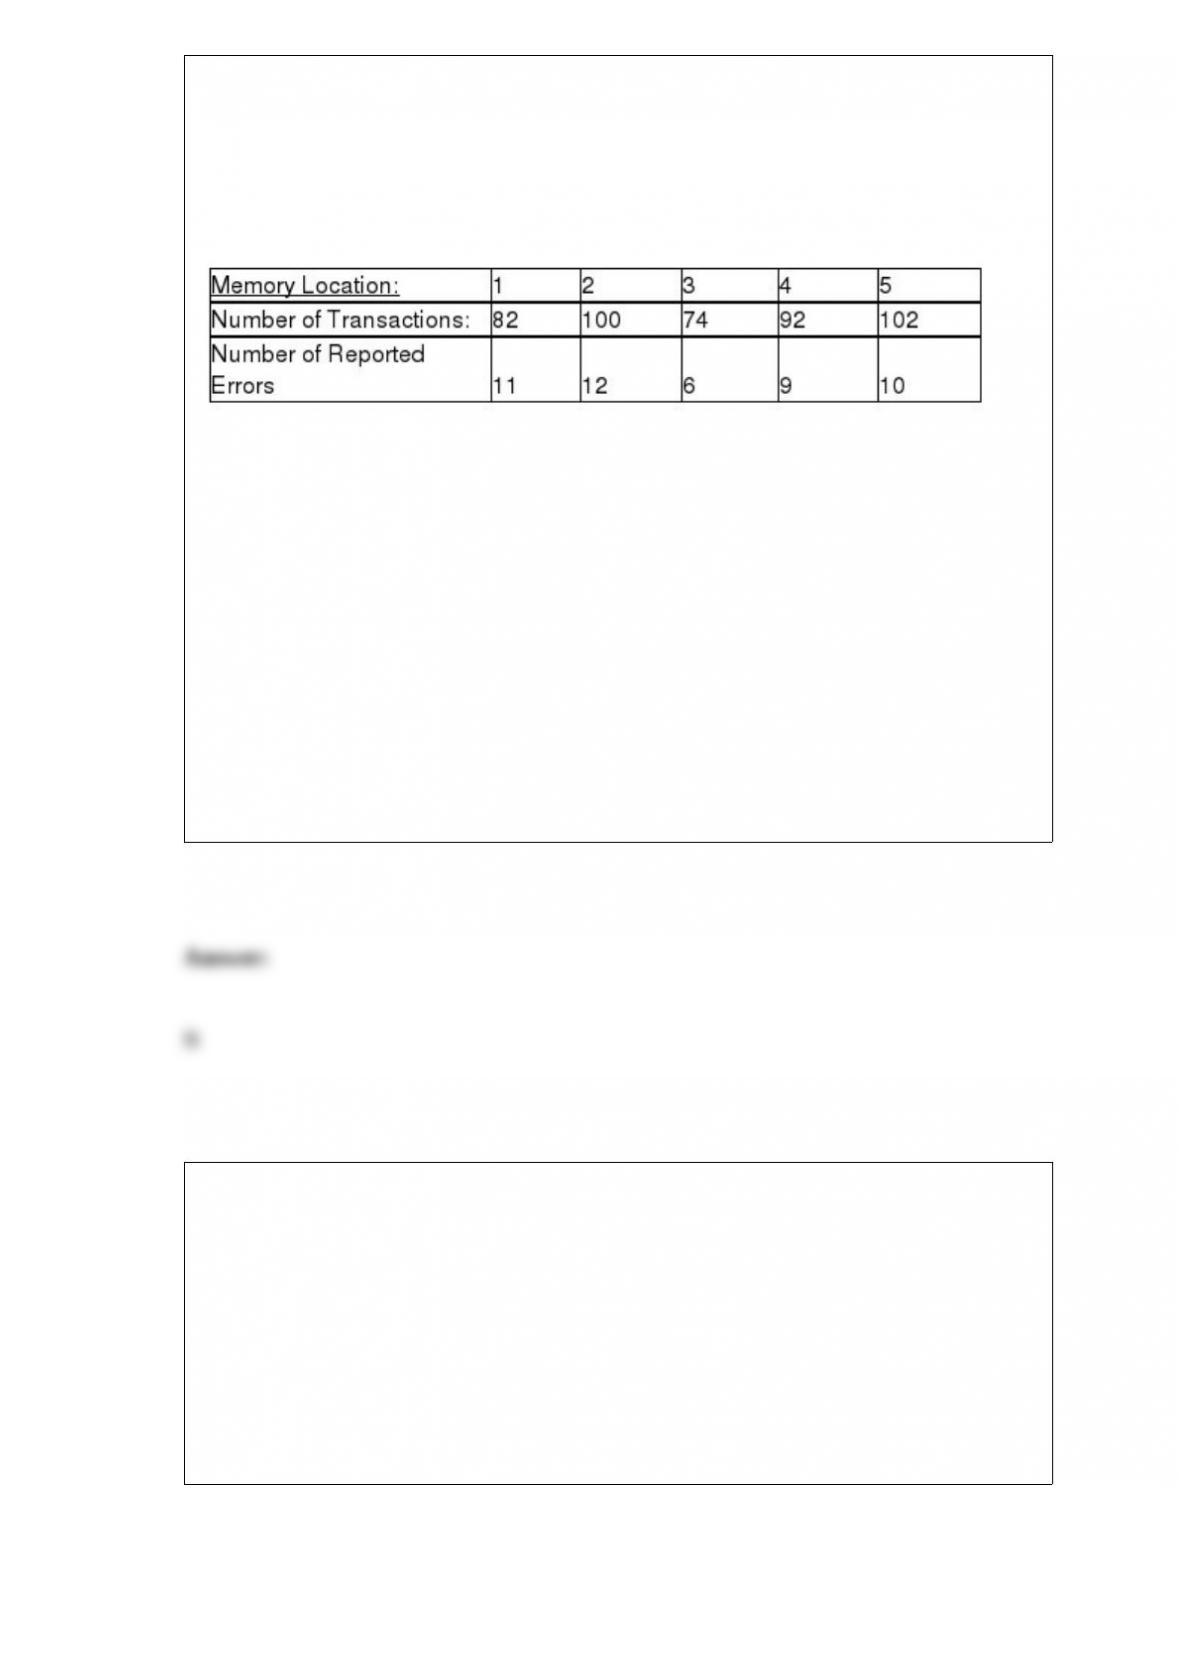
TABLE 12-4
A computer used by a 24-hour banking service is supposed to randomly assign each
transaction to one of 5 memory locations. A check at the end of a day’s transactions
gave the counts shown in the table to each of the 5 memory locations, along with the
number of reported errors.
The bank manager wanted to test whether the proportion of errors in transactions
assigned to each of the 5 memory locations differ.
Referring to Table 12-4, the critical value of the test statistic at 1% level of significance
is
A) 7.7794.
B) 13.2767.
C) 20.0902.
D) 23.2093.
For sample sizes greater than 30, the sampling distribution of the mean will be
approximately normally distributed
A) regardless of the shape of the population.
B) only if the shape of the population is symmetrical.
C) only if the standard deviation of the samples are known.
D) only if the population is normally distributed.
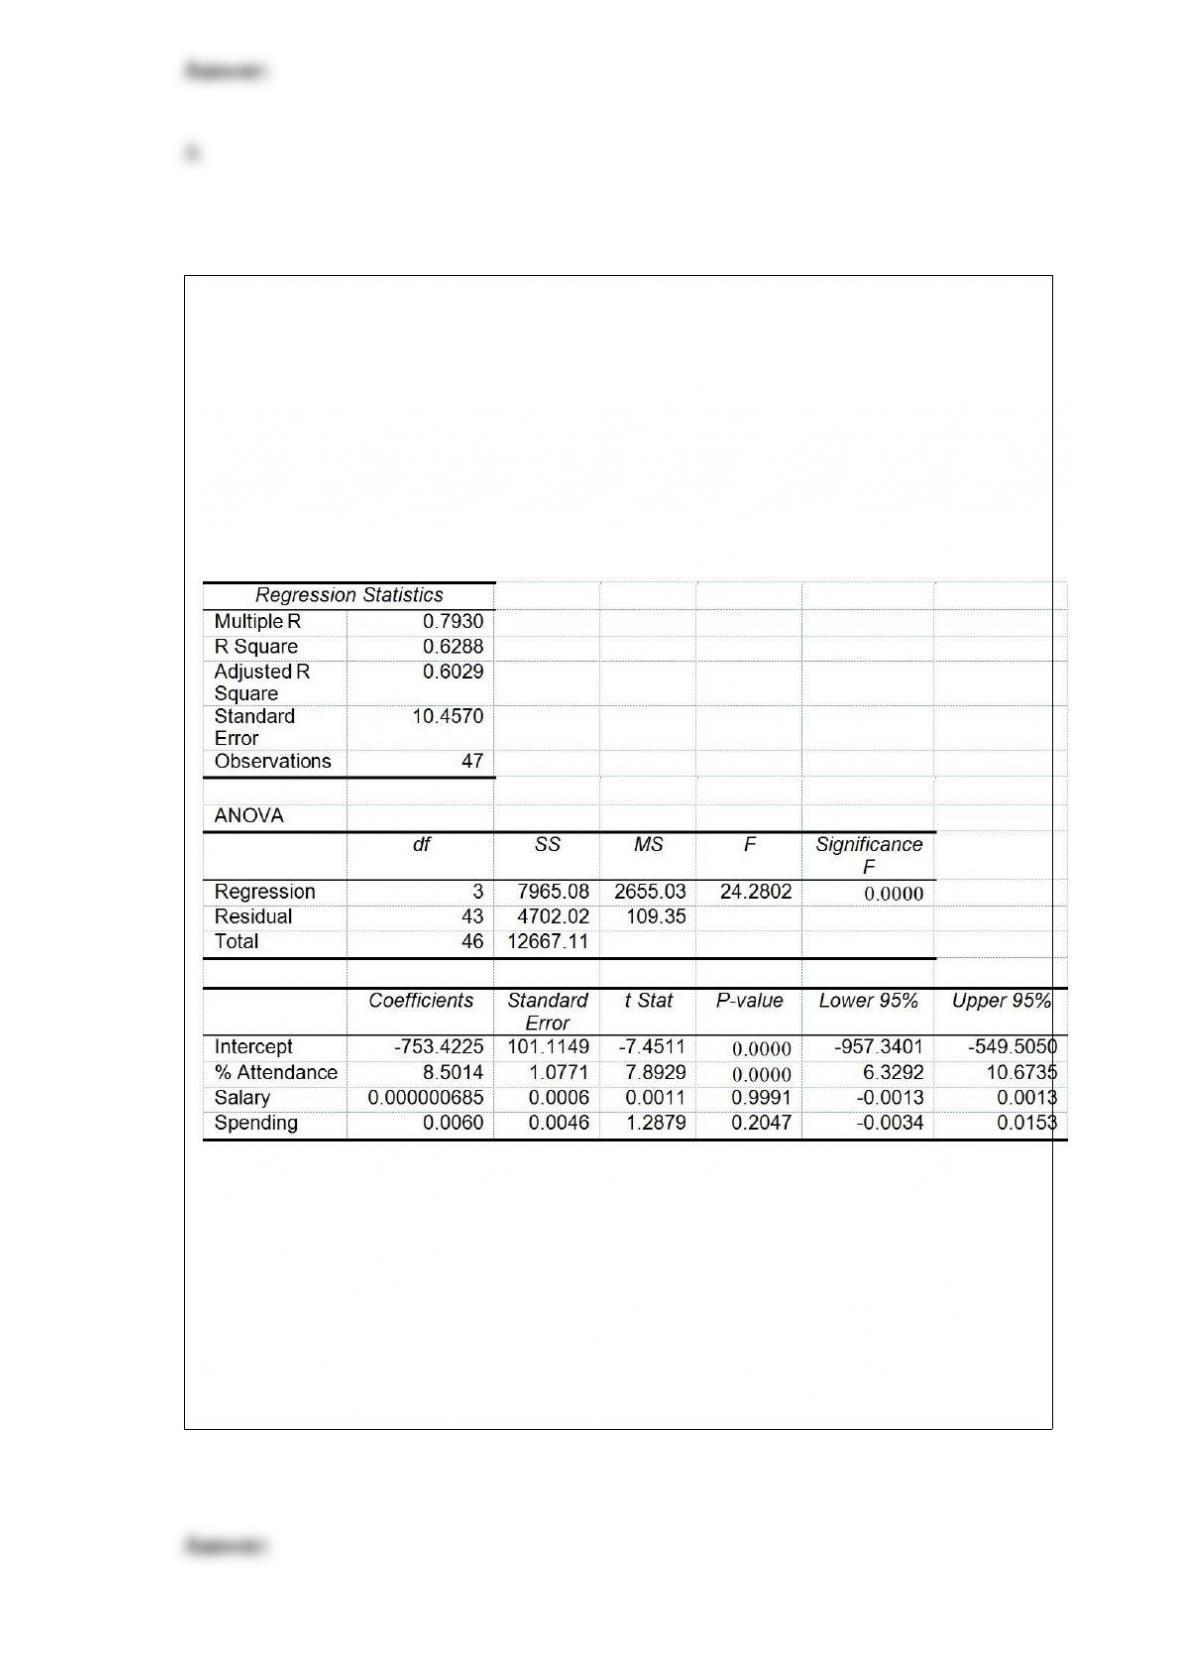
TABLE 17-8
The superintendent of a school district wanted to predict the percentage of students
passing a sixth-grade proficiency test. She obtained the data on percentage of students
passing the proficiency test (% Passing), daily mean of the percentage of students
attending class (% Attendance), mean teacher salary in dollars (Salaries), and
instructional spending per pupil in dollars (Spending) of 47 schools in the state.
Following is the multiple regression output with Y = % Passing as the dependent
variable, X1 = % Attendance, X2 = Salaries and X3 = Spending:
Referring to Table 17-8, which of the following is the correct alternative hypothesis to
test whether instructional spending per pupil has any effect on the percentage of
students passing the proficiency test, taking into account the effect of all the other
independent variables?
A) H1 : β0 ≠0
B) H1 : β1 ≠0
C) H1 : β2 ≠0
D) H1 : β3 ≠0

Referring to Table 14-11, which of the following statements is
supported by the analysis shown?
TABLE 14-11
A weight-loss clinic wants to use regression analysis to build a model
for weight loss of a client (measured in pounds). Two variables
thought to affect weight loss are client’s length of time on the
weight-loss program and time of session. These variables are
described below:
Y = Weight loss (in pounds)
X1 = Length of time in weight-loss program (in months)
X2 = 1 if morning session, 0 if not
Data for 25 clients on a weight-loss program at the clinic were
collected and used to .t the interaction model:
Y = β0 + β1X1 + β2X2 + β3X1X2 + ε
Output from Microsoft Excel follows:
A) There is suffcient evidence (at α = 0.05) of curvature in the
relationship between weight loss (Y) and months on program (X1).
B) There is suffcient evidence (at α = 0.05) to indicate that the
relationship between weight loss (Y) and months on program (X1)
varies with session time.
C) There is insuffcient evidence (at α = 0.05) of curvature in the
relationship between weight loss (Y) and months on program (X1).
D) There is insuffcient evidence (at α = 0.05) to indicate that the
relationship between weight loss (Y) and months on program (X1)
varies with session time.
TABLE 17-2
One of the most common questions of prospective house buyers pertains to the cost of
heating in dollars (Y). To provide its customers with information on that matter, a large
real estate firm used the following 4 variables to predict heating costs: the daily
minimum outside temperature in degrees of Fahrenheit (X1), the amount of insulation in
inches (X2), the number of windows in the house (X3), and the age of the furnace in
years (X4). Given below are the EXCEL outputs of two regression models.
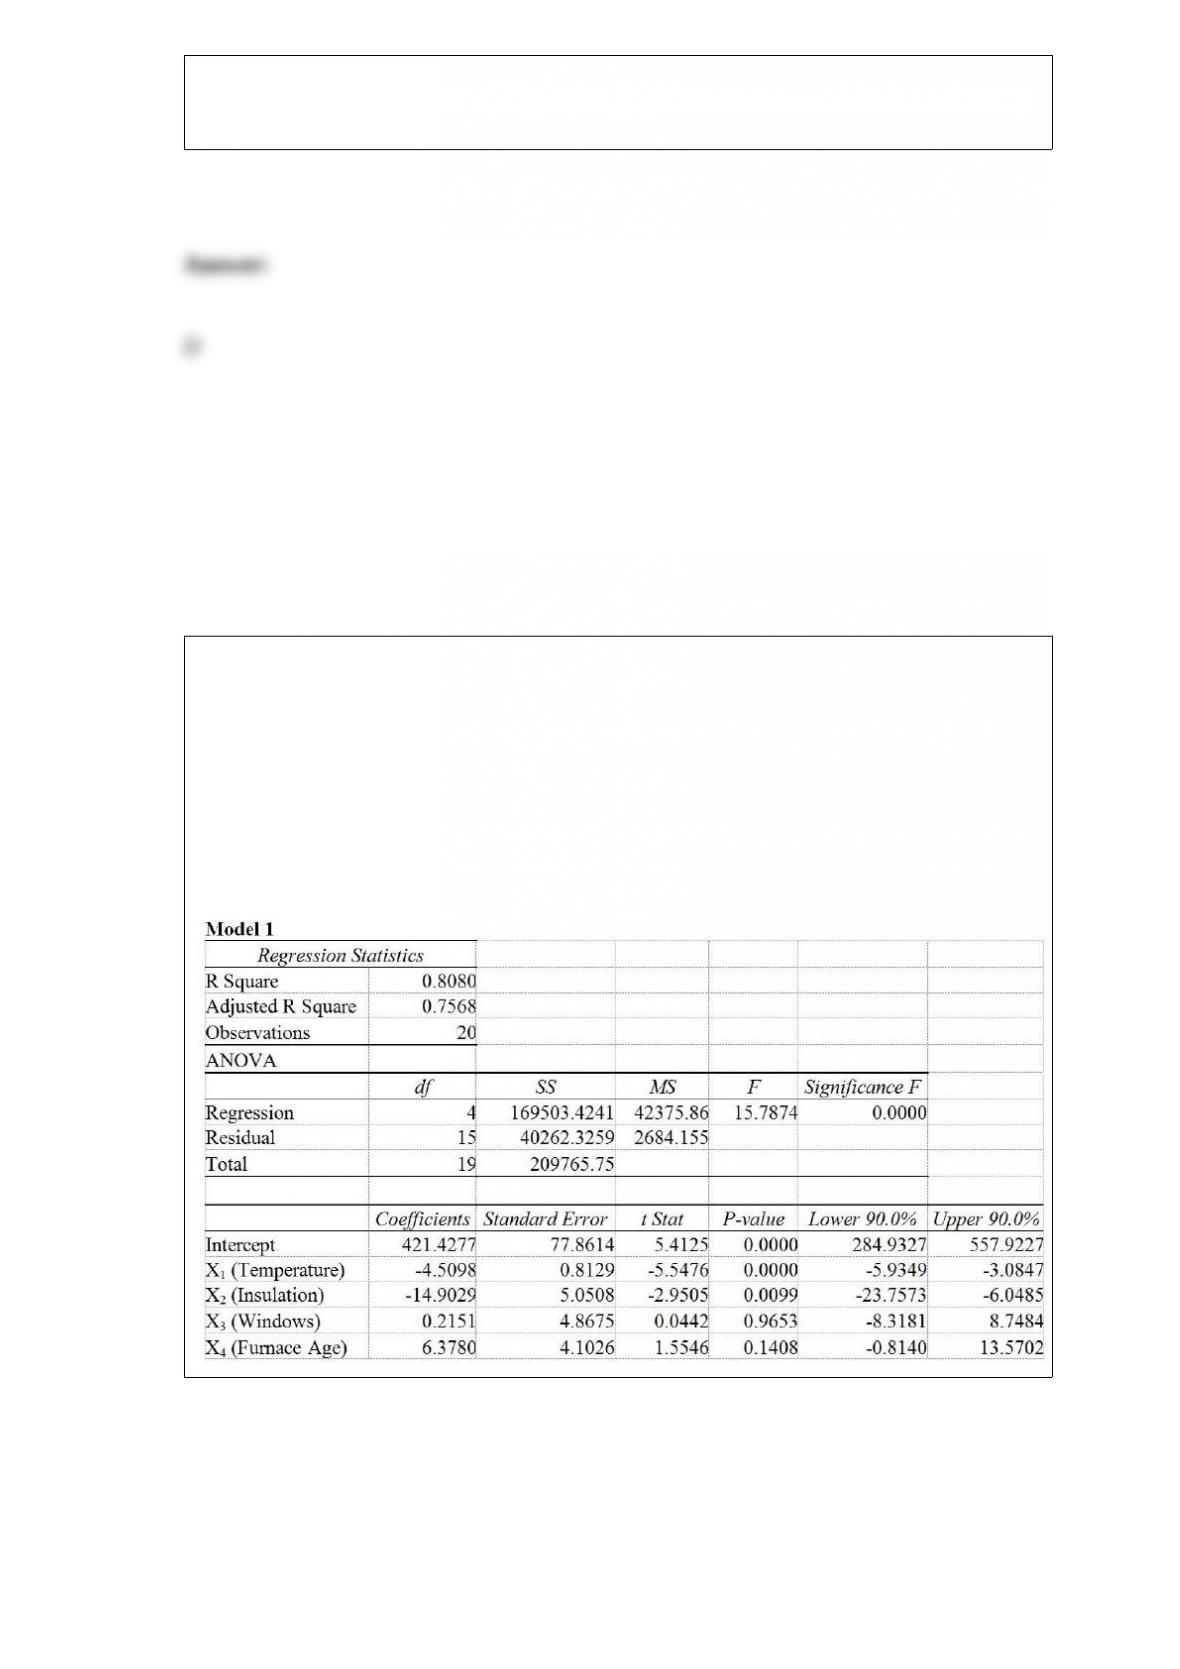
Referring to Table 17-2, what is the 90% confidence interval for the expected change in
heating costs as a result of a 1 degree Fahrenheit change in the daily minimum outside
temperature using Model 1?
A) [-6.58, -3.65]
B) [-6.24, -2.78]
C) [-5.94, -3.08]
D) [-2.37, 15.12]
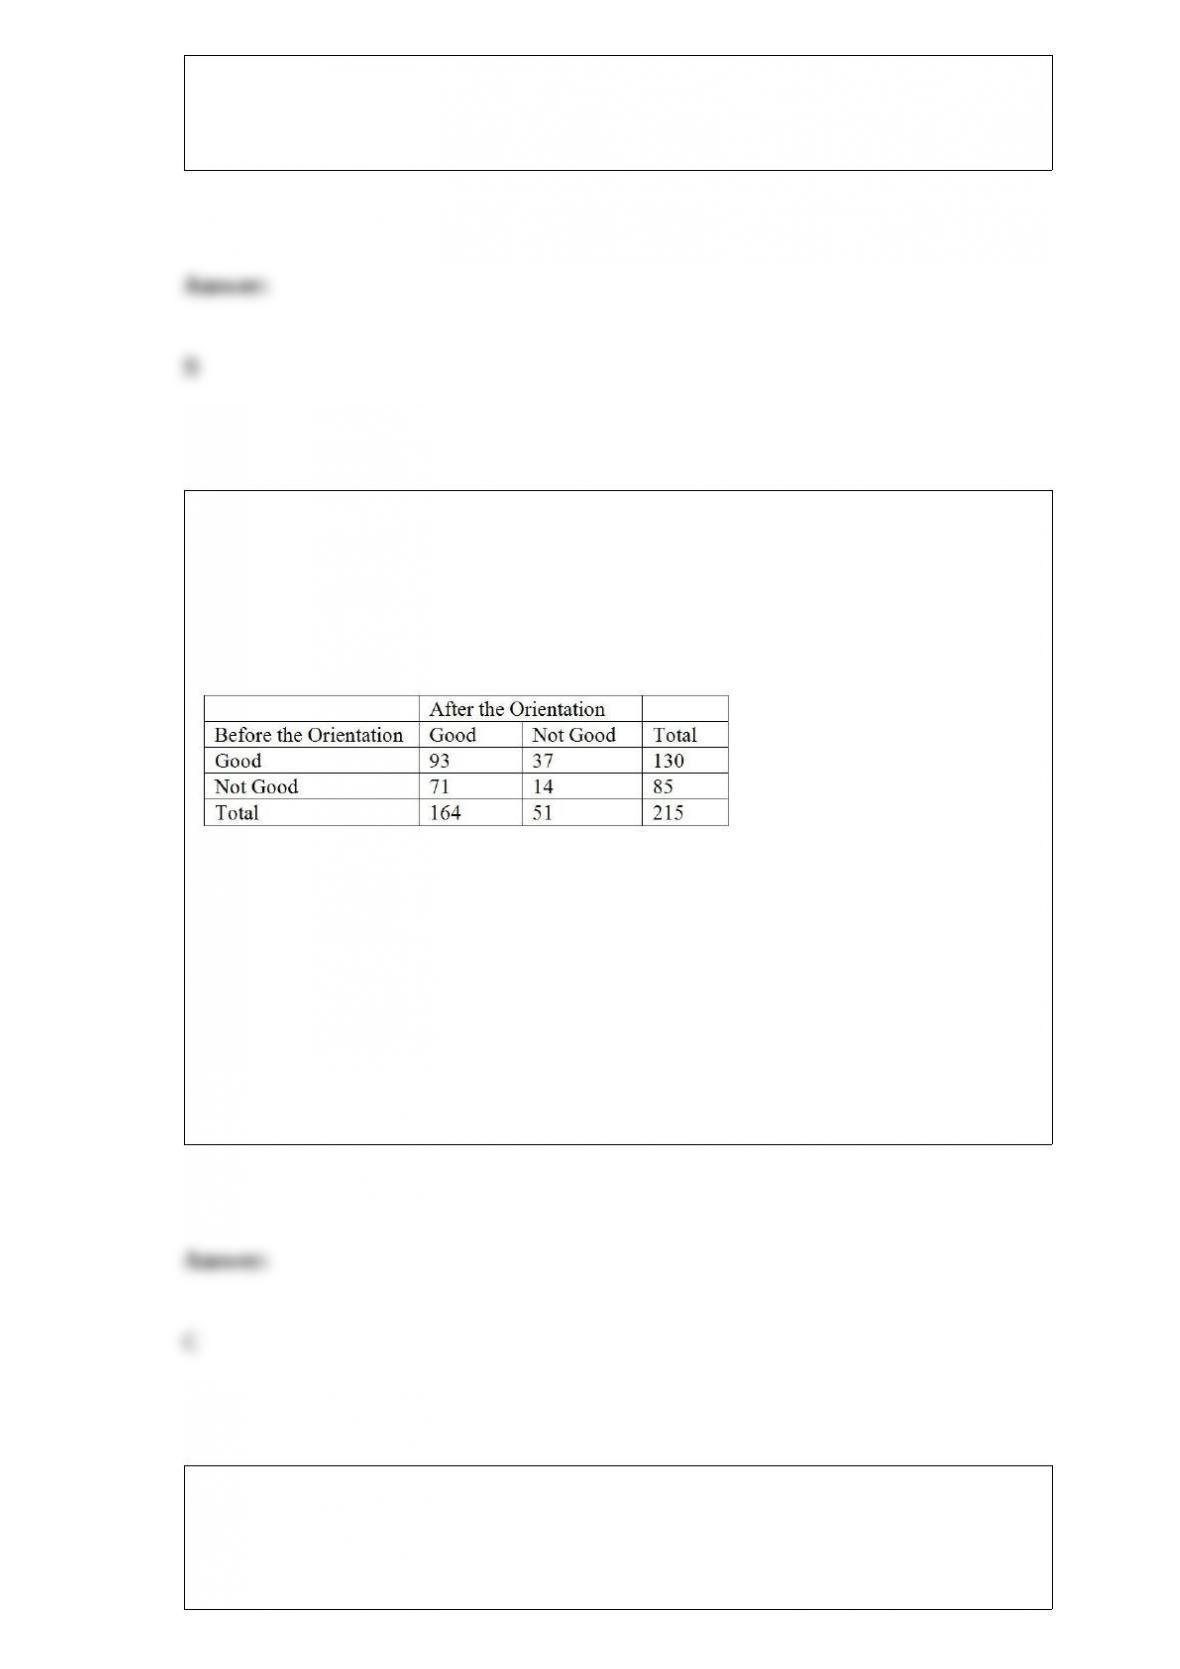
TABLE 2-6
A sample of 200 students at a Big-Ten university was taken after the midterm to ask
them whether they went bar hopping the weekend before the midterm or spent the
weekend studying, and whether they did well or poorly on the midterm. The following
table contains the result.
Referring to Table 2-6, if the sample is a good representation of the population, we can
expect ________ percent of those who spent the weekend studying to do poorly on the
midterm.
A) 10
B) 20
C) 45
D) 50
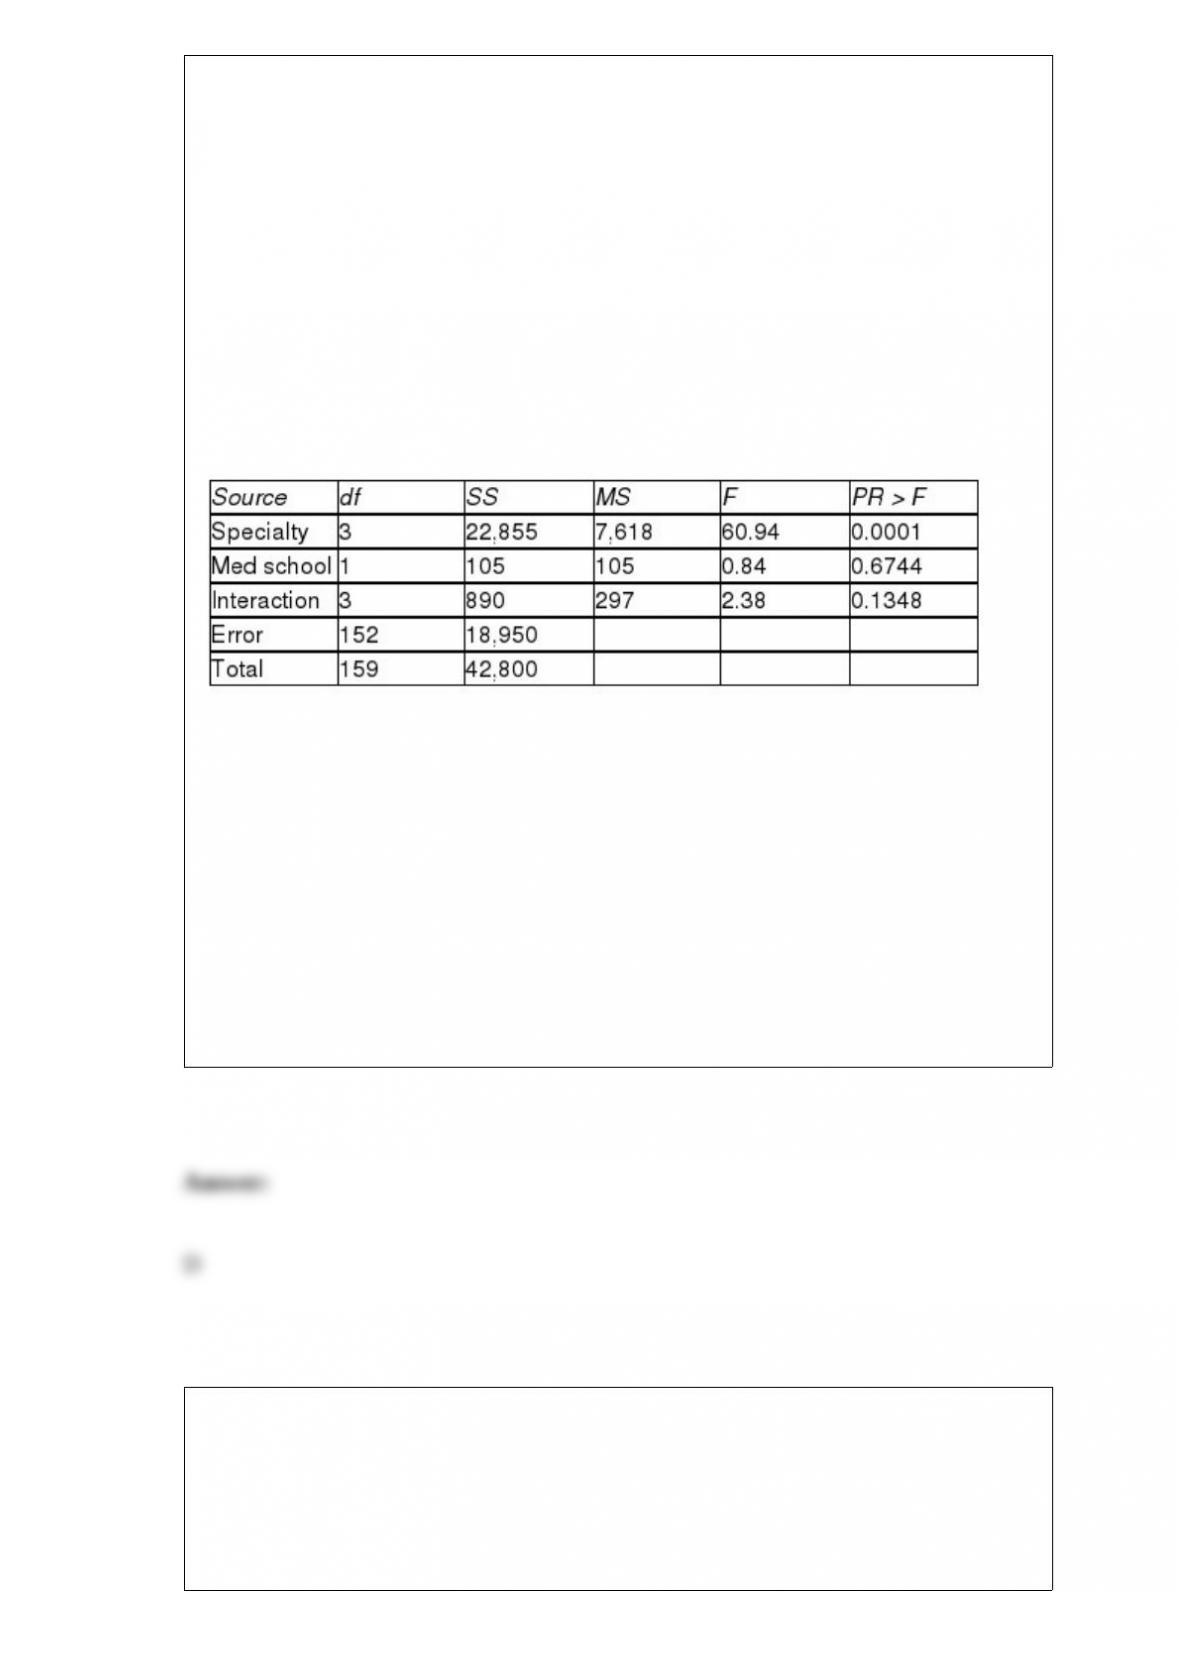
TABLE 12-19
The director of the MBA program of a state university wanted to know if a one-week
orientation would change the proportion among potential incoming students who would
perceive the program as being good. Given below is the result from 215 students’ view
of the program before and after the orientation.
Referring to Table 12-19, which test should she use?
A) X2 test for difference in proportions
B) Z test for difference in proportions
C) McNemar test for difference in proportions
D) Wilcoxon rank sum test
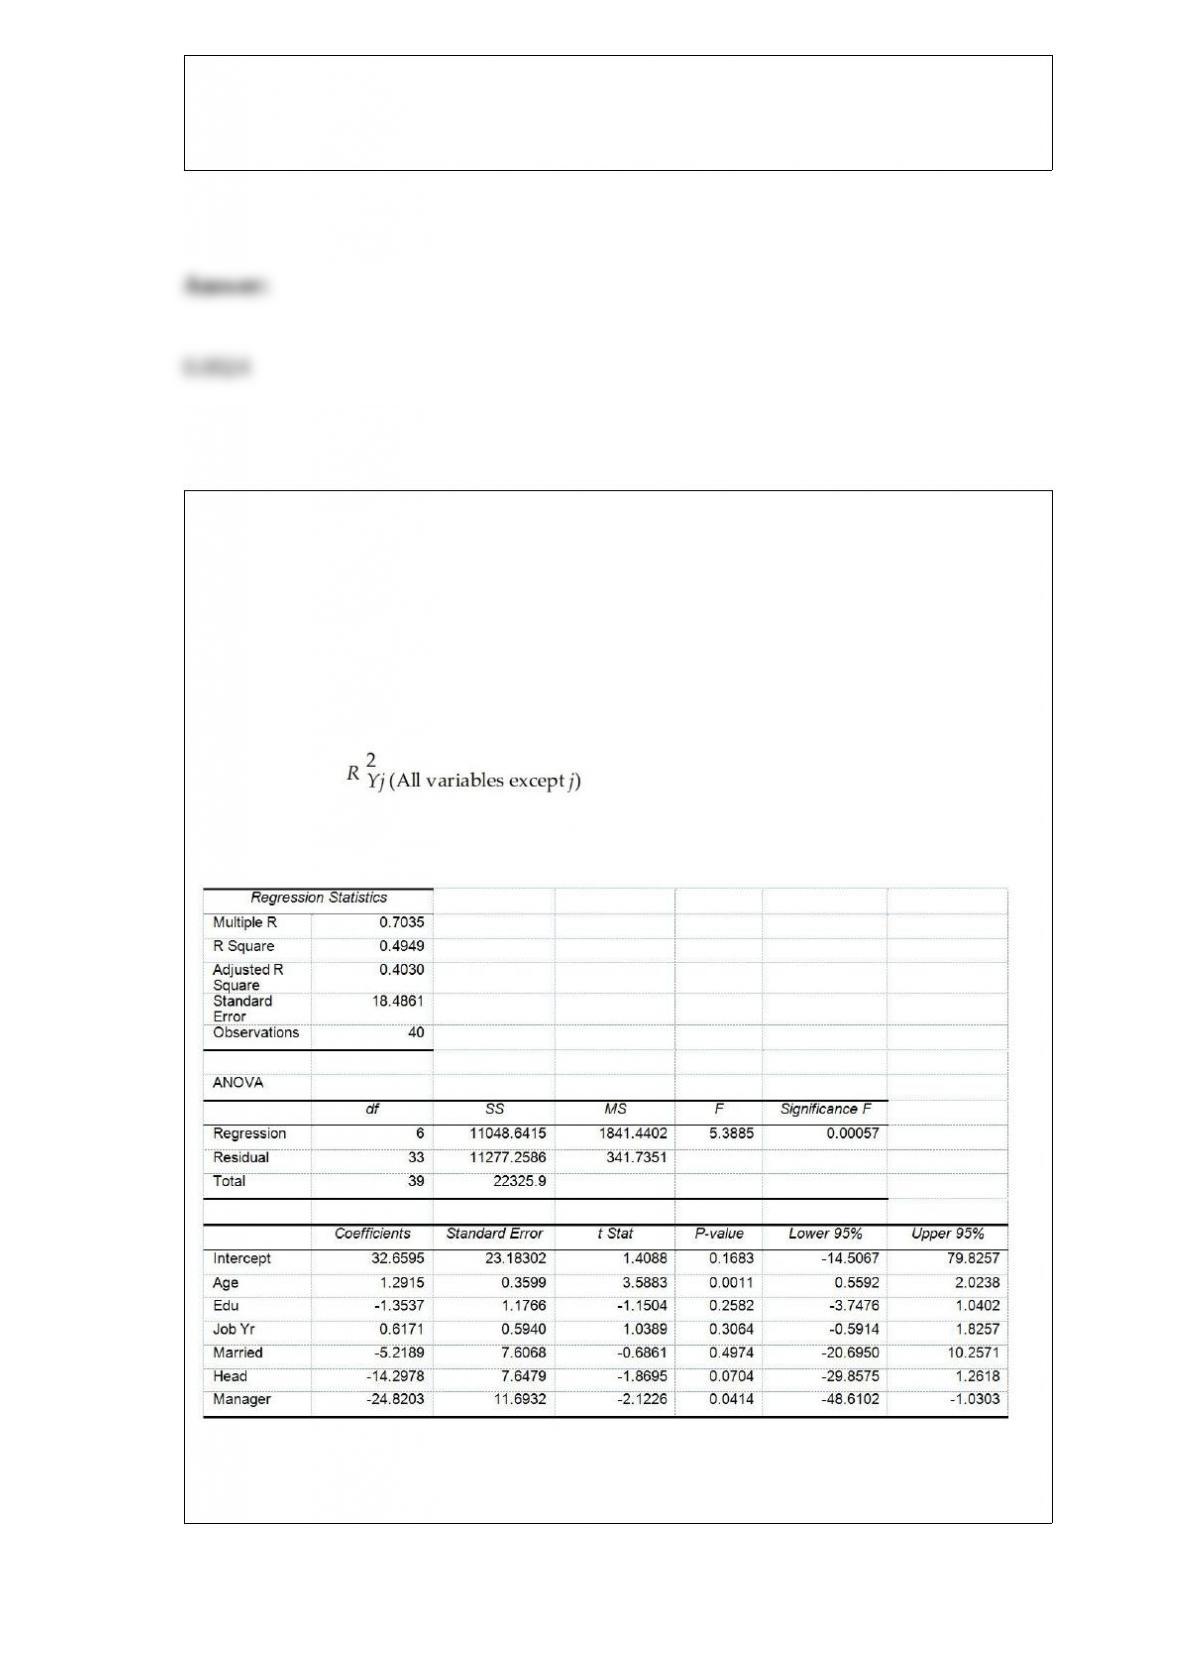
TABLE 11-8
A physician and president of a Tampa Health Maintenance Organization (HMO) are
attempting to show the benefits of managed health care to an insurance company. The
physician believes that certain types of doctors are more cost-effective than others. One
theory is that Primary Specialty is an important factor in measuring the
cost-effectiveness of physicians. To investigate this, the president obtained independent
random samples of 20 HMO physicians from each of 4 primary specialties – General
Practice (GP), Internal Medicine (IM), Pediatrics (PED), and Family Physicians (FP) –
and recorded the total charges per member per month for each. A second factor which
the president believes influences total charges per member per month is whether the
doctor is a foreign or USA medical school graduate. The president theorizes that foreign
graduates will have higher mean charges than USA graduates. To investigate this, the
president also collected data on 20 foreign medical school graduates in each of the 4
primary specialty types described above. So information on charges for 40 doctors (20
foreign and 20 USA medical school graduates) was obtained for each of the 4
specialties. The results for the ANOVA are summarized in the following table.
Referring to Table 11-8, what degrees of freedom should be used to determine the
critical value of the F ratio against which to test for differences in the mean charges for
doctors among the four primary specialty areas?
A) numerator df = 1, denominator df = 159
B) numerator df = 3, denominator df = 159
C) numerator df = 1, denominator df = 152
D) numerator df = 3, denominator df = 152
TABLE 6-7
A company has 125 personal computers. The probability that any one of them will
require repair on a given day is 0.15.
Referring to Table 6-7 and assuming that the number of computers that requires repair
on a given day follows a binomial distribution, compute the probability that there will
be less than 8 computers that require repair on a given day using a normal
approximation.
TABLE 17-10
Given below are results from the regression analysis where the dependent variable is
the number of weeks a worker is unemployed due to a layoff (Unemploy) and the
independent variables are the age of the worker (Age), the number of years of education
received (Edu), the number of years at the previous job (Job Yr), a dummy variable for
marital status (Married: 1 = married, 0 = otherwise), a dummy variable for head of
household (Head: 1 = yes, 0 = no) and a dummy variable for management position
(Manager: 1 = yes, 0 = no). We shall call this Model 1. The coefficient of partial
determination ( ) of each of the 6 predictors are, respectively,
0.2807, 0.0386, 0.0317, 0.0141, 0.0958, and 0.1201.
Model 2 is the regression analysis where the dependent variable is Unemploy and the
independent variables are Age and Manager. The results of the regression analysis are
given below:
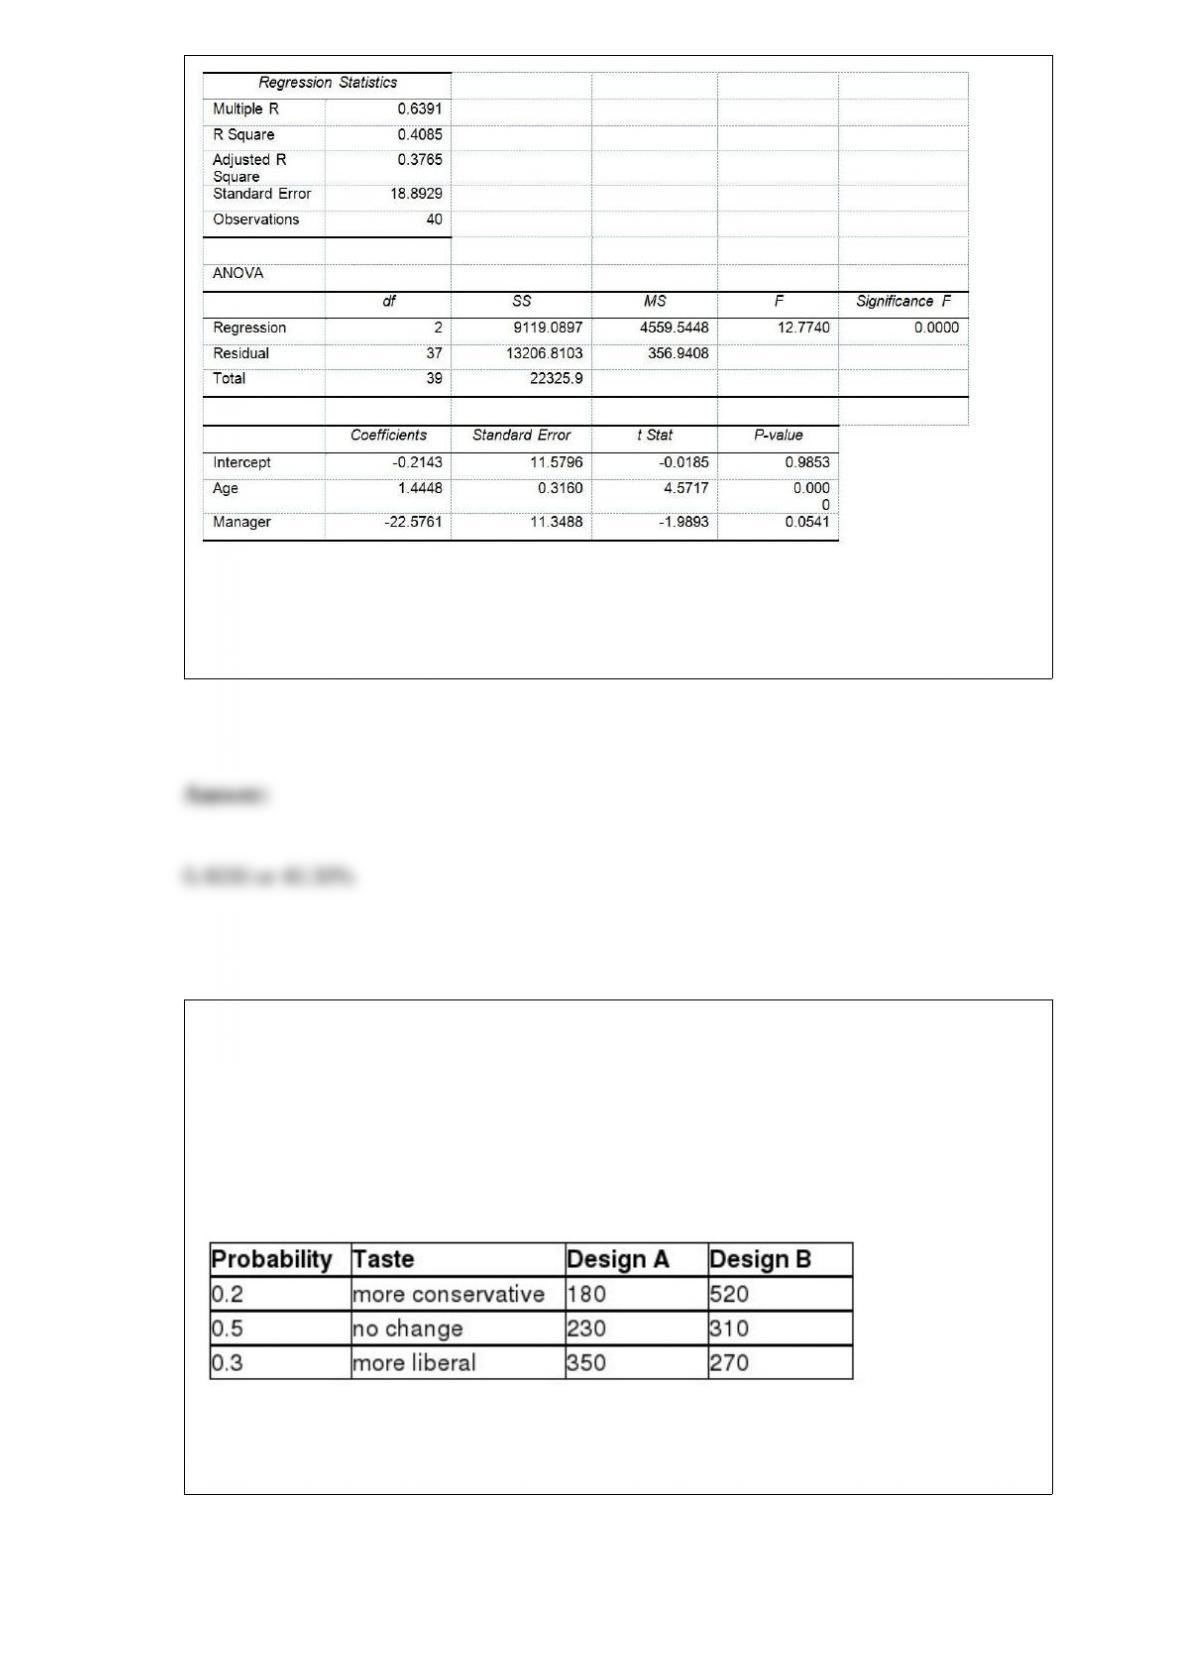
Referring to Table 17-10, Model 1, ________ of the variation in the number of weeks a
worker is unemployed due to a layoff can be explained by the six independent variables
after taking into consideration the number of independent variables and the number of
observations.
TABLE 5-8
Two different designs on a new line of winter jackets for the coming winter are
available for your manufacturing plants. Your profit (in thousands of dollars) will
depend on the taste of the consumers when winter arrives. The probability of the three
possible different tastes of the consumers and the corresponding profits are presented in
the following table.
Referring to Table 5-8, if you decide to choose Design A for half of the production lines
and Design B for the other half, what is the coefficient of variation of your investment?
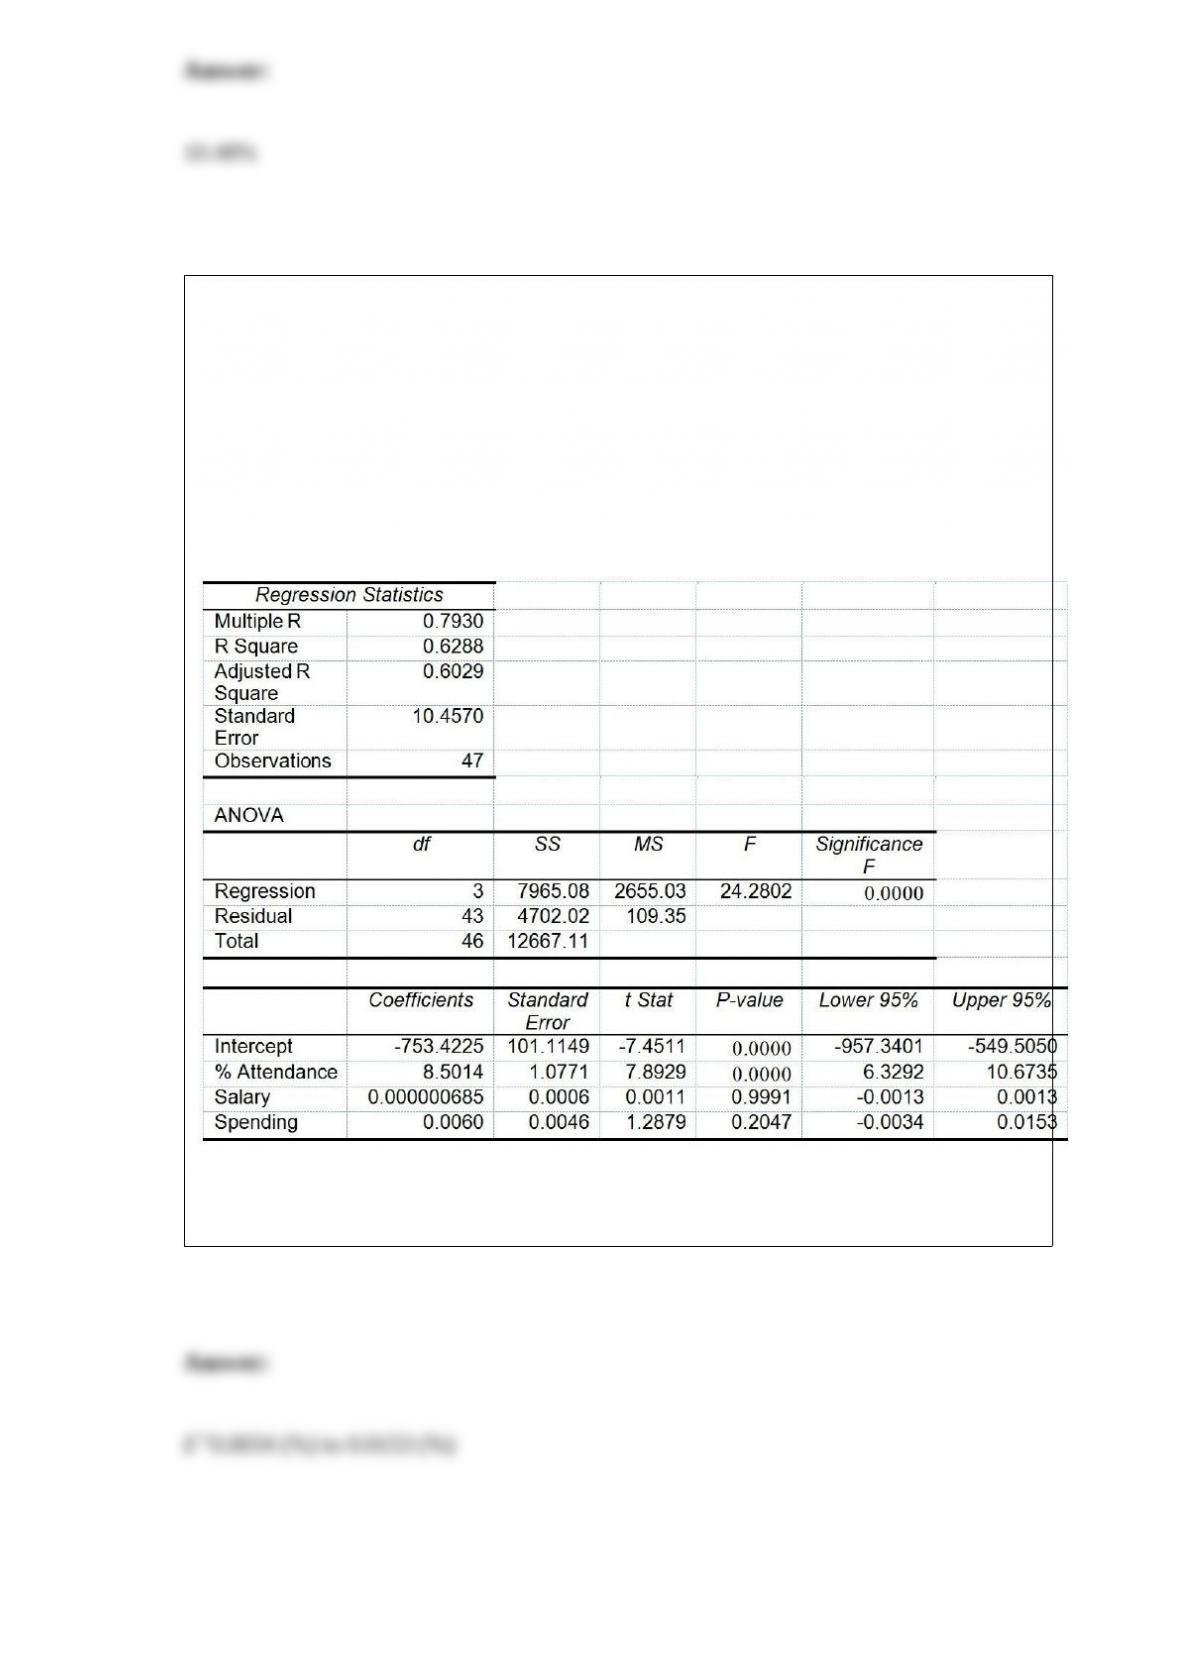
TABLE 17-8
The superintendent of a school district wanted to predict the percentage of students
passing a sixth-grade proficiency test. She obtained the data on percentage of students
passing the proficiency test (% Passing), daily mean of the percentage of students
attending class (% Attendance), mean teacher salary in dollars (Salaries), and
instructional spending per pupil in dollars (Spending) of 47 schools in the state.
Following is the multiple regression output with Y = % Passing as the dependent
variable, X1 = % Attendance, X2 = Salaries and X3 = Spending:
Referring to Table 17-8, what are the lower and upper limits of the 95% confidence
interval estimate for the effect of a one dollar increase in instructional spending per
pupil on the mean percentage of students passing the proficiency test?
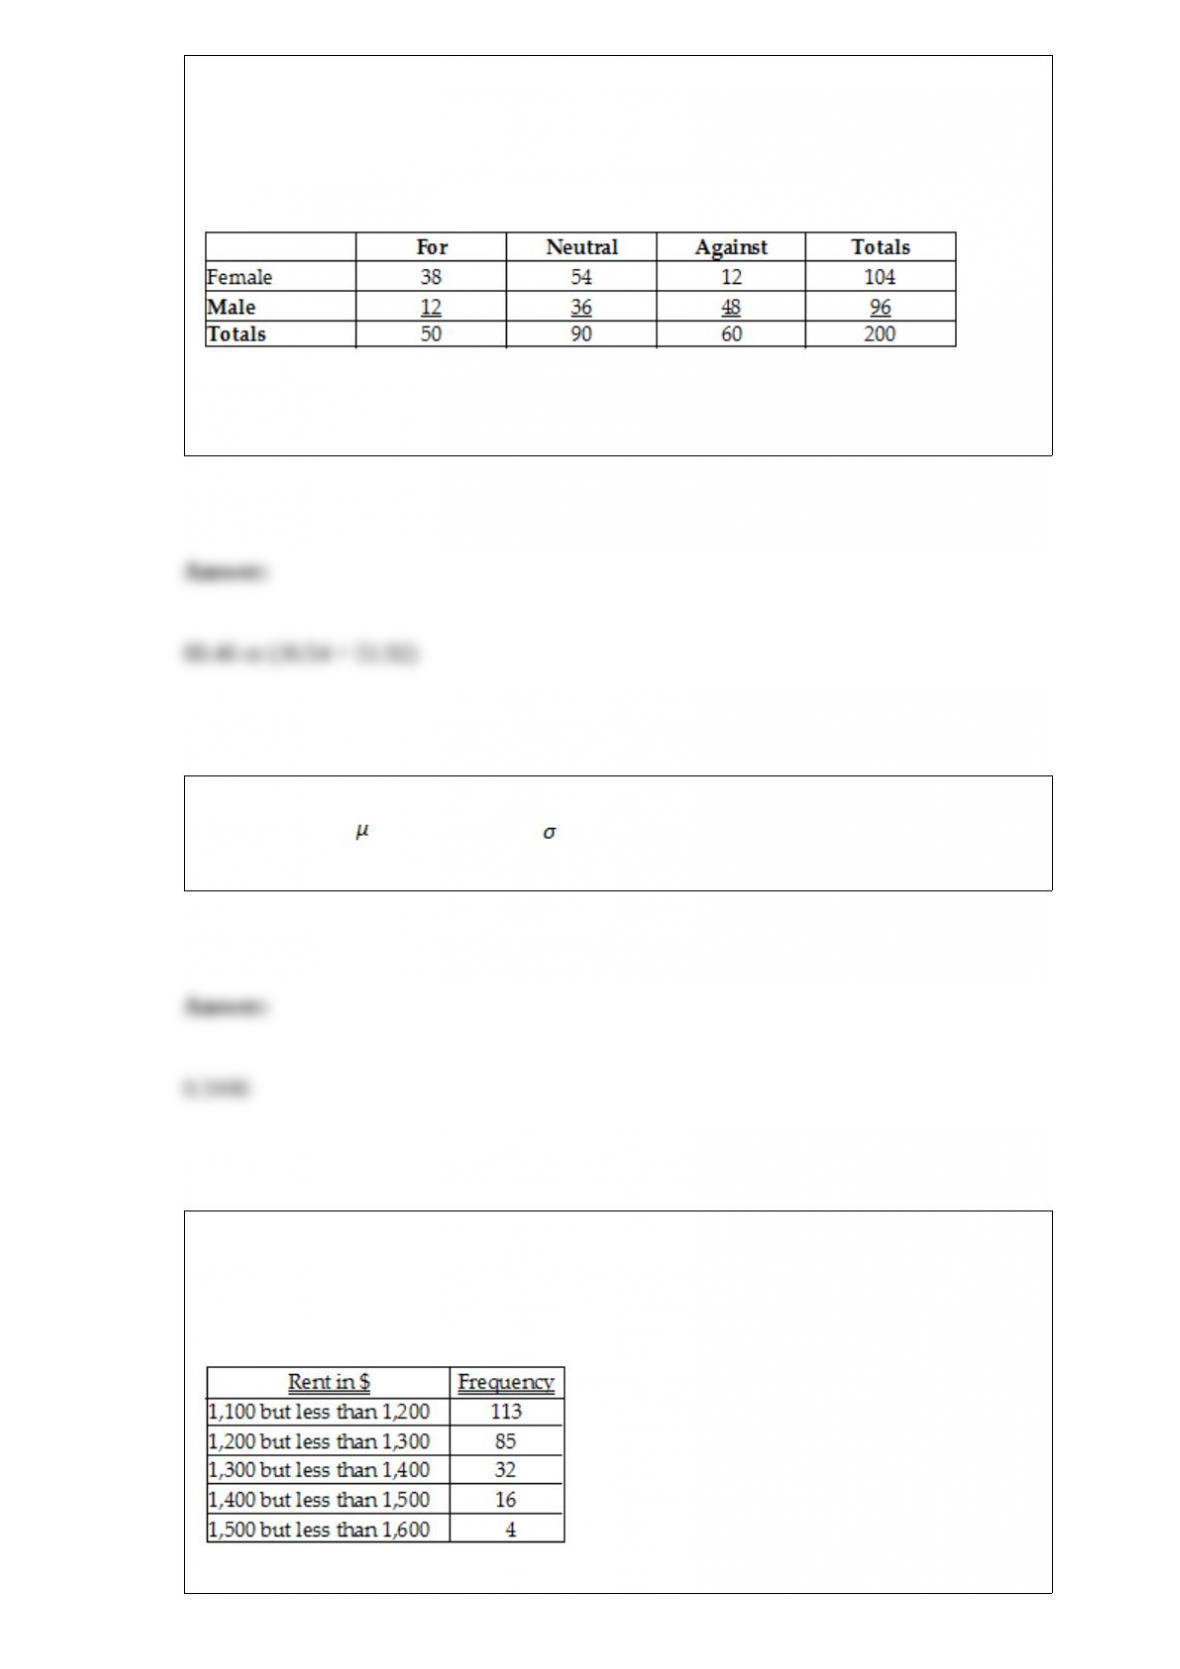
TABLE 2-12
The table below contains the opinions of a sample of 200 people broken down by
gender about the latest congressional plan to eliminate anti-trust exemptions for
professional baseball.
Referring to Table 2-12, if the sample is a good representation of the population, we can
expect ________ percent of the females in the population will not be against the plan.
The amount of tea leaves in a can from a particular production line is normally
distributed with = 110 grams and = 25 grams. What is the probability that a
randomly selected can will contain less than 100 grams of tea leaves?
TABLE 2-9
The frequency distribution below represents the rents of 250 randomly selected
federally subsidized apartments in a small town.

Referring to Table 2-9, the class midpoint of the second class is ________.