
TABLE 6-2
John has two jobs. For daytime work at a jewelry store he is paid $15,000 per month,
plus a commission. His monthly commission is normally distributed with a mean of
$10,000 and a standard deviation of $2,000. At night he works occasionally as a waiter,
for which his monthly income is normally distributed with a mean of $1,000 and a
standard deviation of $300. John’s income levels from these two sources are
independent of each other.
Referring to Table 6-2, John’s income as a waiter will be between what two values
symmetrically distributed around the population mean 80% of the time?
TABLE 4-8
According to the record of the registrar’s office at a state university, 35% of the students
are freshman, 25% are sophomore, 16% are junior and the rest are senior. Among the
freshmen, sophomores, juniors and seniors, the portion of students who live in the
dormitory are, respectively, 80%, 60%, 30% and 20%.
Referring to Table 4-8, what is the probability that a randomly selected student is a
junior or senior who lives in a dormitory?
TABLE 13-5
The managing partner of an advertising agency believes that his company’s sales are
related to the industry sales. He uses Microsoft Excel to analyze the last 4 years of
quarterly data (i.e., n = 16) with the following results:
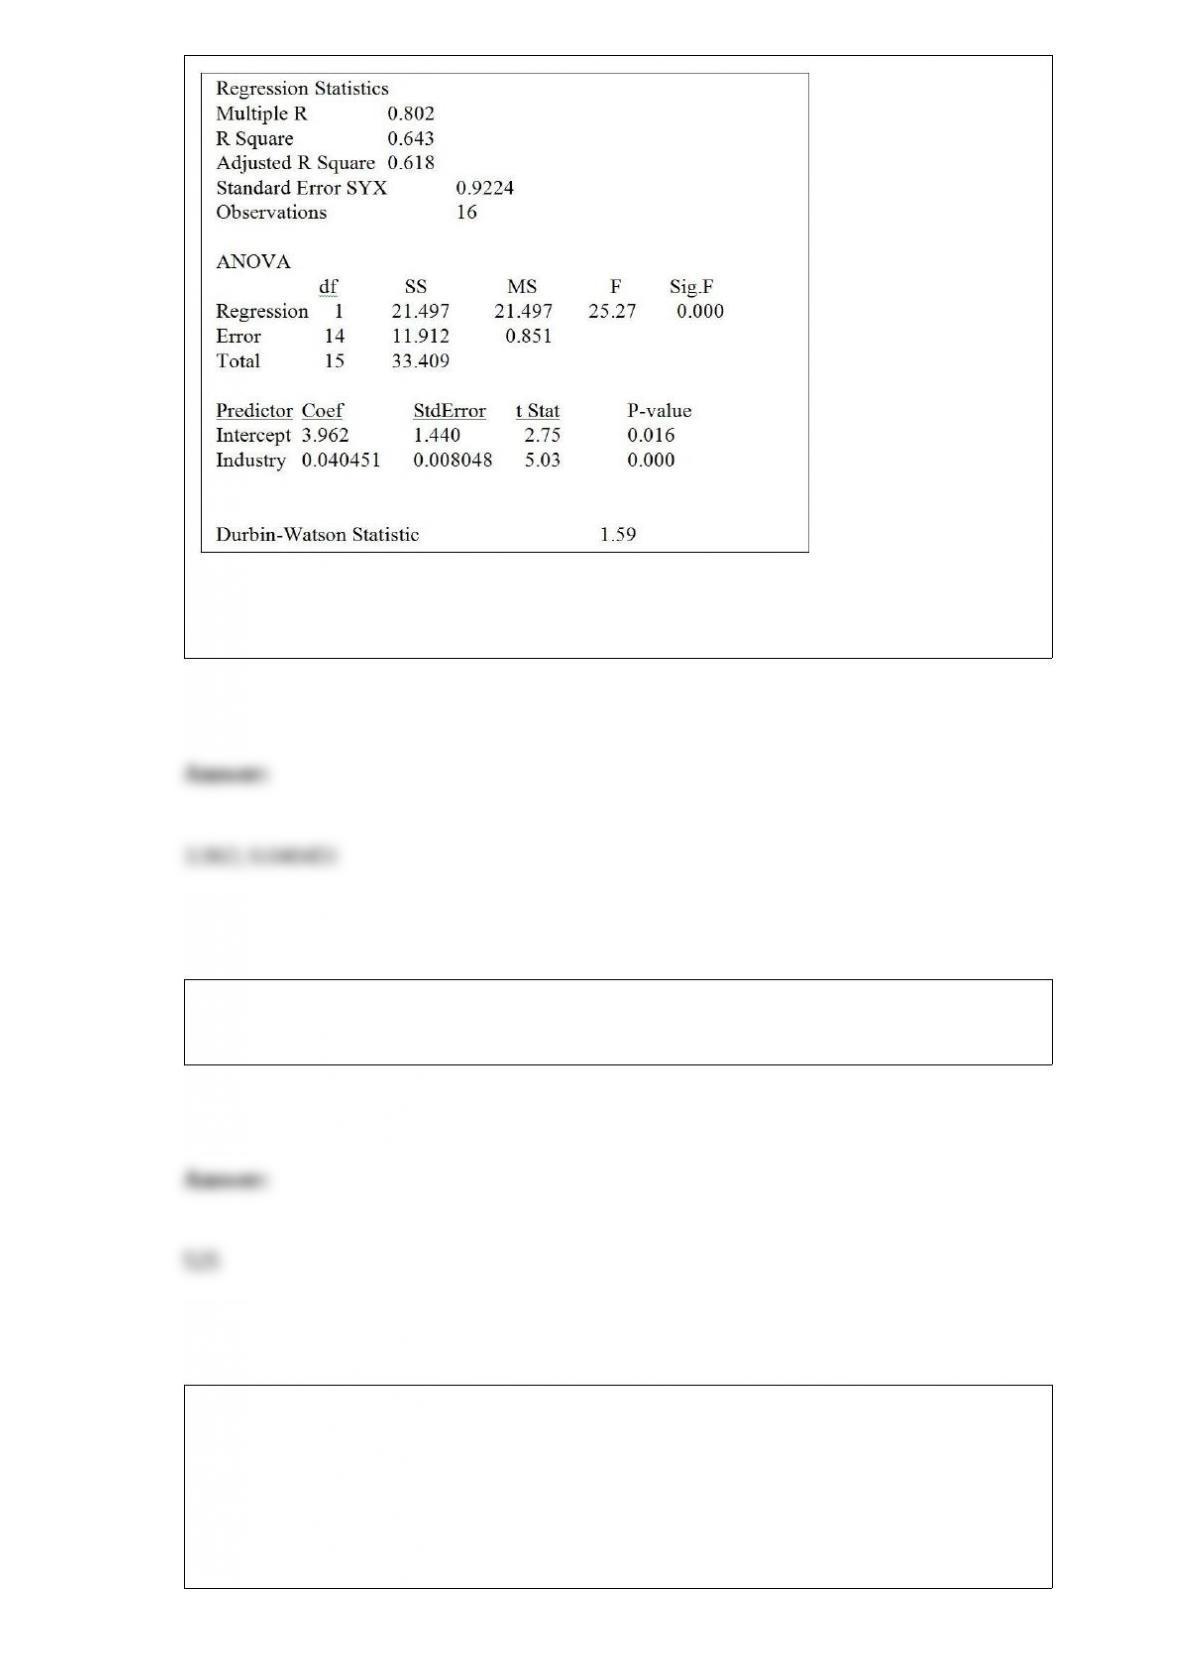
Referring to Table 13-5, the estimates of the Y-intercept and slope are ________ and
________, respectively.
An exploration team of 2 women and 3 men is to be chosen from a candidate pool of 6
women and 7 men. How many different ways can this team of 5 be formed?
TABLE 12-16
As part of an evaluation program, a sporting goods retailer wanted to compare the
downhill coasting speeds of 4 brands of bicycles. She took 3 of each brand and
determined their maximum downhill speeds. The results are presented in miles per hour
in the table below.
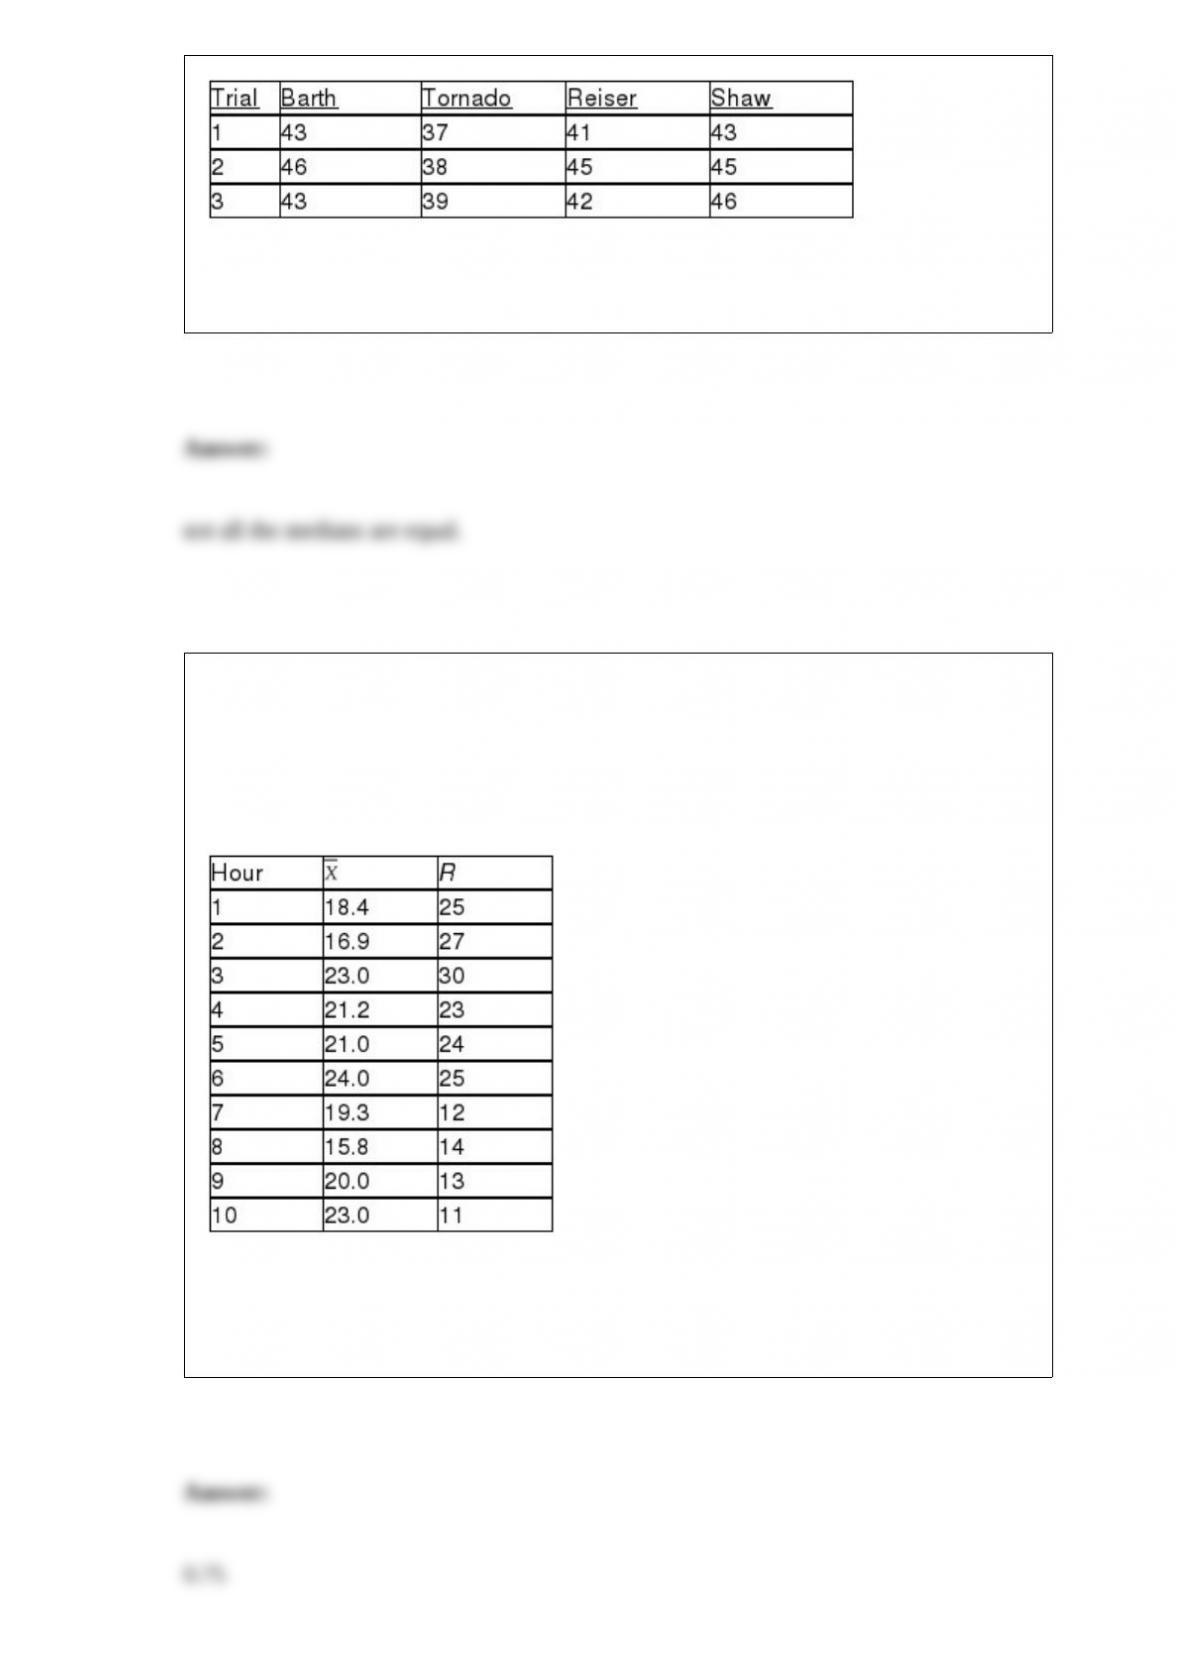
Referring to Table 12-16, the alternative hypothesis of the Kruskal-Wallis test is that
________.
TABLE 18-4
A factory supervisor is concerned that the time it takes workers to complete an
important production task (measured in seconds) is too erratic and adversely affects
expected profits. The supervisor proceeds by randomly sampling 5 individuals per hour
for a period of 10 hours. The sample mean and range for each hour are listed below.
She also decides that lower and upper specification limit for the critical-to-quality
variable should be 10 and 30 seconds, respectively.
Referring to Table 18-4, what percentage of the time it takes workers to complete an
important production task will fall inside the specification limits?
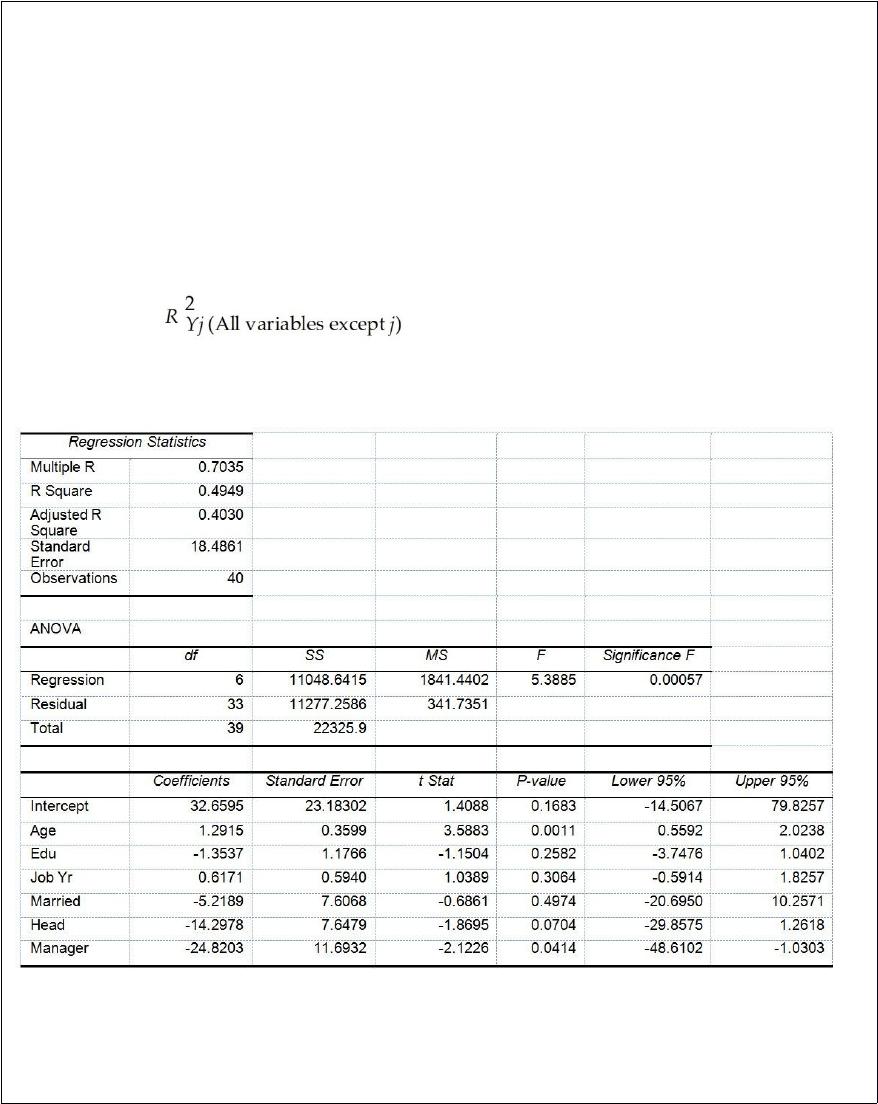
TABLE 17-10
Given below are results from the regression analysis where the dependent variable is
the number of weeks a worker is unemployed due to a layoff (Unemploy) and the
independent variables are the age of the worker (Age), the number of years of education
received (Edu), the number of years at the previous job (Job Yr), a dummy variable for
marital status (Married: 1 = married, 0 = otherwise), a dummy variable for head of
household (Head: 1 = yes, 0 = no) and a dummy variable for management position
(Manager: 1 = yes, 0 = no). We shall call this Model 1. The coefficient of partial
determination ( ) of each of the 6 predictors are, respectively,
0.2807, 0.0386, 0.0317, 0.0141, 0.0958, and 0.1201.
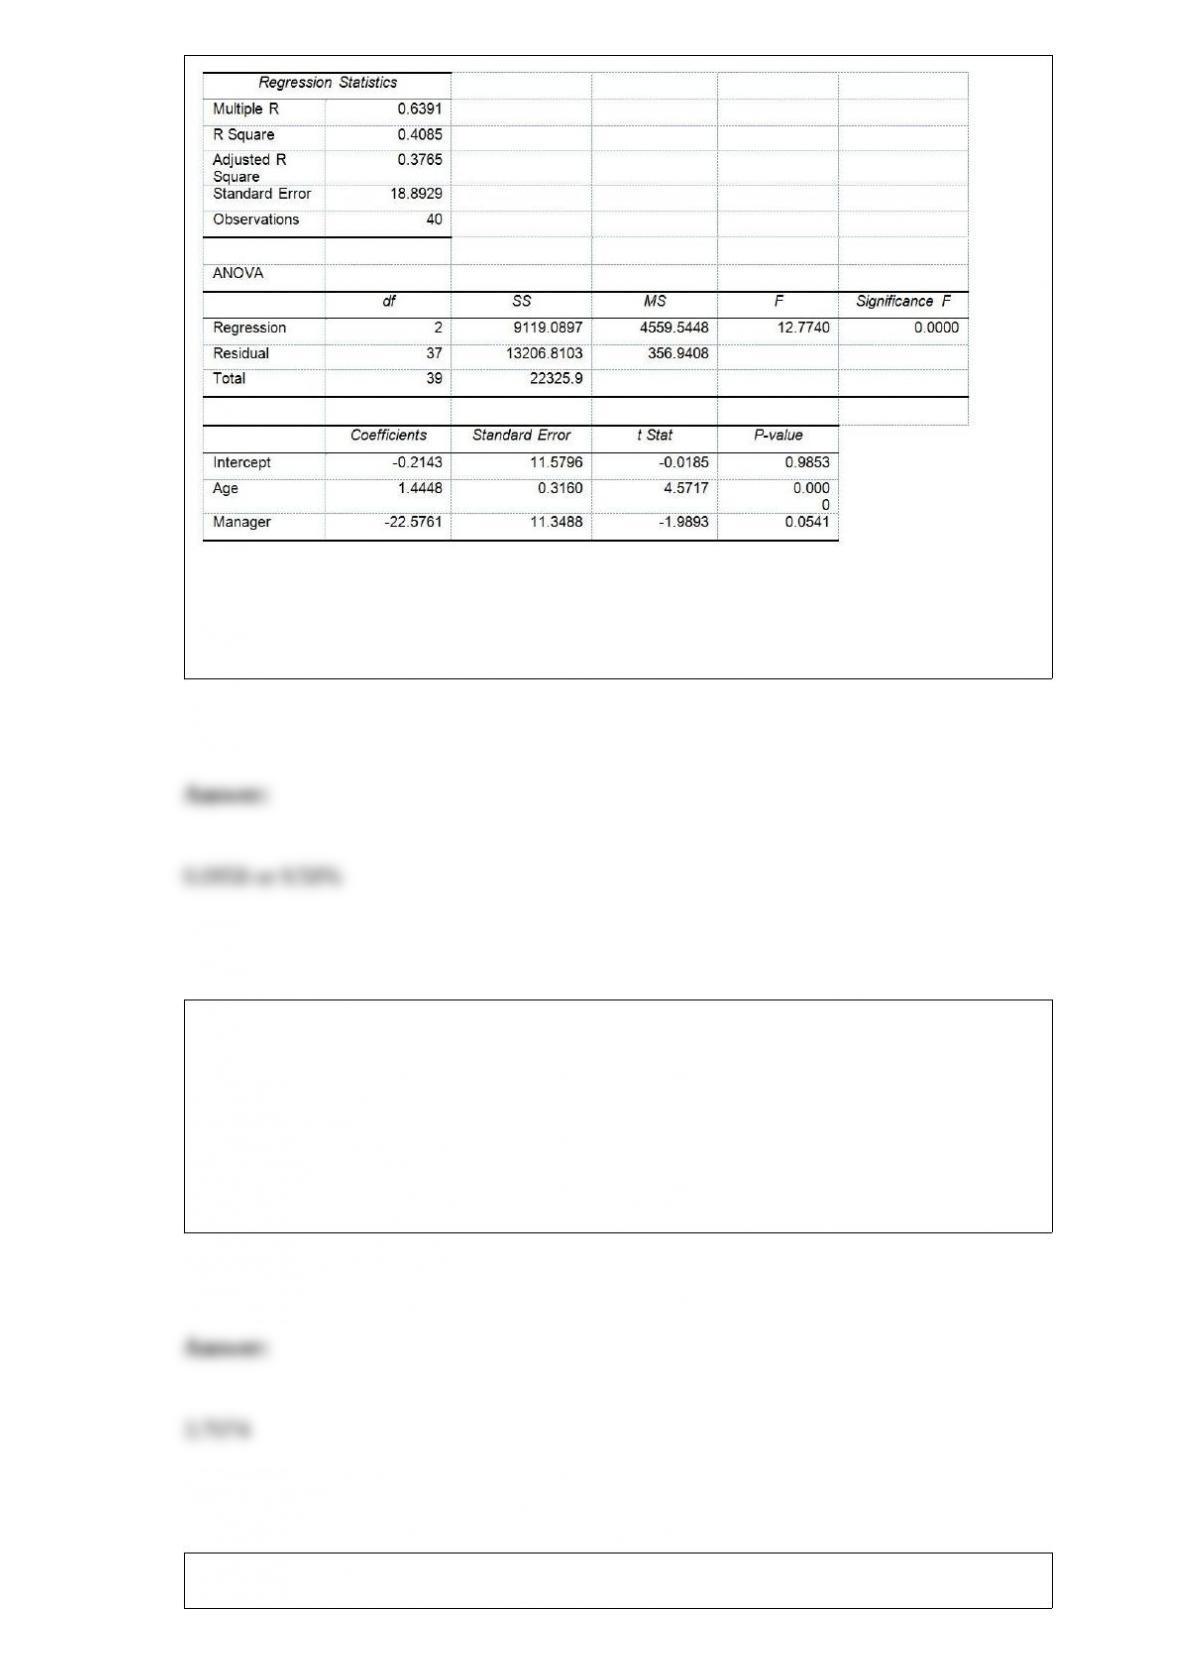
Model 2 is the regression analysis where the dependent variable is Unemploy and the
independent variables are Age and Manager. The results of the regression analysis are
given below:
Referring to Table 17-10, Model 1, ________ of the variation in the number of weeks a
worker is unemployed due to a layoff can be explained by whether the worker is head
of household while controlling for the other independent variables.
TABLE 8-4
The actual voltages of power packs labeled as 12 volts are as follows: 11.77, 11.90,
11.64, 11.84, 12.13, 11.99, and 11.77.
Referring to Table 8-4, the critical value for a 99% confidence interval for this sample is
________.
A study at a college in the west coast reveals that, historically, 45% of the students are

minority students. If a random sample size of 75 is selected, the probability is ________
that between 30% and 50% of the students in the sample will be minority students.