TABLE 17-9
What are the factors that determine the acceleration time (in sec.) from 0 to 60 miles per
hour of a car? Data on the following variables for 171 different vehicle models were
collected:
Accel Time: Acceleration time in sec.
Cargo Vol: Cargo volume in cu. ft.
HP: Horsepower
MPG: Miles per gallon
SUV: 1 if the vehicle model is an SUV with Coupe as the base when SUV and Sedan
are both 0
Sedan: 1 if the vehicle model is a sedan with Coupe as the base when SUV and Sedan
are both 0
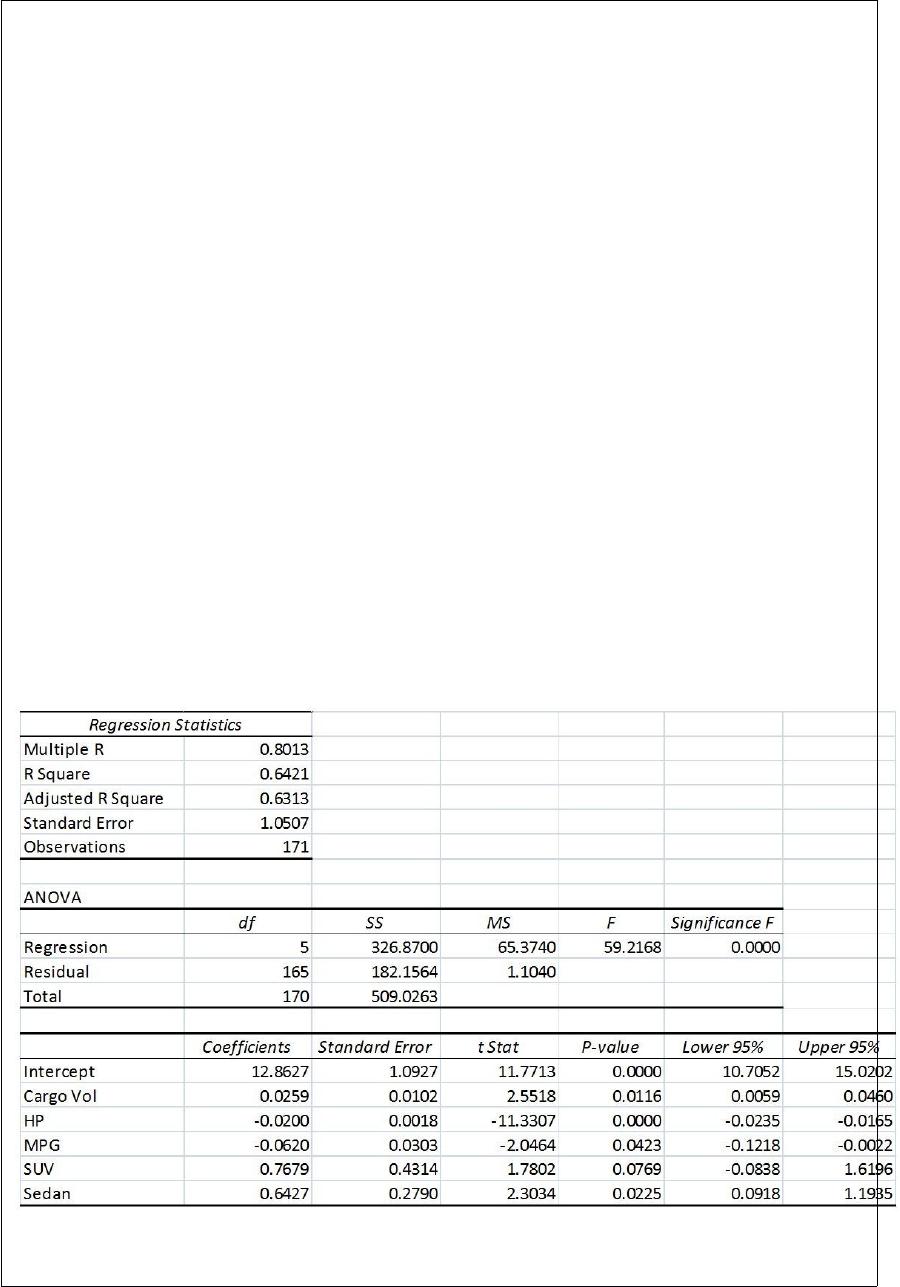
The regression results using acceleration time as the dependent variable and the
remaining variables as the independent variables are presented below.
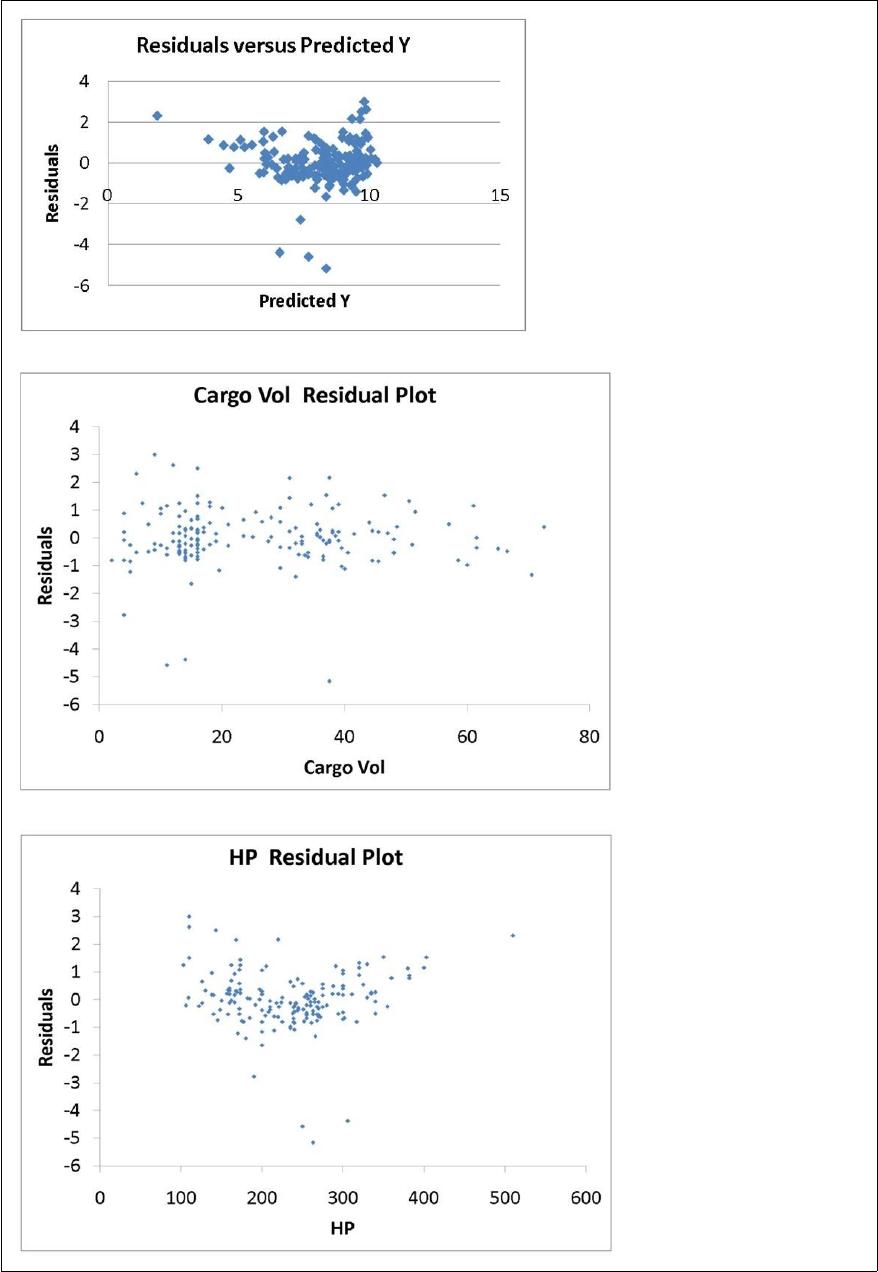
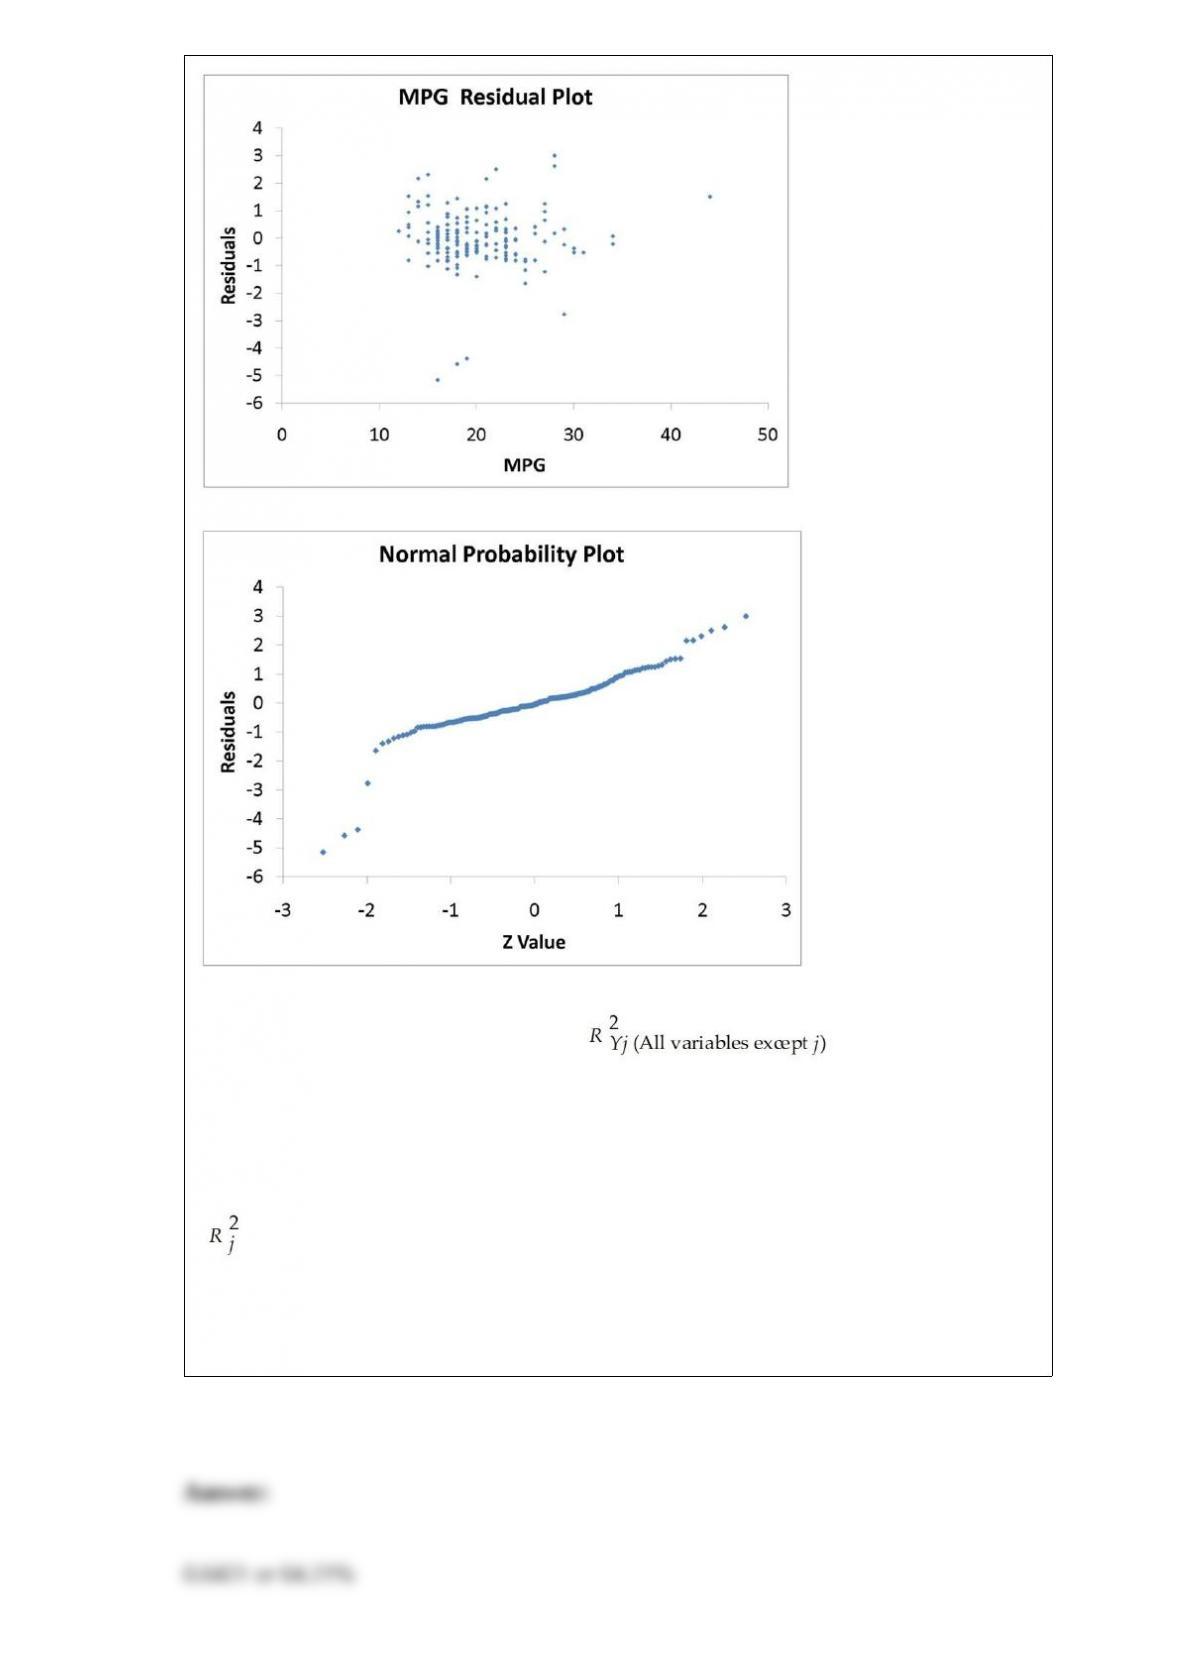
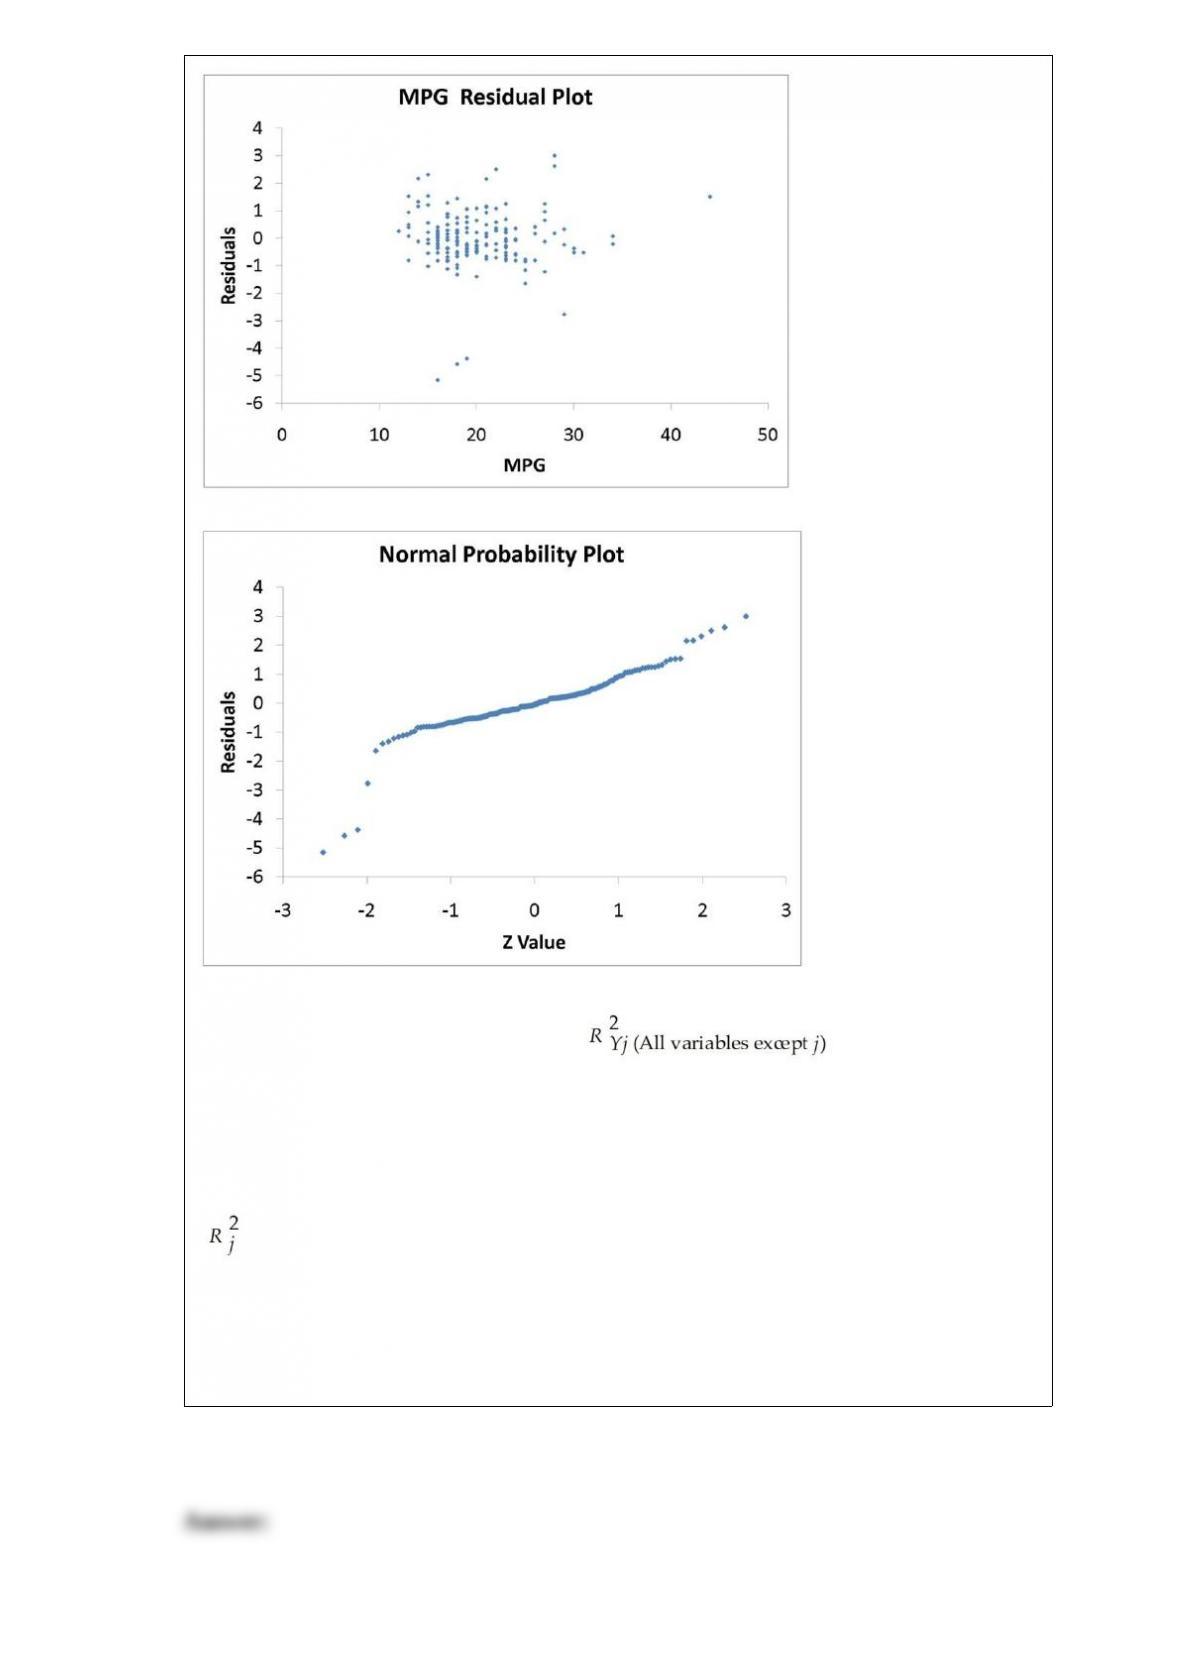
The various residual plots are as shown below.
The coefficient of partial determination ( ) of each of the 5
predictors are, respectively, 0.0380, 0.4376, 0.0248, 0.0188, and 0.0312.
The coefficient of multiple determination for the regression model using each of the 5
variables Xj as the dependent variable and all other X variables as independent variables
( ) are, respectively, 0.7461, 0.5676, 0.6764, 0.8582, 0.6632.
Referring to Table 17-9, ________ of the variation in Accel Time can be explained by
the five independent variables.
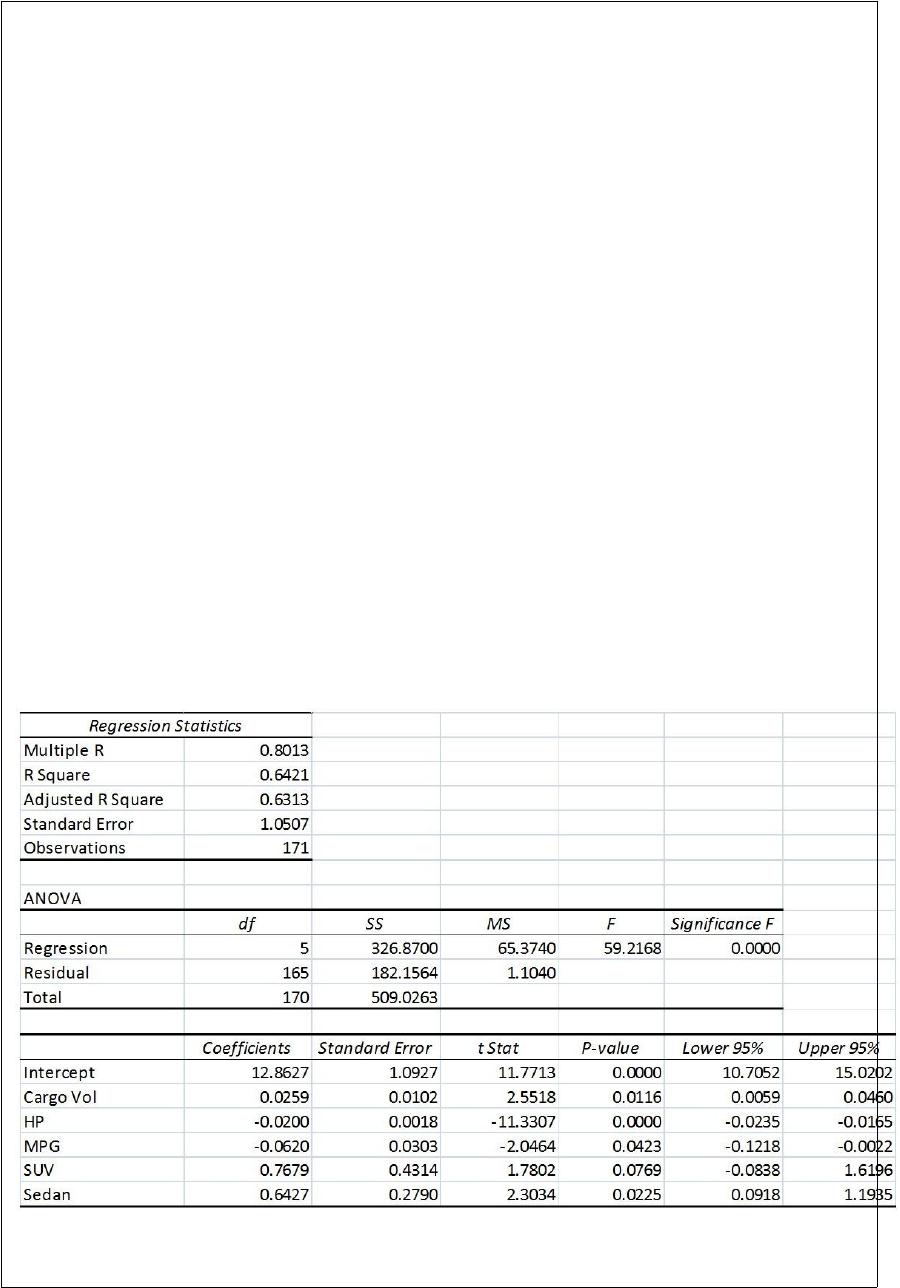
TABLE 17-9
What are the factors that determine the acceleration time (in sec.) from 0 to 60 miles per
hour of a car? Data on the following variables for 171 different vehicle models were
collected:
Accel Time: Acceleration time in sec.
Cargo Vol: Cargo volume in cu. ft.
HP: Horsepower
MPG: Miles per gallon
SUV: 1 if the vehicle model is an SUV with Coupe as the base when SUV and Sedan
are both 0
Sedan: 1 if the vehicle model is a sedan with Coupe as the base when SUV and Sedan
are both 0
The regression results using acceleration time as the dependent variable and the
remaining variables as the independent variables are presented below.
The various residual plots are as shown below.

The coefficient of partial determination ( ) of each of the 5
predictors are, respectively, 0.0380, 0.4376, 0.0248, 0.0188, and 0.0312.
The coefficient of multiple determination for the regression model using each of the 5
variables Xj as the dependent variable and all other X variables as independent variables
( ) are, respectively, 0.7461, 0.5676, 0.6764, 0.8582, 0.6632.
Referring to Table 17-9, what is the p-value of the test statistic to determine whether
Cargo Vol makes a significant contribution to the regression model in the presence of
the other independent variables at a 5% level of significance?

Suppose Z has a standard normal distribution with a mean of 0 and standard deviation
of 1. The probability that Z values are larger than ________ is 0.3483.
Referring to Table 14-19, what should be the decision (‘reject’ or ‘do
not reject’) on the null hypothesis when testing whether LawnSize
makes a signi”cant contribution to the model in the presence of
Income at a 0.05 level of signi”cance?
TABLE 14-19
The marketing manager for a nationally franchised lawn service
company would like to study the characteristics that di,erentiate
home owners who do and do not have a lawn service. A random
sample of 30 home owners located in a suburban area near a large
city was selected; 11 did not have a lawn service (code 0) and 19 had
a lawn service (code 1). Additional information available concerning
these 30 home owners includes family income (Income, in thousands
of dollars) and lawn size (Lawn Size, in thousands of square feet).
The PHStat output is given below:
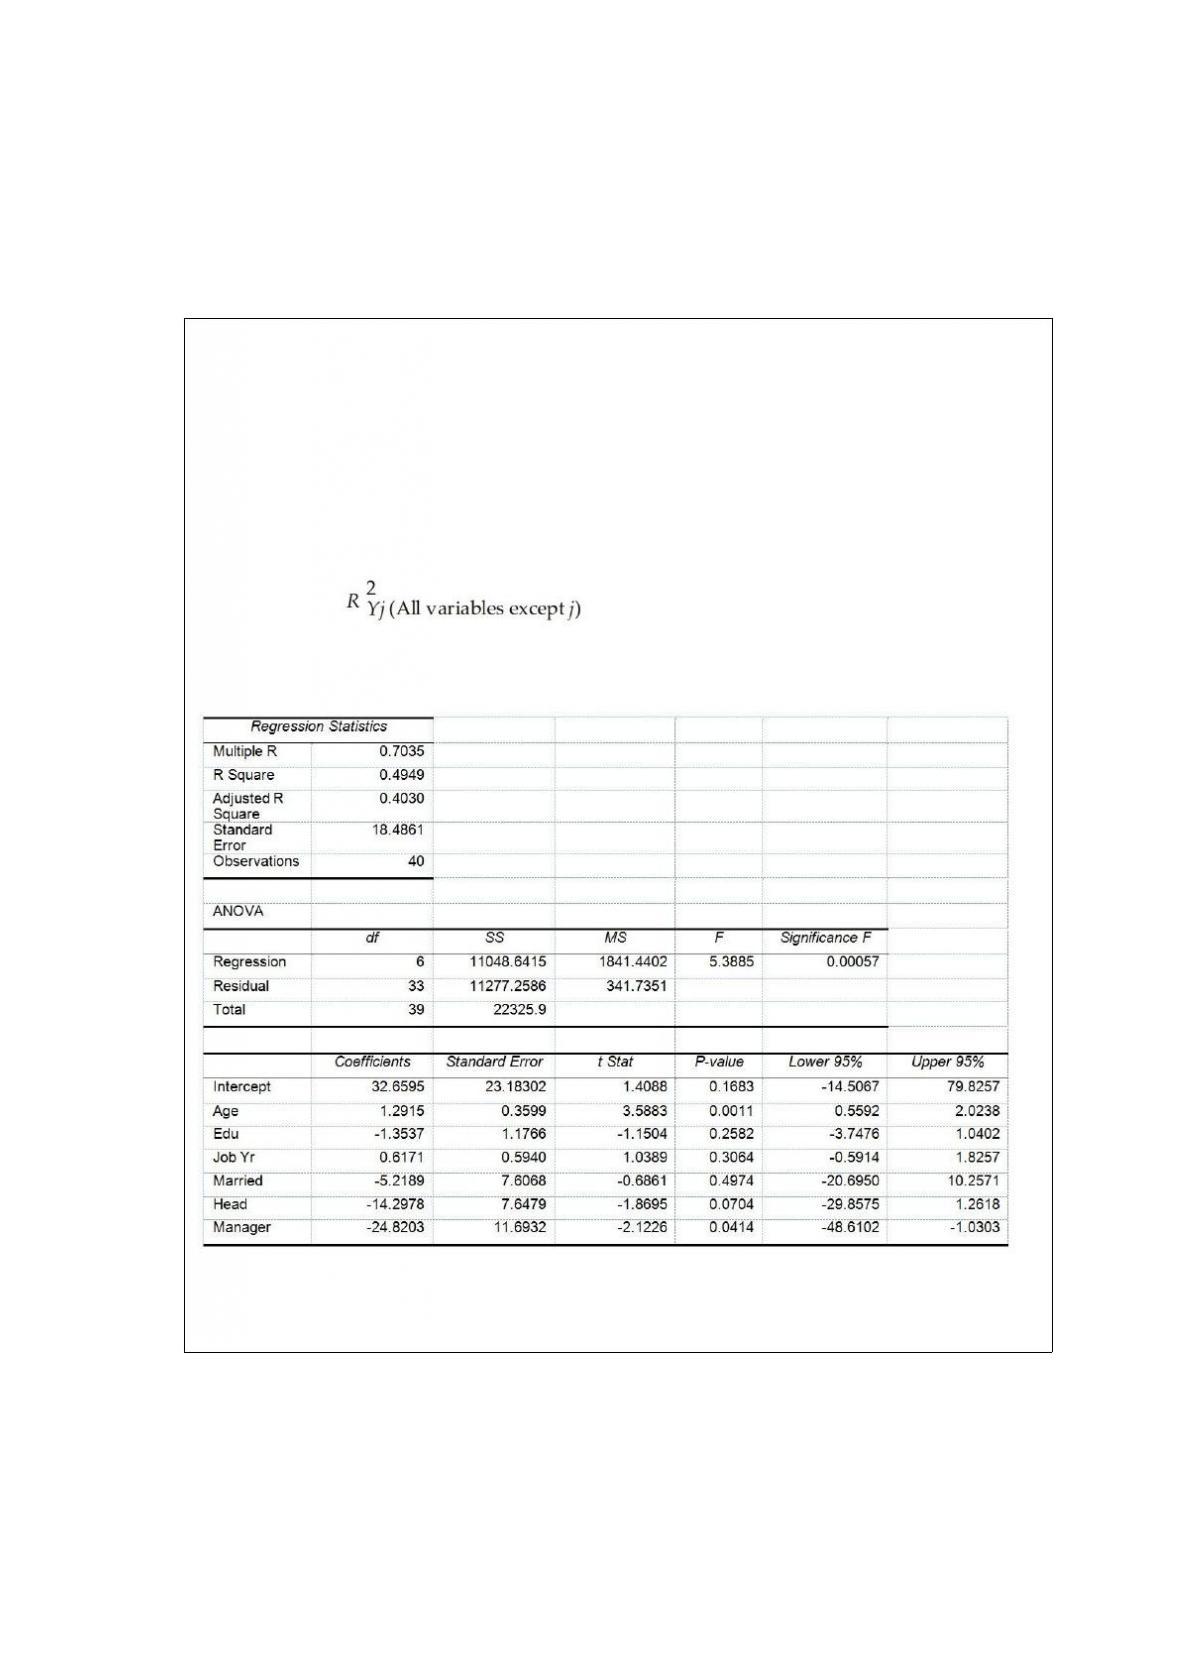
TABLE 17-10
Given below are results from the regression analysis where the dependent variable is
the number of weeks a worker is unemployed due to a layoff (Unemploy) and the
independent variables are the age of the worker (Age), the number of years of education
received (Edu), the number of years at the previous job (Job Yr), a dummy variable for
marital status (Married: 1 = married, 0 = otherwise), a dummy variable for head of
household (Head: 1 = yes, 0 = no) and a dummy variable for management position
(Manager: 1 = yes, 0 = no). We shall call this Model 1. The coefficient of partial
determination ( ) of each of the 6 predictors are, respectively,
0.2807, 0.0386, 0.0317, 0.0141, 0.0958, and 0.1201.
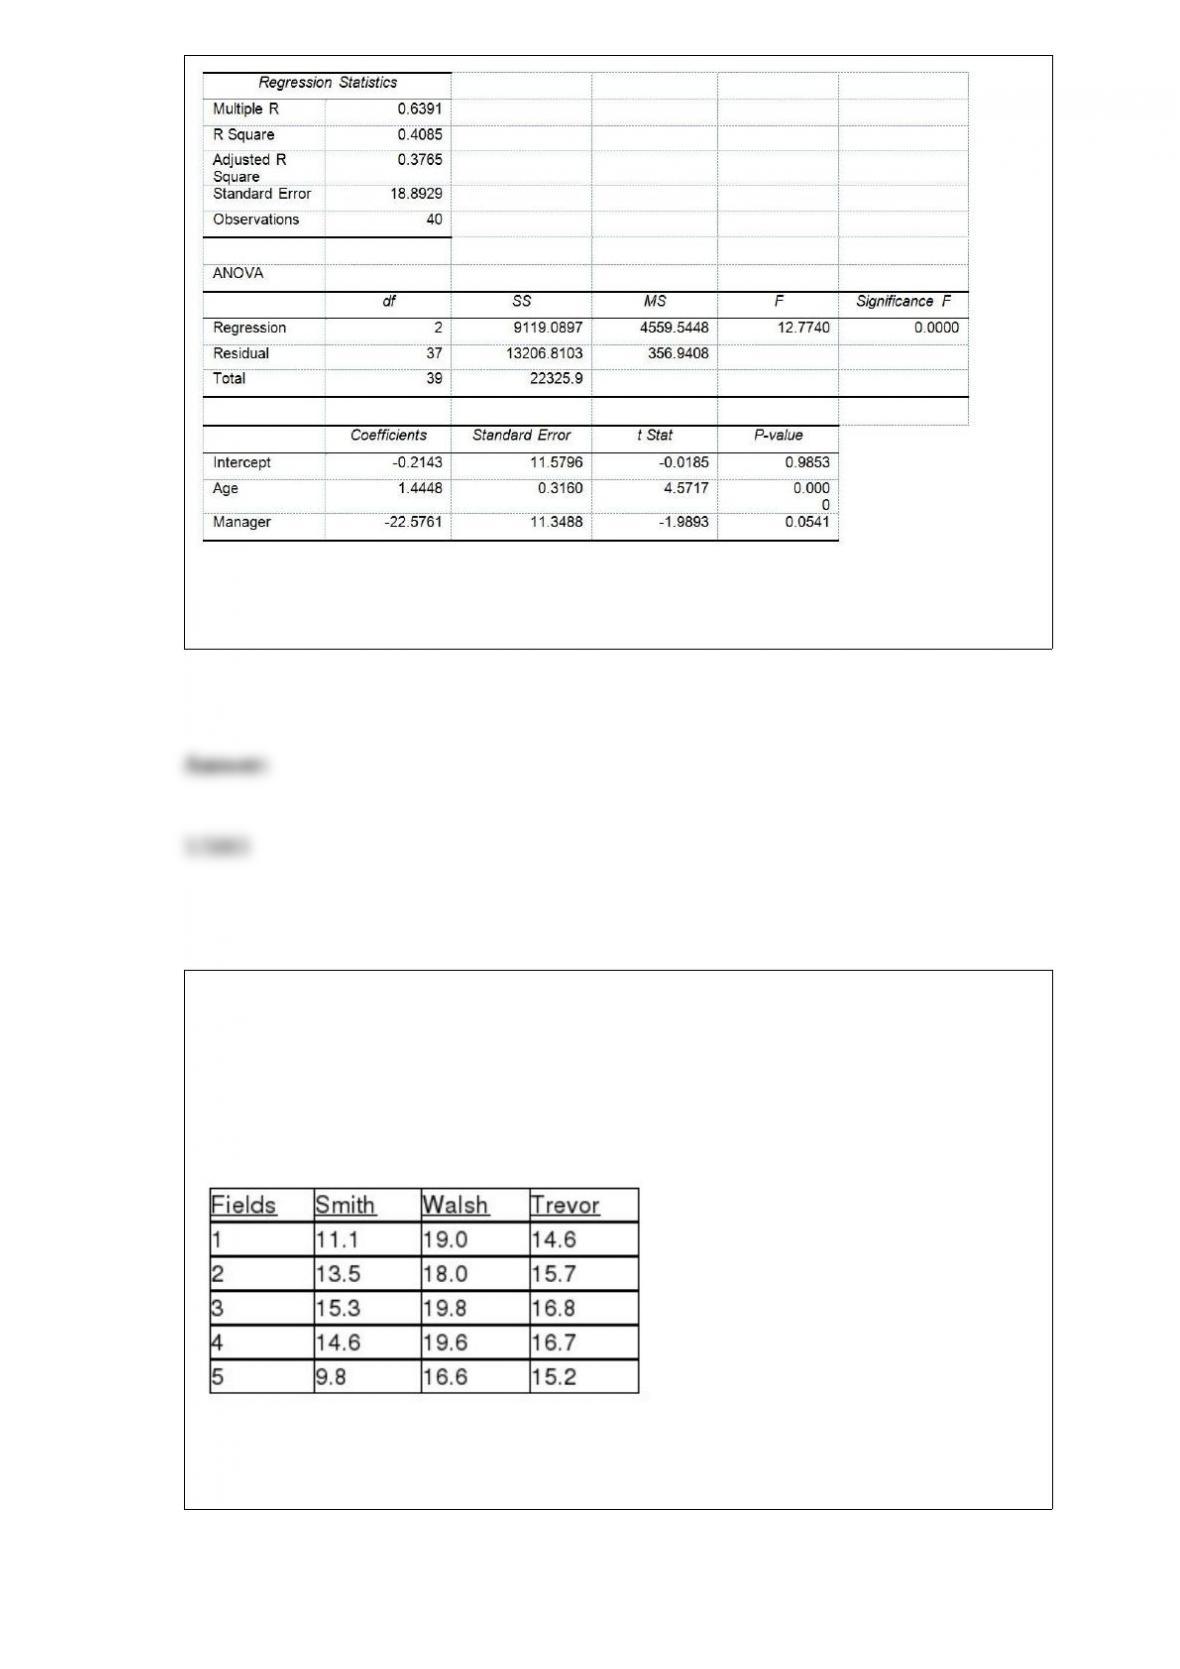
Model 2 is the regression analysis where the dependent variable is Unemploy and the
independent variables are Age and Manager. The results of the regression analysis are
given below:
Referring to Table 17-10, Model 1, what is the value of the test statistic when testing
whether age has any effect on the number of weeks a worker is unemployed due to a
layoff while holding constant the effect of all the other independent variables?
TABLE 11-10
An agronomist wants to compare the crop yield of 3 varieties of chickpea seeds. She
plants all 3 varieties of the seeds on each of 5 different patches of fields. She then
measures the crop yield in bushels per acre. Treating this as a randomized block design,
the results are presented in the table that follows.
Referring to Table 11-10, what is the value of the test statistic for the randomized block
F test for the difference in the means?
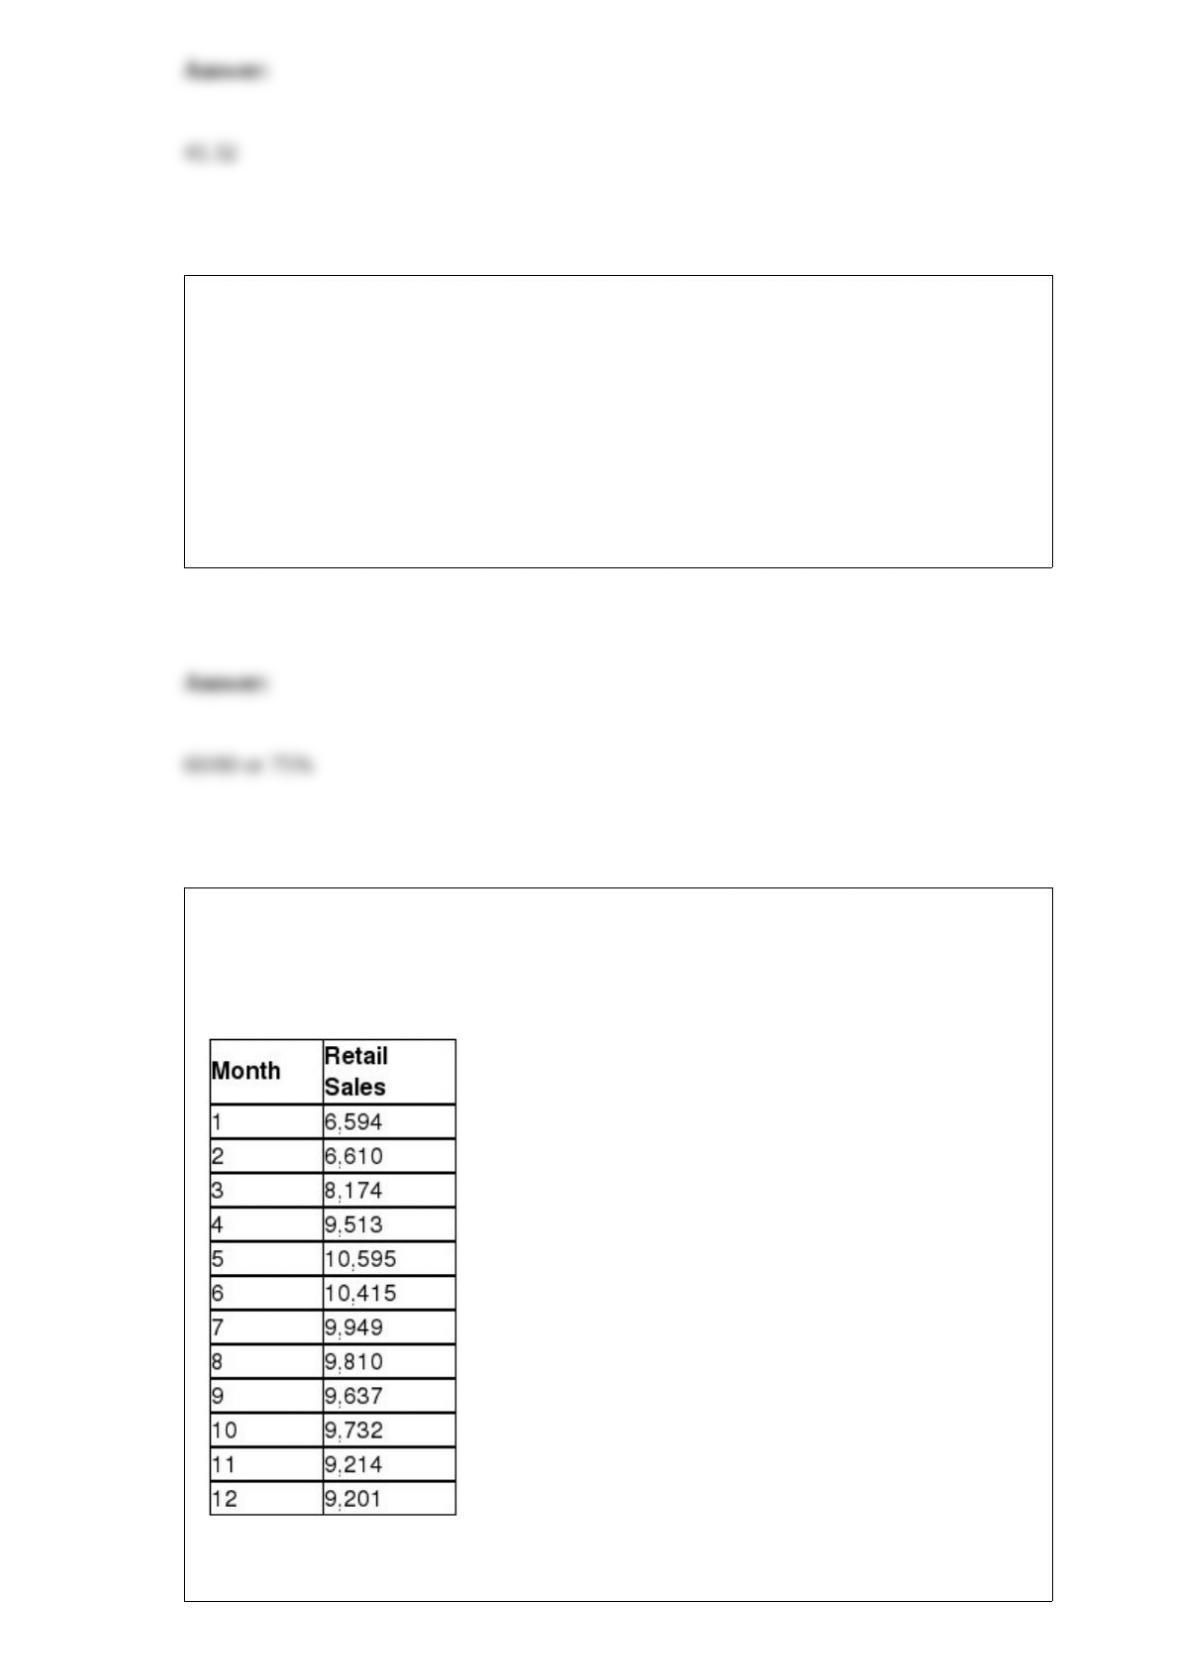
TABLE 4-3
A survey is taken among customers of a fast-food restaurant to determine preference for
hamburger or chicken. Of 200 respondents selected, 75 were children and 125 were
adults. 120 preferred hamburger and 80 preferred chicken. 55 of the children preferred
hamburger.
Referring to Table 4-3, assume we know that a person prefers chicken. The probability
that this individual is an adult is ________.
TABLE 16-13
Given below is the monthly time-series data for U.S. retail sales of building materials
over a specific year.
The results of the linear trend, quadratic trend, exponential trend, first-order
autoregressive, second-order autoregressive and third-order autoregressive model are
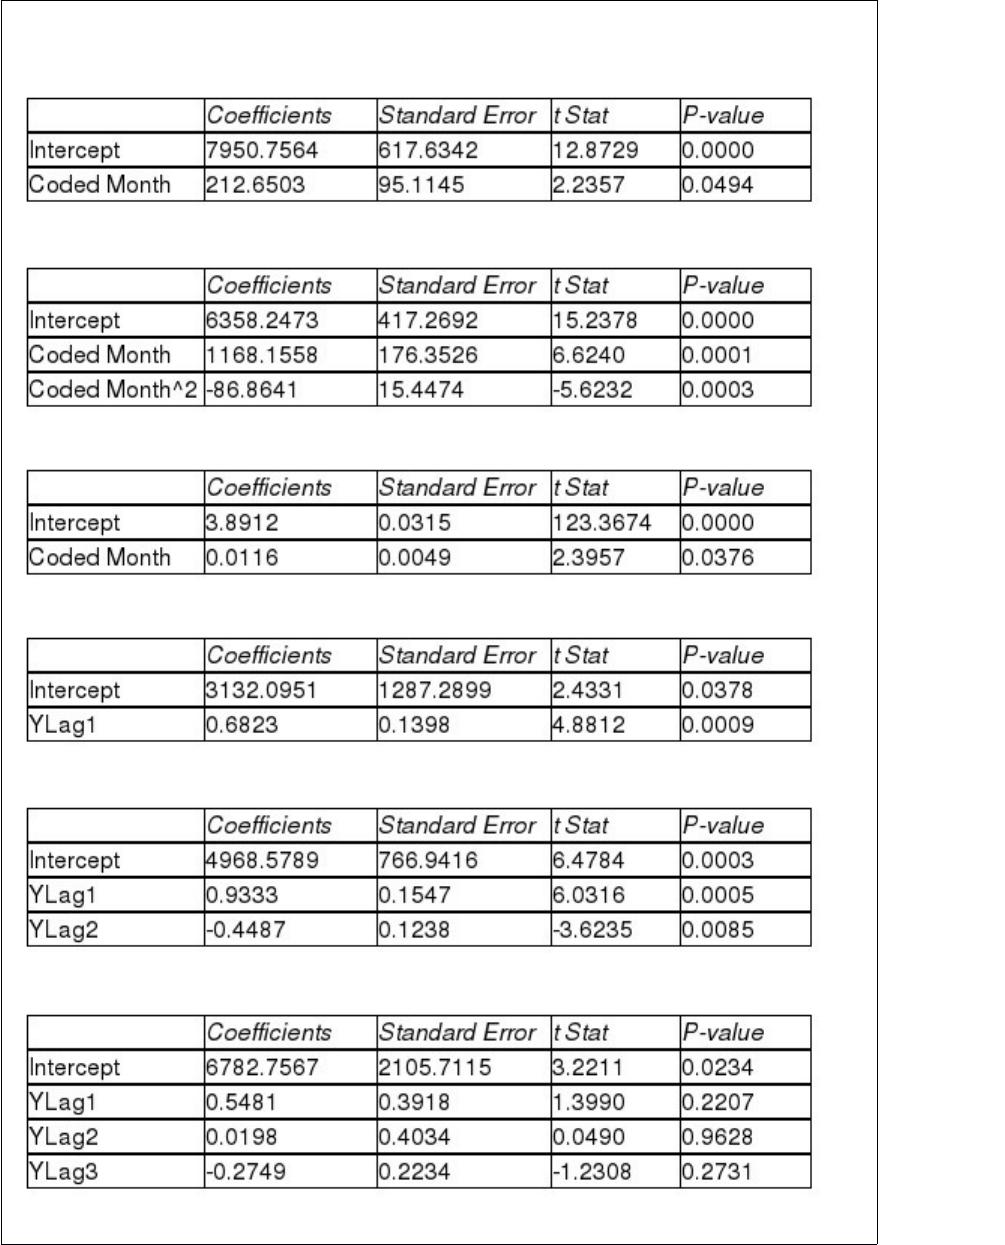
presented below in which the coded month for the 1st month is 0:
Linear trend model:
Quadratic trend model:
Exponential trend model:
First-order autoregressive:
Second-order autoregressive:
Third-order autoregressive:
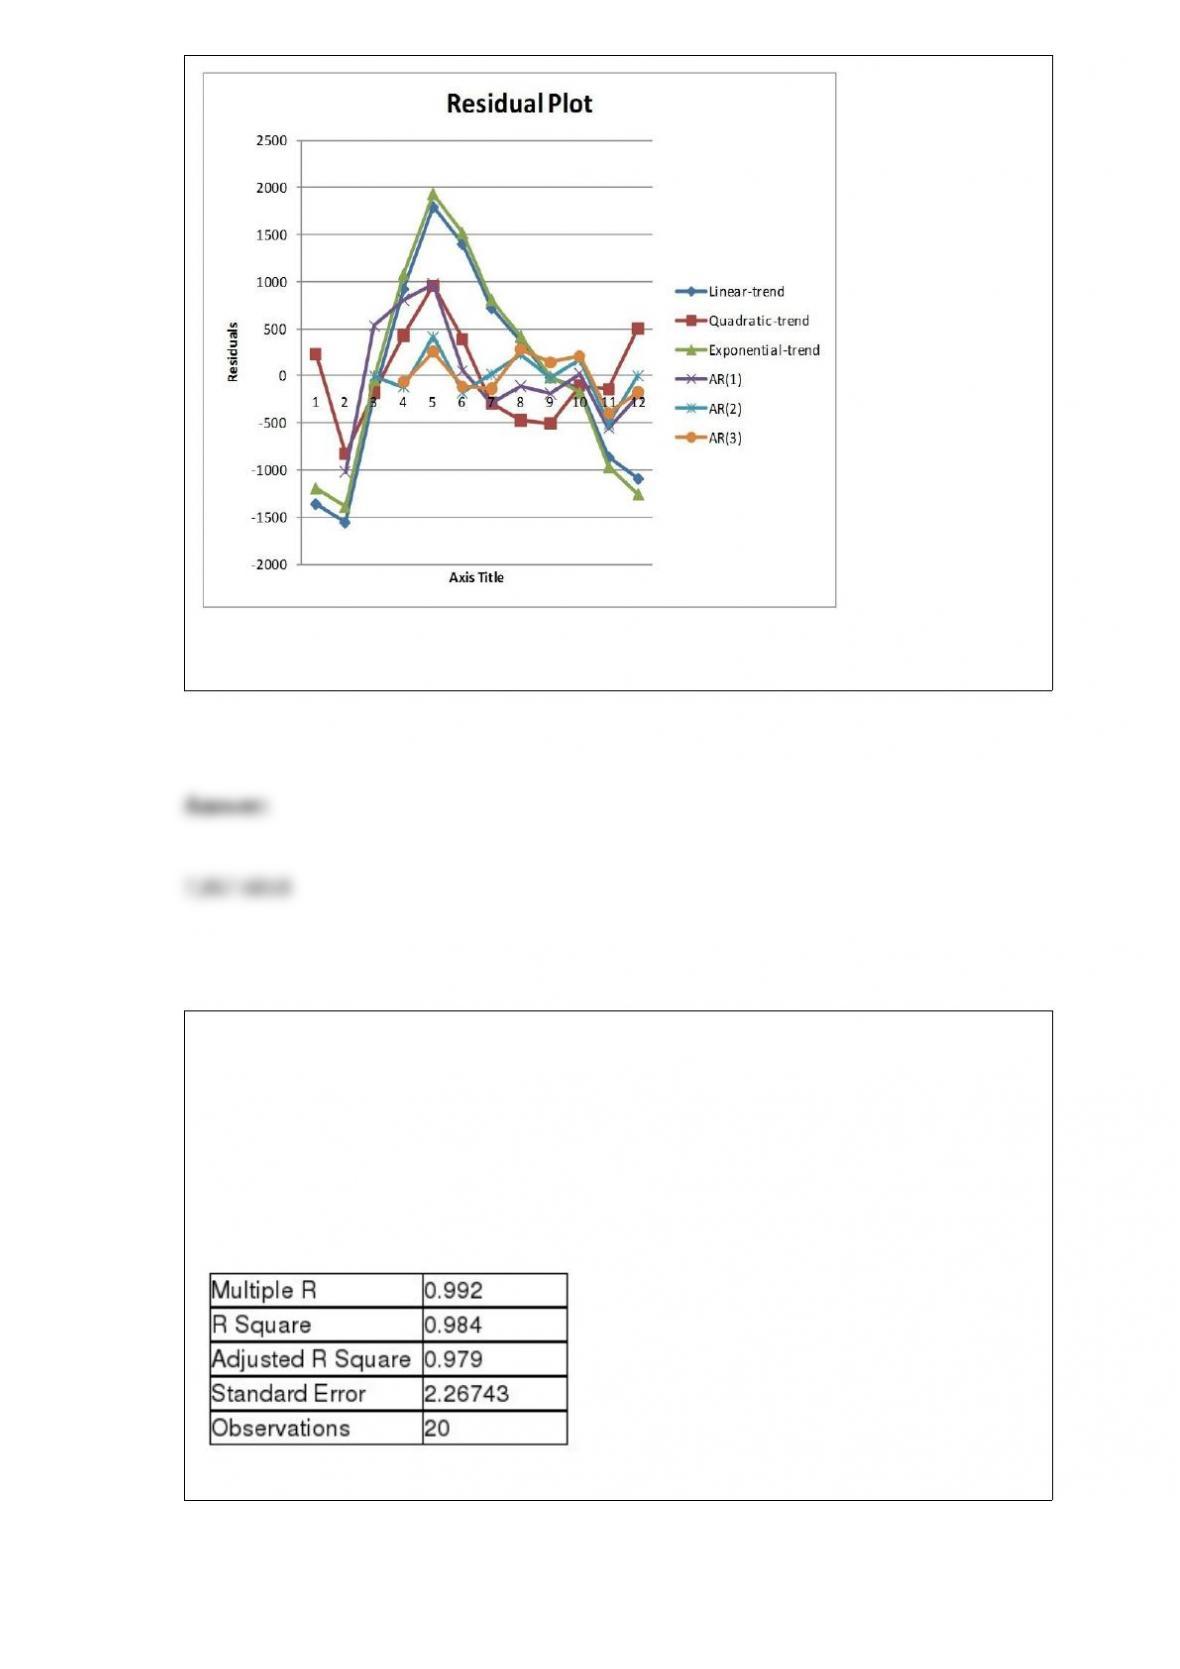
Below is the residual plot of the various models:
Referring to Table 16-13, what is your forecast for the 13th month using the
quadratic-trend model?
TABLE 17-3
A financial analyst wanted to examine the relationship between salary (in $1,000) and 4
variables: age (X1 = Age), experience in the field (X2 = Exper), number of degrees (X3 =
Degrees), and number of previous jobs in the field (X4 = Prevjobs). He took a sample of
20 employees and obtained the following Microsoft Excel output:
SUMMARY OUTPUT
Regression Statistics
ANOVA
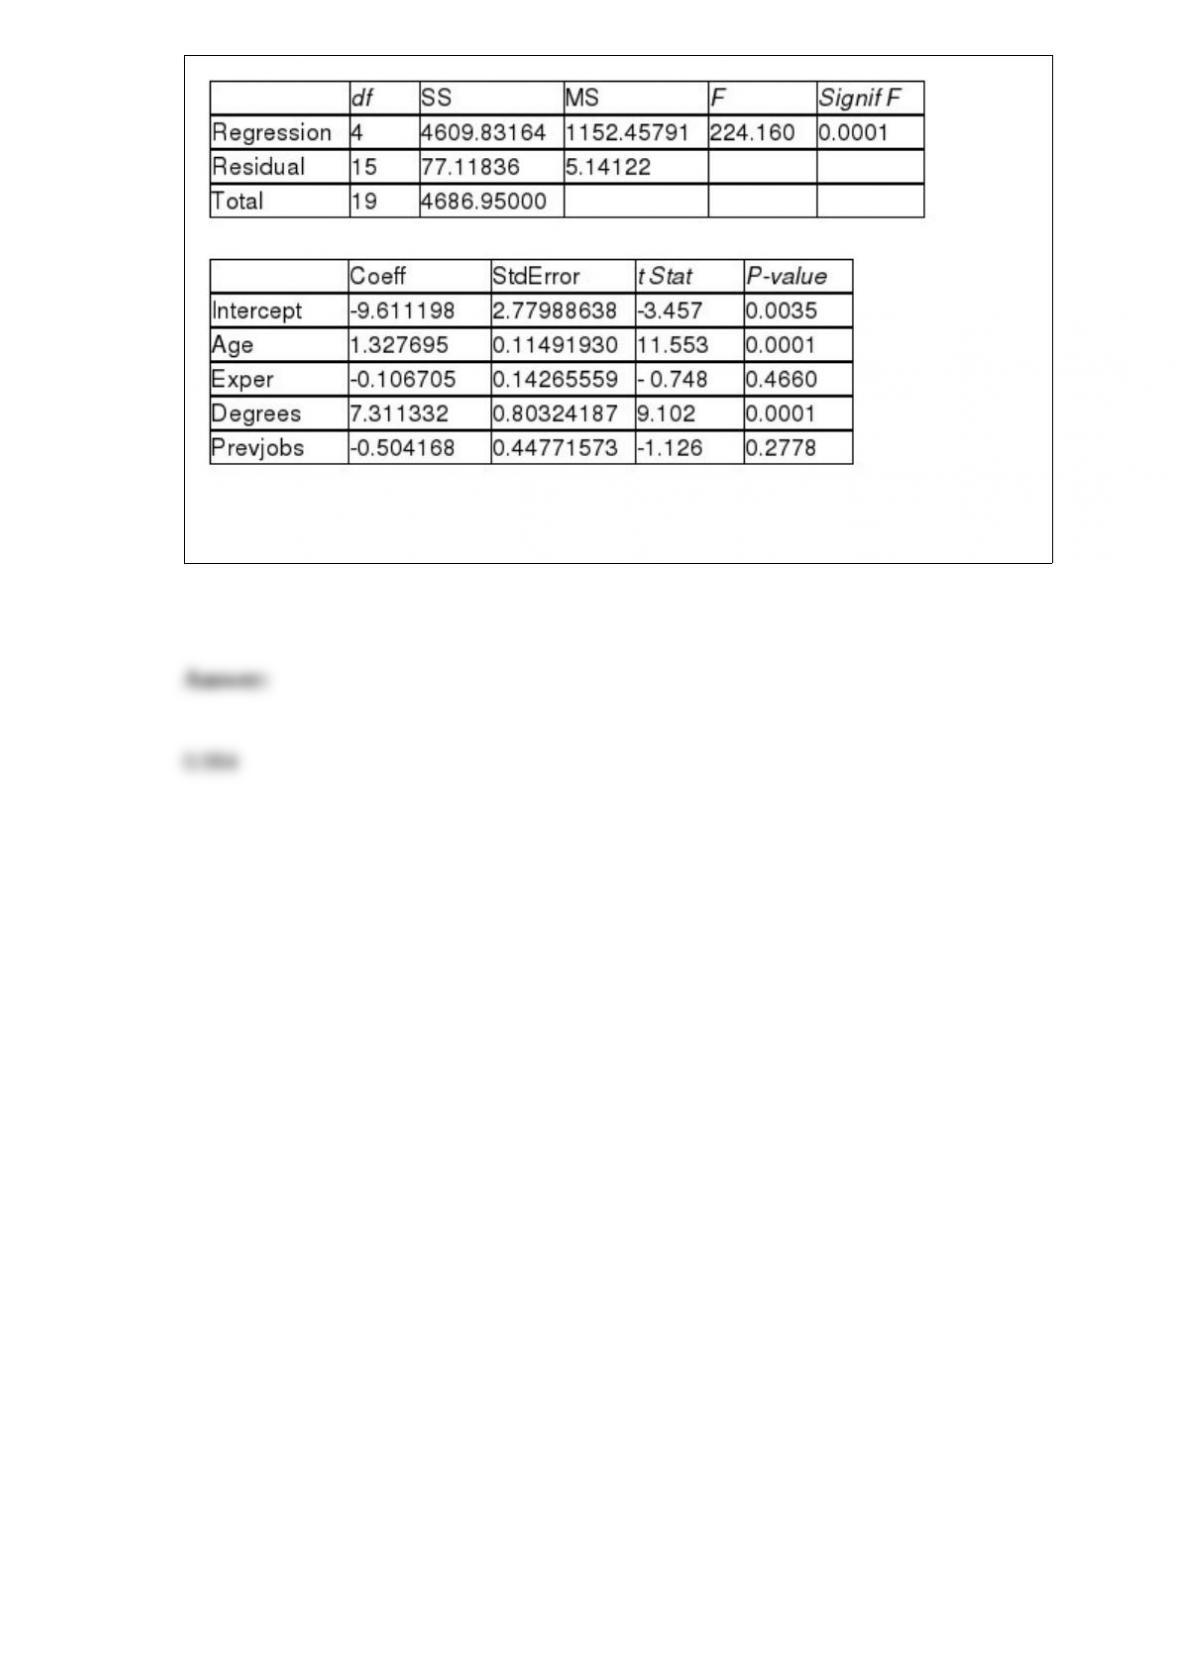
Referring to Table 17-3, the value of the coefficient of multiple determination, r2
Y.1234,
is ________.